839
MS
AJNR Am J Neuroradiol 21:839–844, May 2000
X-linked Adrenoleukodystrophy: The Role of
Contrast-enhanced MR Imaging in Predicting
Disease Progression
Elias R. Melhem, Daniel J. Loes, Christos S. Georgiades, Gerald V. Raymond, and Hugo W. Moser
BACKGROUND AND PURPOSE: Early assignment of disease progression among patients
with X-linked adrenoleukodystrophy (ALD) is critical for the appropriate selection of effective therapy. We evaluated the association between contrast enhancement on T1-weighted spin-echo MR images and disease progression.
METHODS: Clinical charts of patients with X-linked ALD were reviewed for age, availability
of MR images of the brain, severity of neurologic impairment, and duration and number of follow-up evaluations. Forty-three male patients with X-linked ALD had undergone multiple MR imaging examinations of the brain that consisted of at least sagittal and axial T1-weighted spin-echo, axial double-echo spin-echo, and contrast-enhanced axial T1-weighted spin-echo im-aging. The MR images were reviewed for the presence of contrast enhancement. In addition, global disease burden, as shown by the double-echo spin-echo images, was assessed using a visual scoring method (Loes score).
RESULTS: Enhancement was seen on the initial T1-weighted spin-echo MR images of 21
(49%) patients; 18 (86%) of the 21 patients had disease progression revealed by the follow-up evaluations based on MR imaging (Loes) and neurologic scores. No enhancement was seen on the initial T1-weighted spin-echo MR images of 22 (51%) patients; for 18 (82%) of the 22 patients, no evidence of disease progression was revealed by the follow-up evaluations.
CONCLUSION: There is a very strong association between the presence of contrast enhancement
on T1-weighted MR images and X-linked ALD progression based on clinical evaluation and MR imaging.
X-linked adrenoleukodystrophy (ALD) is a rare per-oxisomal disorder that affects the white matter of the CNS, adrenal cortex, and testes (1–3). The ge-netic defect responsible for X-linked ALD is located in Xq28, the terminal segment of the long arm of the X chromosome (4). This gene normally encodes for a peroxisomal membrane protein called ALD-P. X-linked ALD is reliably diagnosed by a plasma assay that reveals elevated levels of saturated, very long chain fatty acids (C.22:0) (5–8). Neverthe-less, plasma assays have been found to be unreli-able markers for disease progression, irrespective
Received July 1, 1999; accepted after revision November 22. From the Department of Radiology and Radiological Sci-ences (E.R.M., C.S.G.), The Johns Hopkins Medical Institu-tions, Baltimore, MD; Suburban Radiologic Consultants, Ltd. (D.J.L.), Minneapolis, MN; and the Department of Neuroge-netics (G.V.R., H.W.M.), Kennedy Krieger Institute, The Johns Hopkins Medical Institutions, Baltimore, MD.
Supported in part by National Institutes of Health grant 00052.
Address reprint requests to Elias R. Melhem, MD, Depart-ment of Radiology, The Johns Hopkins Hospital, 600 North Wolfe Street, Baltimore, MD 21287.
qAmerican Society of Neuroradiology
of subtype. Furthermore, clinical markers (neuro-logic and cognitive scores) are relatively insensitive to early nervous system involvement and minor disease progression (9).
Pathologically, cerebral ALD is characterized by cerebral white matter demyelination, perivascular infiltrates, and loss of tight junctions resulting from an autoimmune- or cytokine-mediated inflamma-tory process (10). The severity of the inflammainflamma-tory process has been correlated with the rapidity of dis-ease progression (11). Contrast-enhanced T1-weighted spin-echo MR imaging may serve as a marker for the presence and the severity of this inflammatory process (12).
In this study, we evaluated the association between contrast enhancement on the T1-weighted spin-echo MR images of patients with X-linked ALD and dis-ease progression based on clinical evaluation and MR imaging scores. Our null hypothesis was that there is no association between contrast enhancement and disease progression in X-linked ALD.
Methods
Participants
AJNR: 21, May 2000 840 MELHEM
FIG 1. Plots of the Loes scores, based on double-echo spin-echo MR images obtained during different follow-up examinations for 21 patients with ALD. The T1-weighted spin-echo images were contrast-enhanced. There is an increase in the MR score (increased disease burden) on the follow-up images of all except two patients.
1992 and 1998 were reviewed for age, availability of MR im-ages of the brain, severity of neurologic impairment, and du-ration and number of follow-up evaluations. Inclusion criteria were: 1) definite diagnosis of X-linked ALD by serum assay and genetic testing; 2) receiving a special dietary regimen (glyceryl triolate and trierucate oils, Lorenzo’s oil) and no oth-er thoth-erapies; 3) availability of at least two evaluations each, including a detailed neurologic assessment performed by an experienced pediatric neurologist and MR imaging of the brain.
Forty-three male patients (average age at the time of the first MR imaging examination, 12.9 years; age range, 3–51 years) with X-linked ALD fulfilled the above inclusion criteria. The Kurtzke’s expanded disability status scale was used for scoring the initial and follow-up clinical evaluations based on the sta-tus of pyramidal, cerebellar, brain stem, sensory, bowel, blad-der, visual, auditory, and mental functions.
MR Imaging
All patients included in the study had undergone multiple MR imaging examinations of the brain that were performed at various institutions. The images were sent to the Neuro-Ge-netics Center. The examinations were performed in different centers between 1992 and 1998 on a variety of middle- and high-field strength MR imagers with different gradient perfor-mance capabilities. All examinations consisted of at least sag-ittal and axial T1-weighted spin-echo imaging (500–600/15– 25 [TR/TE]), axial double-echo spin-echo imaging (2500– 3500/20–30, 80–100), and contrast-enhanced (;0.10 mmol/kg gadopentetate dimeglumine) axial T1-weighted spin-echo im-aging (500–600/15–20). Internal review board approval and informed consent were obtained for the MR imaging that was performed at our institution. In addition, informed consent was obtained for reviewing the MR images that had been obtained at outside institutions.
All MR images were reviewed by two experienced neuro-radiologists for the presence of contrast enhancement on the T1-weighted spin-echo images. Also, global disease burden, as seen on the double-echo spin-echo images, was assessed using a visual scoring method. The severity score, described by Loes et al (13), was based on a point system derived from the lo-cation of white matter involvement and the presence of focal or global atrophy. The score range for this method was 0 (no white matter involvement and no atrophy) to 34 (white matter
involvement in 33 predefined anatomic locations and global atrophy) (13). The reviewers were blinded to the neurologic findings. Disagreement between the two reviewers was re-solved by consensus. For the assessment of progression of white matter involvement and persistent contrast enhancement, the first MR imaging examination was used as a reference for all subsequent examinations.
Statistical Analysis
Thex2test was used to evaluate the association between the
progression of disease, based on clinical and MR imaging scores, and the presence of contrast enhancement on T1-weighted spin-echo images. Thex2 test was chosen because
the data were nominal and the expected frequency in each cell of the contingency tables was greater than 5. The latter safe-guarded against inflation of thex2values.
Results
The average duration of follow-up was 18.3 months (range, 1–46 months) with the follow-up interval ranging from 1 to 12 months. The average number of follow-up evaluations, which included neurologic assessment and MR imaging examina-tions, was 3.1 (range, two to six).
[image:2.612.106.469.57.259.2]AJNR: 21, May 2000 X-LINKED ADRENOLEUKODYSTROPHY 841
FIG 2. X-linked ALD in 43-year-old man with rapidly progressive spasticity, deafness, visual deficits, and personality changes. A, Initial contrast-enhanced axial T1-weighted MR image (550/24), obtained at the level of the lateral ventricles, shows curvilinear enhancement outlining the periphery of the zone of demyelination (arrowheads).
B, Contiguous axial proton density–weighted MR images (2500/30), obtained at the level of the centrum semiovale at the same time as the image shown inpanel A, show very mild white matter abnormalities.
C, Six-month follow-up axial proton density–weighted MR images (3000/30), obtained at a level similar to that shown in panel B, show confluent and symmetrical white matter hyperintensity in both parietal lobes (arrows), confirming the progression of disease.
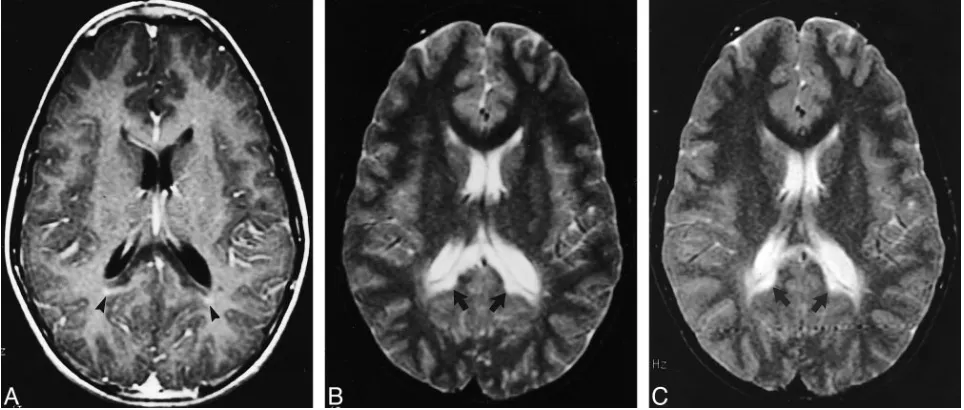
2). One patient, who was among the group of five patients whose follow-up T1-weighted spin-echo MR images did not show persistent enhancement, had no evidence of disease progression revealed by either MR imaging or neurologic evaluation (Fig 3). A second patient had disease progression re-vealed by MR imaging only, and a third patient had disease progression revealed by neurologic assess-ment only.
No enhancement was seen on the initial and fol-low-up T1-weighted spin-echo MR images of 22 (51%) of the patients with X-linked ALD. For this group, the average duration of follow-up was 22.0 months (range, 2–46 months), the average number of follow-up evaluations was 3.2 (range, two to six), and the average age at the time of the first MR imaging examination was 12.2 years. Eighteen (82%) patients had no evidence of disease
progres-sion revealed by follow-up evaluations based on MR imaging (Loes) and neurologic scores (Fig 4). There were two patients who had evidence of dis-ease progression revealed by follow-up MR imag-ing only and two patients who had evidence of dis-ease progression revealed by follow-up neurologic assessment only.
There was a very strong association between the presence of contrast enhancement on the T1-weighted MR images and disease progression based on clinical and MR imaging scores (x2 5
28.5, P,.001; x2528.5, P,.001, respectively)
(Tables 1 and 2).
Discussion
[image:3.612.60.541.56.444.2]AJNR: 21, May 2000 842 MELHEM
FIG 3. Images of a 12-year-old male patient with X-linked ALD with stable neurologic function.
A, Initial contrast-enhanced axial T1-weighted MR image (500/20), obtained at the level of the splenium of the corpus callosum, shows minimal linear enhancement outlining the periphery of the zone of demyelination (arrowheads).
B, Axial T2-weighted MR image (3000/100), obtained at the level of the splenium of the corpus callosum at the same time as the image shown inpanel A, shows confluent and symetrical white matter hyperintensity limited the splenium of the corpus callosum and both forceps major (arrows).
C, Thirty-month follow-up axial T2-weighted MR image (3000/100), obtained at a level similar to that shown in panel B, shows no interval change (arrows).
[image:4.612.47.529.59.264.2]FIG 4. Plots of the Loes scores, based on double-echo spin-echo MR images, obtained at different follow-up examinations for 22 patients with ALD. The T1-weighted spin-echo images were unenhanced. There is no change in the MR score (no change in disease burden) on the follow-up images of all three patients.
TABLE 2: Progression of disease burden, based on clinical as-sessment, in ALD patients with versus without evidence of gado-linium enhancement
Number of Patients
Enhancement (2)
Enhancement
(1) Total
No Progression Progression Total
20 2 22
2 19 21
[image:4.612.110.470.379.568.2]22 21 43 TABLE 1: Progression of disease burden, based on MR imaging,
in ALD patients with versus without evidence of gadolinium en-hancement
Number of Patients
Enhancement (2)
Enhancement
(1) Total
No Progression Progression Total
20 2 22
2 19 21
[image:4.612.46.274.677.739.2] [image:4.612.300.526.678.738.2]AJNR: 21, May 2000 X-LINKED ADRENOLEUKODYSTROPHY 843
proper management. Timely identification of pa-tients with rapidly progressing cerebral ALD al-lows the institution of effective therapies such as bone marrow transplantation (14). Because of con-siderable associated morbidity and mortality, bone marrow transplantation is currently reserved for pa-tients with early cerebral involvement who are at risk for rapid progression (14).
Specific plasma assays and MR imaging are ro-bust methods for the diagnosis and early detection of CNS involvement in cases of X-linked ALD (7, 8). Unfortunately, there are no established methods that can reliably predict disease progression.
Characteristic contrast enhancement patterns on T1-weighted MR images in cases of cerebral ALD are well described (12). The enhancement is attrib-uted to a breakdown of the blood-brain barrier re-sulting from an autoimmune- or cytokine-mediated inflammatory process (15). The severity of the in-flammatory process has been correlated with the rapidity of disease progression (11). In our study, contrast enhancement seen on the T1-weighted spin-echo MR images of the brain, when present, was limited to the leading edge of the abnormal white matter. In addition to outlining the inflam-matory leading edge of the demyelinating process in cases of X-linked ALD, we have found that con-trast enhancement may be useful in predicting the natural history of the disease.
Among the patients whose initial T1-weighted spin-echo MR images showed contrast enhance-ment, only one had no evidence of progression re-vealed by MR imaging (Loes) and neurologic scores. For that patient, there was faint edge en-hancement outlining the region of demyelination, which did not persist on the follow-up enhanced T1-weighted spin-echo MR images (Fig 3). Persis-tent enhancement was shown on the follow-up MR images of another patient, with evidence of disease progression revealed by T2-weighted MR imaging without commensurate clinical deterioration. This can be due to disease progression into the so-called non-eloquent regions of the brain, which would not be revealed by neurologic evaluation. Detailed neu-ropsychological testing of patients with X-linked ALD may elicit subtle deterioration in brain func-tion that would otherwise not be detected by neu-rologic testing and may better correlate with MR imaging findings (unpublished data). Persistent en-hancement was shown on the follow-up MR im-ages of a third patient, with clinical deterioration and no evidence of disease progression revealed by T2-weighted MR imaging. This can be attributed to limitations of the visual scoring method used or to eloquent brain involvement that is below the res-olution (contrast and spatial) of the MR imaging protocol used. The latter explanation is supported by the MR spectroscopy data obtained from pa-tients with X-linked ALD that showed elevation in the choline-to-total creatine ratio in regions of nor-mal-appearing white matter on anatomic MR im-ages (16–18).
The potential limitations of this study are in part related to its retrospective nature. The lack of uni-formity in the quality of the MR images and the duration of follow-up evaluation restricted clinical data to those that were available in the patients’ charts. In addition, sampling bias due to socioeco-nomic, geographic, racial, and disease severity fac-tors undoubtedly influenced our results.
Differences in MR imagers and imaging pulse parameters may have influenced the results of the visual scoring method because of differences in MR imaging contrast and spatial resolution. Also, that a significant proportion of the MR imaging ex-aminations were available only in hard copy format precluded the implementation of possibly more re-liable, semiautomated, computer-based methods for disease quantification.
The number and duration of follow-up evalua-tions were greater for the group of patients with unenhanced initial T1-weighted images. This is be-cause the conditions of nearly all of the patients with enhanced initial images deteriorated clinically, and the patients were referred for bone marrow transplantation and other aggressive experimental therapies. Despite the longer follow-up, only three patients with unenhanced images had disease pro-gression revealed by MR imaging and clinical evaluation.
Conclusion
A reliable marker that can be predictive of the natural history of X-linked ALD is critical for the appropriate management of affected patients. We have shown a very strong association between the presence of contrast enhancement on the T1-weighted MR images and disease progression re-vealed by clinical evaluation and MR imaging.
References
1. Igarashi M, Schaumburg HH, Powers J, et al. Fatty acid abnor-mality in adrenoleukodystrophy. J Neurochem 1976;26:851–860 2. Singh I, Moser AB, Goldfischer S, et al. Lignoceric acid is oxi-dized in the peroxisomes: implications for the Zellweger cer-ebro-hepato-renal syndrome and adrenoleuko-dystrophy. Proc Natl Acad Sci U S A 1984;81:4203–4207
3. Laxo O, Contreras M, Hashmi M, et al. Peroxisomal lignoceroyl-CoA ligase deficiency in childhood adrenoleukodystrohy and adrenomyeloneuropathy. Proc Natl Acad Sci U S A 1988;85: 7647–7651
4. Migeon BR, Moser HW, Moser AB, et al. Adrneoleukodystro-phy: evidence for X-linkage, inactivation and selection favor-ing the mutant allele in heterozygous cells. Proc Natl Acad Sci U S A 1981; 78:5066–5070
5. Bezman L, Moser HW. The incidence of X-linked adrenoleu-kodystrophy and the relative frequency of its phenotypes. Am J Med Genet 1998;76:415–419
6. Moser HW. Adrenoleukodystrophy: phenotype, genetics, pathogenesis and therapy. Brain 1997;120:1485–1508 7. Smith KD, Kemp S, Braiterman LT, et al. X-linked
adrenoleu-kodystrophy: genes, mutations, and phenotypes. Neurochem Res 1999;24:511–525
AJNR: 21, May 2000 844 MELHEM
9. Wanders RJA, van Roermund CWT, Lageweg W, et al. X-linked adrenoleuko-dystrophy: biochemical diagnosis and enzyme de-fect. J Inherit Metab Dis 1992;15:634–644
10. Schaumburg HH, Powers JM, Raine CS, et al. Adrenoleukodys-trophy: a clinical and pathological study of 17 cases. Arch Neu-rol 1975;33:577–591
11. Powers J, Liu Y, Moser AB, et al. The inflammatory myelino-pathy of adrenoleuko-dystrophy: cells, effector molecules, and pathogenetic implications. J Neuropathol Exp Neurol 1992;51: 630–643
12. Melhem ER, Breiter SN, Ulug AM, Raymond GV, Moser HW. Improved tissue characterization in adrenoleukodystrophy us-ing magnetization transfer imagus-ing. AJR Am J Roentgenol 1996; 166:689–695
13. Loes DJ, Hite S, Moser HW, et al. Adrenoleukodystrophy: a scoring method for brain MR observation. AJNR Am J Neu-roradiol 1994;15:1761–1766
14. Krivit W, Lockman LA, Watkins PA, et al. The future for treat-ment by bone marrow transplantation for adrenoleukodystro-phy, metachromatic leukodystroadrenoleukodystro-phy, globid cell leukodystrophy and Hurler syndrome. J Inherit Metab Dis 1995;18:398–412 15. Powers JM. The pathology of peroxisomal disorders with
path-ogenetic considerations. J Neuropathol Exp Neurol 1994;54: 710–719
16. Tzika AA, Ball WS Jr, Vigneron DB, et al. Childhood adreno-leukodystrophy: assessment with proton MR spectroscopy. Ra-diology 1993;189:467–480
17. Kruse B, Barker PB, van Zijl PCM, et al. Multislice proton MR spectroscopic imaging in X-linked adrenoleukodystrophy. Ann Neurol 1994;36:595–608