Glioma Grading: Sensitivity, Specificity, and
Predictive Values of Perfusion MR Imaging and
Proton MR Spectroscopic Imaging Compared
with Conventional MR Imaging
Meng Law, Stanley Yang, Hao Wang, James S. Babb, Glyn Johnson, Soonmee Cha, Edmond A. Knopp, and David Zagzag
BACKGROUND AND PURPOSE:Sensitivity, positive predictive value (PPV), and negative predictive value (NPV) of conventional MR imaging in predicting glioma grade are not high. Relative cerebral blood volume (rCBV) measurements derived from perfusion MR imaging and metabolite ratios from proton MR spectroscopy are useful in predicting glioma grade. We evaluated the sensitivity, specificity, PPV, and NPV of perfusion MR imaging and MR spec-troscopy compared with conventional MR imaging in grading primary gliomas.
METHODS:One hundred sixty patients with a primary cerebral glioma underwent conven-tional MR imaging, dynamic contrast-enhanced T2*-weighted perfusion MR imaging, and proton MR spectroscopy. Gliomas were graded as low or high based on conventional MR imaging findings. The rCBV measurements were obtained from regions of maximum perfusion. Metabolite ratios (choline [Cho]/creatine [Cr], Cho/N-acetylaspartate [NAA], and NAA/Cr) were measured at a TE of 144 ms. Tumor grade determined with the three methods was then compared with that from histopathologic grading. Logistic regression and receiver operating characteristic analyses were performed to determine optimum thresholds for tumor grading. Sensitivity, specificity, PPV, and NPV for identifying high-grade gliomas were also calculated. RESULTS:Sensitivity, specificity, PPV, and NPV for determining a high-grade glioma with conventional MR imaging were 72.5%, 65.0%, 86.1%, and 44.1%, respectively. Statistical anal-ysis demonstrated a threshold value of 1.75 for rCBV to provide sensitivity, specificity, PPV, and NPV of 95.0%, 57.5%, 87.0%, and 79.3%, respectively. Threshold values of 1.08 and 1.56 for Cho/Cr and 0.75 and 1.60 for Cho/NAA provided the minimum C2 and C1 errors, respectively, for determining a high-grade glioma. The combination of rCBV, Cho/Cr, and Cho/NAA resulted in sensitivity, specificity, PPV, and NPV of 93.3%, 60.0%, 87.5%, and 75.0%, respectively. Significant differences were noted in the rCBV and Cho/Cr, Cho/NAA, and NAA/Cr ratios between low- and high-grade gliomas (P < .0001, .0121, .001, and .0038, respectively).
CONCLUSION:The rCBV measurements and metabolite ratios both individually and in com-bination can increase the sensitivity and PPV when compared with conventional MR imaging alone in determining glioma grade. The rCBV measurements had the most superior diagnostic perfor-mance (either with or without metabolite ratios) in predicting glioma grade. Threshold values can be used in a clinical setting to evaluate tumors preoperatively for histologic grade and provide a means for guiding treatment and predicting postoperative patient outcome.
Prospective grading of primary cerebral gliomas is an
endeavor with many difficulties but with significant clinical benefit. Despite recent advances in technol-ogy, chemotherapeutic agents, radiation therapy op-tions, and surgical techniques, few inroads have been made into improving the survival of patients with malignant gliomas. The mean survival rate remains dismal, with fewer than 10% of patients with
glioblas-Received January 22, 2003; accepted after revision June 11. Supported by a research grant from the Royal Australian and New Zealand College of Radiologists, Grant RO1CA092992 from the NCI/National Institute of Health.
From the Departments of Radiology (M.L., S.Y., J.S.B., G.J., E.A.K.), Neurosurgery (E.A.K.), and Pathology (D.Z.), New York University Medical Center, NY; the Department of Biostatistics, Fox Chase Cancer Center, Philadelphia, PA (H.W., J.S.B.); and the Department of Radiology, University of California at San Fran-cisco Medical Center, San FranFran-cisco, CA (S.C.).
Address reprint requests to Meng Law, MD, Department of Radiology, NYU Medical Center, MR Imaging Dept, Schwartz Bldg, Basement HCC, 530 First Ave, New York, NY 10016.
©American Society of Neuroradiology
toma multiforme alive after 2 years. Two major lim-itations are associated with histopathologic grading of gliomas: inherent sampling error associated with stereo-tactic biopsy and inability to evaluate residual tumor tissue after cytoreductive surgery. Malignant gliomas are known to infiltrate the parenchyma following vascu-lar channels of the white matter tracts (1). This may not be readily appreciated if there is no signal intensity abnormality or enhancement on conventional MR im-ages. Hence, histopathologic grading of gliomas has disadvantages and intrinsic error. The advantage of state-of-the-art MR imaging techniques in evaluating cerebral gliomas is the ability to sample not only the entire lesion, but also the adjacent brain tissue for phys-iologic and metabolite alterations.
Conventional MR imaging with gadolinium-based contrast agents is an established and useful tool in the characterization of cerebral tumors (2–6). Current 1.5-T clinical MR systems provide excellent anatomic or morphologic imaging of gliomas. However, despite optimization of sequences and protocols, the classifi-cation and grading of gliomas with conventional MR imaging is sometimes unreliable, with the sensitivity for glioma grading ranging from 55.1% to 83.3% (7–11). Kondziolka et al (10) demonstrated a 50% false-positive rate in evaluating supratentorial glio-mas.
Conventional MR imaging provides important in-formation regarding contrast material enhancement, perienhancement edema, distant tumor foci, hemor-rhage, necrosis, mass effect, and so on, which are all helpful in characterizing tumor aggressiveness and hence tumor grade. Dean et al (8) determined that mass effect and necrosis were the two most important predictors of tumor grade. However, often a high-grade glioma may be mistaken for a low-high-grade glioma when it demonstrates minimal edema, no contrast material enhancement, no necrosis, and no mass ef-fect (Fig 1A and B). Conversely, low-grade gliomas can sometimes demonstrate peritumoral edema, con-trast material enhancement, central necrosis, and mass effect and be mistaken for a high-grade glioma (Fig 2A and B). Conventional MR imaging readily provides evidence of contrast material enhancement, signifying blood-brain barrier breakdown, which is often associated with higher tumor grade. However, contrast material enhancement alone is not always ac-curate in predicting tumor grade. Ginsberg et al (12) demonstrated that lack of enhancement of supratento-rial gliomas does not equate with low-grade gliomas. In another study, all low-grade tumors showed contrast material enhancement, but almost one-fifth of glioblas-toma multiforme tumors did not (11). The peritumoral hyperintensity on conventional T2-weighted MR images
FIG 1. 20-year-old woman with
biop-sy-proved high-grade glioma.
A, Contrast-enhanced axial T1-weighted image (600/14/1 [TR/TE/NEX]) demonstrates an ill-defined nonenhanc-ing mass (arrow) in the right frontal re-gion. The lack of enhancement on the conventional MR image suggests a low-grade glioma.
B, Axial T2-weighted image (3400/ 119/1) shows increased signal intensity in the mass, with minimal peritumoral edema. This mass was graded as a low-grade glioma with conventional MR im-aging because of lack of enhancement, minimal edema, no necrosis, and no mass effect.
C, Gradient-echo (1000/54) axial per-fusion MR image with rCBV color overlay map shows increased perfusion with a high rCBV of 7.72, in keeping with a high-grade glioma.
is nonspecific, representing tumor infiltration, vasogenic edema, or both. Moreover, conventional MR imaging does not provide reliable information on tumor physi-ology such as microvascularity, angiogenesis, metabo-lism, micronecrosis, or cellularity, all of which are also important in determining tumor grade (13–15).
Advanced MR imaging techniques such as perfu-sion MR imaging and proton MR spectroscopy have found increasing utility in studying brain tumors. Rel-ative cerebral blood volume (rCBV) maps and mea-surements have been shown to correlate reliably with tumor grade and histologic findings of increased tu-mor vascularity (11, 16–25). Recent reports regarding MR spectroscopy support its use as a powerful tool in tumor grading as well. Specifically, elevation in cho-line (Cho) with depression of N-acetylaspartate (NAA) is a reliable indicator of tumor. There is ex-tensive literature demonstrating the metabolite ratios of Cho/creatine (Cr), NAA/Cr, and myo-inositol/Cr and the presence of lipids and lactate to be useful in grading tumors and predicting tumor malignancy (7, 26–56). There is certainly compelling evidence that MR spectroscopy provides important supplemental information to that of conventional MR imaging. The recent finding of a direct correlation between Cho and Ki-67 levels or cellular proliferative activity
pro-vides objective confirmation of the potential of MR spectroscopy in predicting tumor grade (57, 58).
To date, there have been some efforts to combine perfusion MR imaging and MR spectroscopic tech-niques in characterizing gliomas (59, 60). Investiga-tors have also combined these two techniques to eval-uate postoperative patients (61) or pediatric patients
FIG 3. ROC curves for rCBV plus metabolites, rCBV alone, Cho/Cr, and Cho/NAA demonstrate superior sensitivity and specificity of rCBV plus metabolites and rCBV alone compared with conventional MR imaging (cMRI, green asterisk) for glioma grading.
FIG 2. 43-year-old man with
biopsy-proved low-grade glioma.
A, Contrast-enhanced axial T1-weighted image (600/14/1) demonstrates a peripherally enhancing mass (arrow) in the right frontal region. The presence of contrast material enhancement on the conventional MR image would suggest a high-grade glioma.
B, Axial T2-weighted image (3400/ 119/1) shows marked peritumoral edema with possible necrosis and blood prod-ucts. This mass was graded as a high-grade glioma with conventional MR imag-ing because of the contrast material enhancement, heterogeneity, blood prod-ucts, possible necrosis, and degree of edema.
C, Gradient-echo (1000/54) axial per-fusion MR image with rCBV color overlay map shows a low rCBV of 1.70, in keep-ing with a low-grade glioma.
with brain tumors (62). Importantly, despite the nu-merous reports and widespread interest in the char-acterization of gliomas with these advanced MR im-aging techniques, the current clinical role of rCBV and metabolite ratios requires further determination (63). There are surprisingly few reports in the litera-ture describing the false-positive and false-negative rates for glioma grading by using rCBV, metabolite ratios, or both, compared with that for conventional MR imaging. Defining the role of these advanced MR imaging techniques in clinical practice, in terms of the sensitivity, specificity, positive predictive value (PPV), and negative predictive value (NPV), and determin-ing whether perfusion MR imagdetermin-ing, MR spectros-copy, or the combination of the two techniques is more superior need further investigation.
We evaluated our experience in applying both of these advanced techniques in the study of primary cerebral gliomas and compared the sensitivity, speci-ficity, PPV, and NPV of perfusion MR imaging and MR spectroscopy in glioma grading with those of conventional MR imaging. Our purpose was to pro-vide objective data on the clinical utility of perfusion MR imaging and MR spectroscopy in glioma grading and also to proffer some quantitative guidelines for distinguishing low-grade from high-grade gliomas.
Methods
Patients and Histopathologic Analysis
Approval for this study was obtained from the Institutional Board of Research Associates, and informed consent was ob-tained from all patients. Retrospective analysis of our database of 728 patients who underwent conventional, perfusion, and spectroscopic MR imaging yielded 160 patients who underwent preoperative MR examinations and had histopathologic results for comparison. The conventional MR imaging examinations evaluated were all preoperative. One hundred seventeen pa-tients received their perfusion and spectroscopic imaging be-fore surgery and 43 patients after stereotactic biopsy or partial resection, but the postoperative images demonstrated residual contrast material enhancement. The MR examinations were acquired from November 1999 to July 2002. The patients’ ages ranged from 4 to 82 years, with a mean of 43 years. There were 108 male and 52 female patients.
Histopathologic evaluation was performed by an experi-enced neuropathologist (D.Z.) and was based on a modified Ringertz’s three-tier classification of gliomas (64): grade 1, low-grade glioma; grade 2, anaplastic glioma; and grade 3, glioblastoma multiforme. The imaging classification was di-vided into two tiers. Anaplastic gliomas and glioblastoma mul-tiforme were considered high-grade gliomas, and this group comprised 120 patients. The low-grade gliomas group com-prised 40 patients.
Conventional MR Imaging
Imaging was performed with a 1.5-T unit (Vision or Sym-phony; Siemens AG, Erlangen, Germany). A localizing sagittal T1-weighted image was obtained followed by nonenhanced axial T1-weighted (600/14 [TR/TE]), axial fluid-attenuated in-version-recovery (FLAIR, 9000/110/2500 [TR/TE/TI]), and T2-weighted (3400/119) images. Contrast material–enhanced axial T1-weighted imaging was performed after the acquisition of the perfusion MR imaging data. Two experienced board-certi-fied neuroradiologists (S.Y., E.K.), blinded to the perfusion and MR spectroscopic results, reviewed the conventional MR
images and graded each tumor according to the two-tier imag-ing gradimag-ing system: low- versus high-grade gliomas. A consen-sus was reached on the conventional grading of each lesion based on eight criteria: contrast material enhancement, border definition, mass effect, signal intensity heterogeneity, hemor-rhage, necrosis, degree of edema, and involvement of the cor-pus callosum or crossing the midline (8, 9).
Dynamic Contrast-Enhanced Perfusion MR Imaging Dynamic contrast agent–enhanced T2*-weighted gradient-echo gradient-echo-planar images were acquired during the first pass of a standard dose (0.1 mmol/kg) bolus of gadopentetate dime-glumine (Magnevist; Berlex Laboratories, Wayne, NJ). Seven to 10 sections were selected for perfusion MR imaging through the tumor based on T2-weighted and FLAIR images. The methods for acquiring perfusion data from a set of dynamic contrast-enhanced echo-planar images and the precise algo-rithm for calculating rCBV have been previously described (11). Data processing was performed by using a Unix worksta-tion with analytic programs developed in-house by using C and IDL programming languages. After construction of an rCBV color map to target regions of maximal abnormality, four re-gion-of-interest measurements were obtained, and the maxi-mum rCBV was recorded. This method has been demonstrated to provide the most optimal interobserver and intraobserver reproducibility (65). The standardized region of interest, which measured approximately 2–3 mm2, was used in most measure-ments. The rCBV measurements were obtained by a neurora-diologist (G.I.) experienced with perfusion data acquisition at our institution, once again blinded to the conventional and MR spectroscopic findings.
Proton MR Spectroscopic Imaging
Statistical Analysis
Sensitivity, specificity, PPV, and NPV were calculated for correct identification of high-grade gliomas. Hence, tumors classified as high grade and found at histologic examination to be high grade were considered true-positive findings; low-grade gliomas that were histologically confirmed as low grade were considered true-negative findings. For rCBV and metabolite ratios, receiver operating characteristic (ROC) curve analyses were used to evaluate the performance of simple diagnostic tests that declared a glioma to be high grade if and only if the relevant measure (eg, rCBV) for that patient was greater than or equal to some valueK.This permitted a determination of the sensitivity, specificity, PPV, NPV, and total error associated with each measure as a function of the thresholdK,used to identify high-grade gliomas. To determine potentially useful threshold values for rCBV, Cho/Cr, and Cho/NAA in differen-tiating low- from high-grade gliomas, threshold values were found that 1) minimized the observed number of tumor grade misclassifications (C2 error⫽fraction of misclassified tumors) and 2) maximized the average of the observed sensitivity and specificity (C1 error). Hence, C1⫽1 - (sensitivity⫹ specific-ity)/2. The Mann-Whitney test was used to compare histologi-cally verified low- and high-grade gliomas in terms of rCBV, Cho/Cr, Cho/NAA, and NAA/Cr. APvalue less than .05 was considered to indicate a statistically significant difference.
Results
The sensitivity, specificity, PPV, and NPV for de-termination of a high-grade glioma with conventional MR imaging were 72.5%, 65.0%, 86.1%, and 44.1%, respectively. For a minimum C2 error, a threshold value of 1.75 for rCBV provided sensitivity, specific-ity, PPV, and NPV of 95.0%, 57.5%, 87.0%, and 79.3%, respectively. For a minimum C1 error, a threshold value of 2.97 for rCBV provided sensitivity, specificity, PPV, and NPV of 72.5%, 87.5%, 94.6%, and 51.5%, respectively (Table 1). A threshold value of 2.97 provided the same sensitivity as that of con-ventional MR imaging but higher specificity and PPV. A threshold value of 2.18 provided the same specific-ity as that of conventional MR imaging but higher sensitivity, PPV, and NPV (Table 1).
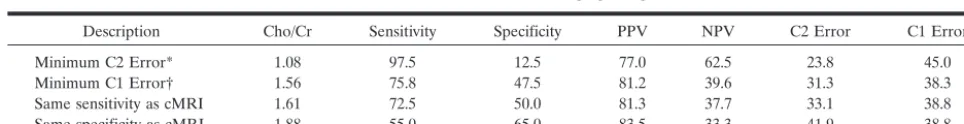
A threshold value of 1.08 for Cho/Cr provided the minimum C2 error and 97.5%, 12.5%, 77.0%, and 62.5% for the sensitivity, specificity, PPV, and NPV for determination of a high-grade glioma. A threshold value of 1.56 provided the minimum C1 value and 75.8%, 47.5%, 81.2%, and 39.6% for the sensitivity, specificity, PPV, and NPV for determination of a high-grade glioma. Threshold values that provided the same sensitivity and specificity as those of con-ventional MR imaging were 1.61 and 1.88, respec-tively (Table 2).
A threshold value of 0.75 for Cho/NAA provided minimum C2 error and 96.7%, 10.0%, 76.3%, and 50.0% for the sensitivity, specificity, PPV, and NPV for determination of a high-grade glioma. A threshold value of 1.6 for Cho/NAA provided minimum C1 error and 74.2%, 62.5%, 85.6%, and 44.6% for the sensitivity, specificity, PPV, and NPV for determina-tion of a high-grade glioma. Threshold values that provided the same sensitivity and specificity as those of conventional MR imaging were 1.66 and 1.78, respectively (Table 3).
The combination of rCBV, Cho/Cr, and Cho/NAA resulted in sensitivity, specificity, PPV, and NPV of 93.3%, 60.0%, 87.5%, and 75%, respectively, for min-imum C2 error, and 70.8%, 92.5%, 96.6%, and 51.4%, respectively, for minimum C1 error. For the same sensitivity as that of conventional MR imaging (72.5%), the specificity and PPV were higher, and for the same specificity as that of conventional MR im-aging (65.0%), the sensitivity, PPV, and NPV were higher than those of conventional MR imaging alone when using the combination of rCBV, Cho/Cr, and Cho/NAA (Table 4, Fig 3).
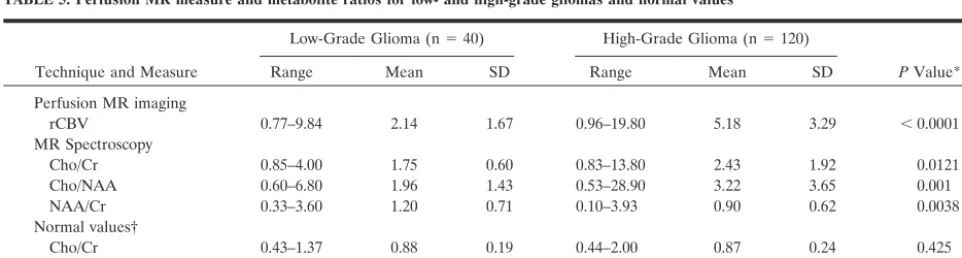
[image:5.603.54.533.72.133.2]The mean, standard deviation, and ranges for rCBV, Cho/Cr, Cho/NAA, and NAA/Cr are shown in Table 5. A statistically significant difference was noted in the rCBV, Cho/Cr, Cho/NAA, and NAA/Cr between low- and high-grade gliomas (P ⬍ .0001,
TABLE 1: Threshold values for rCBV for differentiation between low- and high-grade gliomas
Description rCBV Sensitivity Specificity PPV NPV C2 Error C1 Error Minimum C2 Error* 1.75 95.0 57.5 87.0 79.3 14.4 23.8 Minimum C1 Error† 2.97 72.5 87.5 94.6 51.5 23.8 20.0 Same sensitivity as cMRI 2.97 72.5 87.5 94.6 51.5 23.8 20.0 Same specificity as cMRI 2.18 87.5 65.0 88.2 63.4 18.1 23.0
Note.—Conventional MR imaging (cMRI) sensitivity 72.5%, specificity 65.0%, PPV 86.1%, NPV 44.1%, C2 error 29.4%, and C1 error 31.8%. * C2⫽the percentage of observed data points misclassified.
[image:5.603.52.534.191.253.2]† C1⫽1⫺(sensitivity⫹specificity)/2. This maximizes the average of sensitivity and specificity.
TABLE 2: Threshold values for Cho/Cr ratio for differentiation between low- and high-grade gliomas
Description Cho/Cr Sensitivity Specificity PPV NPV C2 Error C1 Error Minimum C2 Error* 1.08 97.5 12.5 77.0 62.5 23.8 45.0 Minimum C1 Error† 1.56 75.8 47.5 81.2 39.6 31.3 38.3 Same sensitivity as cMRI 1.61 72.5 50.0 81.3 37.7 33.1 38.8 Same specificity as cMRI 1.88 55.0 65.0 83.5 33.3 41.9 38.8
Note.—Conventional MR imaging (cMRI) sensitivity 72.5%, specificity 65.0%, PPV 86.1%, NPV 44.1%, C2 error 29.4%, and C1 error 31.8%. * C2⫽the percentage of observed data points misclassified.
.0121, .001, and .0038, respectively) (Table 5). Within the high-grade glioma group, there were 73 anaplastic gliomas (anaplastic astrocytomas, n⫽ 26; anaplastic oligodendrogliomas, n⫽7; anaplastic mixed oligoas-trocytomas, n⫽40) and 47 glioblastoma multiforme. No statistically significant difference was noted in the rCBV, Cho/Cr, Cho/NAA, and Cho/Cr ratios be-tween the anaplastic gliomas and glioblastoma multi-forme groups (P⫽.549, .302, .363, and .915, respec-tively).
Discussion
Current methods of grading gliomas have inherent limitations. The current reference standard of his-topathologic grading can be inaccurate when biopsy samples are not taken from the most malignant tumor region or when the tumor is not completely resected. This is a particular problem with glioma because of the infiltrative proliferation of the tumor. Although histopathologic grading is often performed on the enhancing portion of the tumor, vascular networks in the peritumoral region serve as a path for tumoral
infiltration along perivascular spaces. The region of highest vascularity and malignancy may then be within the so-called peritumoral or perienhancing re-gion (22).
Radiologic grading of tumors with conventional MR imaging is not always accurate, with sensitivity in identifying high-grade gliomas ranging from 55.1% to 83.3% in other studies (7, 8, 11) and 72.5% in this study. Yet, accurate tumor grading has important implications for treatment planning: Patients with an erroneous diagnosis of high-grade glioma will un-dergo unnecessary adjuvant therapy; patients with an erroneous diagnosis of low-grade glioma will be treated conservatively, with concomitant morbidity and mortality.
Results of several previous studies suggest that rCBV measurements may improve grading. Sugahara et al (18) correlated maximal rCBV values histologi-cally and angiographihistologi-cally in 30 patients, with mean values of 7.32, 5.84, and 1.26 for glioblastomas, ana-plastic astrocytomas, and low-grade gliomas, respec-tively. Aronen et al (16) found mean maximal rCBV values of 3.64 and 1.11 in high- and low-grade
glio-TABLE 3: Threshold values for Cho/NAA ratio for differentiation between low- and high-grade gliomas
Description Cho/NAA Sensitivity Specificity PPV NPV C2 Error C1 Error Minimum C2 Error* 0.75 96.7 10.0 76.3 50.0 25.0 46.7 Minimum C1 Error† 1.60 74.2 62.5 85.6 44.6 28.8 31.7 Same sensitivity as cMRI 1.66 72.5 62.5 85.3 43.1 30.0 32.5 Same specificity as cMRI 1.78 67.5 65.0 85.3 40.0 33.1 33.8
Note.—Conventional MR imaging (cMRI) sensitivity 72.5%, specificity 65.0%, PPV 86.1%, NPV 44.1%, C2 error 29.4%, and C1 error 31.8%. * C2⫽the percentage of observed data points misclassified.
[image:6.603.54.537.71.133.2]† C1⫽1⫺(sensitivity⫹specificity)/2. This maximizes the average of sensitivity and specificity.
TABLE 4: rCBV, Cho/Cr ratio, and Cho/NAA ratio together for differentiation between low- and high-grade glioma
Description Sensitivity Specificity PPV NPV C2 Error C1 Error Minimum C2 Error* 93.3 60.0 87.5 75.0 15.0 23.3 Minimum C1 Error† 70.8 92.5 96.6 51.4 23.7 18.3 Same sensitivity as cMRI 72.5 87.5 94.6 51.5 23.8 20.0 Same specificity as cMRI 89.2 65.0 88.4 66.7 16.9 22.9
Note.—Conventional MR imaging (cMRI) sensitivity 72.5%, specificity 65.0%, PPV 86.1%, NPV 44.1%, C2 error 29.4%, and C1 error 31.8%. * C2⫽the percentage of observed data points misclassified.
† C1⫽1⫺(sensitivity⫹specificity)/2. This maximizes the average of sensitivity and specificity.
TABLE 5: Perfusion MR measure and metabolite ratios for low- and high-grade gliomas and normal values
Technique and Measure
Low-Grade Glioma (n⫽40) High-Grade Glioma (n⫽120)
PValue* Range Mean SD Range Mean SD
Perfusion MR imaging
rCBV 0.77–9.84 2.14 1.67 0.96–19.80 5.18 3.29 ⬍0.0001 MR Spectroscopy
Cho/Cr 0.85–4.00 1.75 0.60 0.83–13.80 2.43 1.92 0.0121 Cho/NAA 0.60–6.80 1.96 1.43 0.53–28.90 3.22 3.65 0.001 NAA/Cr 0.33–3.60 1.20 0.71 0.10–3.93 0.90 0.62 0.0038 Normal values†
Cho/Cr 0.43–1.37 0.88 0.19 0.44–2.00 0.87 0.24 0.425 NAA/Cr 1.11–2.89 1.72 0.41 0.45–4.74 1.73 0.51 0.958
* Mann-Whitney test.
[image:6.603.52.533.191.254.2] [image:6.603.54.535.312.441.2]mas, respectively (n ⫽ 19). Knopp et al (11) had similar mean maximal rCBV values of 5.07 and 1.44 in high- and low-grade gliomas, respectively (n⫽29). These values are comparable to our findings, with mean maximal rCBV values of 5.18 and 2.14 for high-and low-grade gliomas, respectively (Table 5, n ⫽ 160). Lev and Rosen (23) used an rCBV threshold value of 1.5 in discriminating among 32 consecutive patients with glioma. Thirteen (100%) of 13 astrocy-tomas were correctly categorized as high-grade glio-mas. Three of these did not enhance after adminis-tration of contrast material. Of the nine low-grade astrocytomas, seven were correctly classified. The sensitivity and specificity with use of an rCBV of 1.5 as a threshold value were 100% and 69%, respec-tively. This compares with the results from this study of 95.0% and 57.5% sensitivity and specificity, respec-tively, by using 1.75 as the threshold value. More recently, Shin et al (24) demonstrated mean rCBV ratios of 4.91 in high-grade gliomas and 2.00 in low-grade gliomas, in 17 patients; these ratios were similar to the ratios in this study of 5.18 and 2.14 in high- and low-grade gliomas, respectively. The threshold or cut-off value of 2.93 with use of ROC curve analysis is comparable to our value of 2.97 minimizing for C1 error (Table 1).
Besides vascular proliferation, cellularity, mitotic activity, nuclear pleomorphism, and necrosis are im-portant criteria in histopathologic grading of gliomas. Ki-67 labeling is used in histologic examination as a marker for cellular proliferation. A higher rate of Ki-67–positive cells corresponds to greater malig-nancy in gliomas. Metabolite ratios, in particular Cho levels, have correlated with Ki-67 levels in gliomas (58). MR spectroscopic measurements of Cho/Cr and Cho/NAA ratios should therefore be helpful in the grading of gliomas.
However, to date, there have been few systematic attempts to compare the sensitivity, specificity, PPV, and NPV of perfusion MR imaging and MR spectros-copy with those of conventional MR imaging in gli-oma grading. To make a comparison, we determined threshold values from logistic regression and ROC analyses. However, it is not always clear what criteria should be used in determining an “optimum” thresh-old. For example, one could choose to minimize C1 error, which minimizes the average of the false-posi-tive and false-negafalse-posi-tive error rates. This would be appropriate if the consequence of misclassifying low-grade gliomas is the same as that of misclassifying high-grade gliomas and the two are equally likely to be presented to you for classification. Alternatively, one could choose to minimize the C2 error, the total number of misclassified tumors observed in the data. This adjusts for a difference in the relative frequency of low- and high-grade gliomas in the patient popu-lation. In particular, if high-grade gliomas are much more prevalent, then a high misclassification rate of high-grade gliomas would result in a high total num-ber of misclassified gliomas. In the real world, high-grade gliomas are more common than low-high-grade gli-omas. Hence, choosing the threshold to minimize C2
error will tend to yield high sensitivity and relatively low specificity. These are the reasons for presenting two sets of results with threshold values for rCBV and metabolite ratios that minimize both C1 and C2 error values. For application in clinical practice, however, a threshold that minimizes C2 error is most appropriate (Tables 1–3).
The sensitivity of rCBV in glioma grading in our study was 95.0% (minimizing for C2 error), indicating a high true-positive rate and low false-negative rate. Hence, if the rCBV is above 1.75, there is a high probability that the tumor will be a high-grade gli-oma. Conversely, when rCBV is below 1.75, the tu-mor is unlikely to be high-grade glioma. However, the relatively low specificity means that false-positive rates are relatively high and true-negative rates are correspondingly low. In other words, some low-grade gliomas will be falsely identified as high-grade glio-mas. However, this is the lesser of two evils. First, low-grade gliomas are relatively less common than high-grade gliomas, so fewer errors will be made in absolute terms. Second, a low-grade glioma misiden-tified as a high-grade glioma will be treated aggres-sively with some increase in morbidity. However, a high-grade glioma misidentified as a low-grade gli-oma will be treated conservatively, resulting in poten-tial rapid death.
The high NPV (79.3%) is likewise a significant finding, as gliomas with low rCBV (⬍1.75) are un-likely to have high-grade components. Hence, it is an excellent tool for excluding the presence of a high-grade glioma (23), an issue that often confronts the neuroradiologist and neuropathologist. The low total error when using rCBV alone suggests that rCBV in itself is an accurate predictor of tumor grade, with a 14.4% chance of error when using 1.75 as the arbi-trary threshold value. When one chooses threshold values that demonstrate the same sensitivity as that of conventional MR imaging (72.5%), the specificity, PPV, and NPV are superior to those of conventional MR imaging. Similarly, when one chooses threshold values that demonstrate the same specificity as that of conventional MR imaging (65.0%), the sensitivity, PPV, and NPV are superior to those of conventional MR imaging (Table 1).
The sensitivities (minimized for C2 error) of Cho/Cr and Cho/NAA of 97.5 and 96.7%, respec-tively, in this study confirm that metabolite ratios can be useful in determining tumor grade. However, the low specificities (12.5% for Cho/Cr and 10.0% for Cho/NAA) are due to the high levels for Cho that we, and others, have observed in some low-grade gliomas. Again, however, high sensitivity in identifying high-grade gliomas is more important than high specificity because of the relatively fewer cases of low-grade glioma and the more serious consequences of false-negative findings.
account differences in MR spectroscopic technique such as the choice of TE and method for determina-tion of metabolite ratios, demonstrates that the mean maximal values obtained for Cho/Cr and Cho/NAA and mean minimum values for NAA/Cr (Table 5) in our study are comparable to previously published data in differentiating between low- and high-grade gliomas (7, 31, 45, 49, 59). Other data in the literature present metabolite levels and direct metabolite con-centrations in a slightly different manner than pre-sented in the current study, but they clearly also show differences in Cho levels between low- and high-grade gliomas (35, 54). In the current study, we had a number of reasons for using Cho/Cr and Cho/NAA ratios for assessing tumor grade. First, histopatholo-gically, the linear correlation of Cho with Ki-67 label-ing index or cellular proliferative activity suggests that Cho may be a strong predictor of tumor grade (57, 58). Second, although it may be possible to provide better discrimination combining other metabolites such as alanine, lipids, lactate, myo-inositol, glu-tamine, and glutamate, it is often not possible to perform MR spectroscopy at multiple TEs in a clini-cal setting to provide metabolites such as myo-inosi-tol, glutamine, and glutamate detectable best at short TE. Third, to analyze multiple metabolites, linear discriminant analysis (50) or automated spectral anal-ysis software (69) is usually necessary but not com-mercially available as yet.
One of the challenges in spectroscopy, even with current automated techniques, is obtaining reliable and reproducible intrapatient and interpatient data. To ensure quality control in the data, measurements of normal Cho/Cr and NAA/Cr levels were also ob-tained in the contralateral unaffected white matter as part of the MR spectroscopy multivoxel, 2D CSI mea-surement. Despite possible regional variations in me-tabolite ratios within the brain, it was reassuring to find that normal values for Cho/Cr and Cho/NAA obtained in the low- and high-grade glioma groups were almost identical. Normal Cho/Cr and NAA/Cr levels were 0.88 and 1.72 for low-grade gliomas and 0.87 and 1.73 for high-grade gliomas (Table 5). This not only provides a means for ensuring that the MR spectroscopic data are reliable, but also allows for further comparison between the abnormal data and normative data. In this study, the comparison was made only between low- and high-grade gliomas; however, a comparison between metabolite ratios within the tumor and normal voxels in the same pa-tient is shown in Table 5.
The role of necrosis in glioma grading is important (70). The presence of necrosis is one important dis-tinction between anaplastic astrocytomas and glio-blastoma multiforme. In our series, lipid and lactate were found in 5.0% of low-grade gliomas and in 16.6% of high-grade gliomas. There is certainly a difference in finding lipids and lactate between the two groups, and although formal quantification and analyses were not performed in this study, lipids and lactate do correlate with necrosis in high-grade gli-oma and may also be useful in differentiating gligli-oma
grades (27, 45, 71). The frequency of elevated lipid and lactate in the high-grade glioma group was rela-tively low compared with that of previous studies (45, 71). This may be explained by the population bias in the sample of 73 anaplastic gliomas versus 47 glio-blastomas. Furthermore, as this study did not focus on lipids and lactate, formal quantification of these metabolites was not performed, and hence small amounts of lipids and lactate that may be obscured by baseline noise may not be detected.
In a clinical setting, where decisions such as extent of tumoral resection and addition and dose of post-operative chemotherapy, radiation therapy, and inter-val of follow-up must be made, threshold inter-values can be used as important supplementary information in the noninvasive, neuroradiologic grading of gliomas. A lesion that may have nonspecific conventional MR imaging findings (lack of contrast material enhance-ment, no mass effect, no necrosis, and no edema), but that demonstrates an rCBV value of 7.72 and Cho/ NAA ratio of 2.60, for example, has high sensitivity and specificity for being a high-grade glioma (Fig 1). A comparative lesion (Fig 2) with conventional MR imaging findings suggestive of a high-grade glioma (contrast material enhancement, necrosis, mass ef-fect, and edema) but that demonstrates an rCBV of 1.70 and a Cho/NAA ratio of 0.90 is more in keeping with a low-grade glioma. Hence, using these threshold values in cases that may have nonspecific conven-tional MR imaging findings increases our confidence in glioma grading.
not seem to improve statistical significance substan-tially; however, it would seem that absolute metabo-lite quantification methods should improve the sensi-tivity and possibly the specificity of MR spectroscopy (74). Finally, the lower sensitivity and specificity of Cho compared with rCBV suggests that although Cho levels may correlate directly with tumor cellularity, tumor cellularity may not correlate directly with tu-mor grade. Tutu-mor grade seems to be tu-more reliably correlated with necrosis, nuclear atypia, mitoses, and vascular hyperplasia (13); hence, rCBV may provide stronger correlation with tumor grade than does Cho. This study demonstrates that rCBV and metabolite measurements can improve preoperative tumor grad-ing. MR spectroscopy and perfusion MR imaging are useful adjuncts to conventional MR imaging in plan-ning postoperative chemotherapy, antiangiogenic therapy, and radiation therapy (75–77). Since these techniques avoid some of the problems of sampling error associated with histopathologic examination, it is conceivable that such methods may provide a more accurate overall assessment of tumors. Demonstrat-ing that rCBV and MR spectroscopy are sensitive techniques in this study is an important step in this regard. However, the question of whether one can improve the long-term outcome for patients with gli-omas remains. Long-term outcome studies are re-quired to determine whether rCBV, Cho levels, or pathology is the best predictor of patient outcome.
Conclusion
Preoperative grading of gliomas based on conven-tional MR imaging is often unreliable. Independently and in combination, rCBV measurements and Cho/Cr and Cho/NAA ratios can significantly improve the sensitivity and predictive values of preoperative gli-oma grading. The rCBV measurements are the best parameter for glioma grading. This is extremely im-portant for determining the most optimal therapy regimen and the regularity and aggressiveness of postoperative follow-up and treatment. At our insti-tution, perfusion MR imaging and MR spectroscopy not only have become a routine part of glioma imag-ing, but also have become an important adjunctive tool in providing information in gliomas and regions of the brain that may have eluded histopathologic assessment. Perfusion MR imaging and MR spectros-copy can potentially overcome the limitation of sam-pling error with histopathologic grading of tumor by the ability to sample the entire lesion noninvasively in vivo. Ongoing data collection from longitudinal stud-ies is crucial to determine if rCBV and metabolite ratios can, in the long run, be comparable to his-topathologic examination in predicting tumor behav-ior and patient prognosis.
References
1. Kelly PJ, Daumas-Duport C, Scheithauer BW, et al.Stereotactic histologic correlations of computed tomography- and magnetic resonance imaging-defined abnormalities in patients with glial
neoplasms.Mayo Clin Proc1987;62:450–459
2. Brant-Zawadzki M, Berry I, Osaki L, et al.Gd-DTPA in clinical MR of the brain: I. Intraaxial lesions.AJR Am J Roentgenol1986; 147:1223–1230
3. Brant-Zawadzki M, Badami JP, Mills CM, et al.Primary intracra-nial tumor imaging: a comparison of magnetic resonance and CT.
Radiology1984;150:435–440
4. Bydder GM, Steiner RE, Young IR, et al.Clinical NMR imaging of the brain: 140 cases.AJR Am J Roentgenol1982;139:215–236 5. Just M, Thelen M.Tissue characterization with T1, T2, and proton
density values: results in 160 patients with brain tumors.Radiology
1988;169:779–785
6. Felix R, Schorner W, Laniado M, et al.Brain tumors: MR imaging with gadolinium-DTPA.Radiology1985;156:681–688
7. Moller-Hartmann W, Herminghaus S, Krings T, et al. Clinical application of proton magnetic resonance spectroscopy in the di-agnosis of intracranial mass lesions.Neuroradiology2002;44:371– 381
8. Dean BL, Drayer BP, Bird CR, et al.Gliomas: classification with MR imaging.Radiology1990;174:411–415
9. Watanabe M, Tanaka R, Takeda N.Magnetic resonance imaging and histopathology of cerebral gliomas.Neuroradiology1992;34: 463–469
10. Kondziolka D, Lunsford LD, Martinez AJ.Unreliability of contem-porary neurodiagnostic imaging in evaluating suspected adult su-pratentorial (low-grade) astrocytoma.J Neurosurg1993;79:533–536 11. Knopp EA, Cha S, Johnson G, et al.Glial neoplasms: dynamic contrast-enhanced T2*-weighted MR imaging.Radiology1999;211: 791–798
12. Ginsberg LE, Fuller GN, Hashmi M, et al.The significance of lack of MR contrast enhancement of supratentorial brain tumors in adults: histopathological evaluation of a series.Surg Neurol1998; 49:436–440
13. Daumas-Duport C, Scheithauer B, O’Fallon J, et al.Grading of astrocytomas: a simple and reproducible method.Cancer1988;62: 2152–2165
14. Burger PC, Vogel FS, Green SB, et al.Glioblastoma multiforme and anaplastic astrocytoma: pathologic criteria and prognostic implications.Cancer1985;56:1106–1111
15. Burger P.Malignant astrocytic neoplasms: classification, pathol-ogy, anatomy, and response to therapy.Semin Oncol1986;13:16–20 16. Aronen HJ, Gazit IE, Louis DN, et al.Cerebral blood volume maps of gliomas: comparison with tumor grade and histologic findings.
Radiology1994;191:41–51
17. Bruening R, Kwong KK, Vevea MJ, et al.Echo-planar MR deter-mination of relative cerebral blood volume in human brain tumors: T1 versus T2 weighting.AJNR Am J Neuroradiol1996;17:831–840 18. Sugahara T, Korogi Y, Kochi M, et al.Correlation of MR imaging-determined cerebral blood volume maps with histologic and angio-graphic determination of vascularity of gliomas.AJR Am J Roent-genol1998;171:1479–1486
19. Sugahara T, Korogi Y, Shigematsu Y, et al. Value of dynamic susceptibility contrast magnetic resonance imaging in the evalua-tion of intracranial tumors.Top Magn Reson Imaging1999;10:114– 124
20. Wong ET, Jackson EF, Hess KR, et al.Correlation between dy-namic MRI and outcome in patients with malignant gliomas. Neu-rology1998;50:777–781
21. Wong JC, Provenzale JM, Petrella JR.Perfusion MR imaging of brain neoplasms.Am J Roentgenol2000;174:1147–1157
22. Cha S, Knopp EA, Johnson G, et al.Intracranial mass lesions: dynamic contrast-enhanced susceptibility-weighted echo-planar perfusion MR imaging.Radiology2002;223:11–29
23. Lev MH, Rosen BR.Clinical applications of intracranial perfusion MR imaging.Neuroimaging Clin N Am1999;9:309–331
24. Shin JH, Lee HK, Kwun BD, et al.Using relative cerebral blood flow and volume to evaluate the histopathologic grade of cerebral gliomas: preliminary results.Am J Roentgenol2002;179:783–789 25. Petrella JR, Provenzale JM.MR perfusion imaging of the brain:
techniques and applications.Am J Roentgenol2000;175:207–219 26. Adamson AJ, Rand SD, Prost RW, et al.Focal brain lesions: effect
of single-voxel proton MR spectroscopic findings on treatment decisions.Radiology1998;209:73–78
27. Alger JR, Frank JA, Bizzi A, et al.Metabolism of human gliomas: assessment with H-1 MR spectroscopy and F- 18 fluorodeoxyglu-cose PET.Radiology1990;177:633–641
29. Bruhn H, Frahm J, Gyngell ML, et al.Noninvasive differentiation of tumors with use of localized H-1 MR spectroscopy in vivo: initial experience in patients with cerebral tumors.Radiology1989;172: 541–548
30. Castillo M, Kwock L. Clinical applications of proton magnetic resonance spectroscopy in the evaluation of common intracranial tumors.Top Magn Reson Imaging1999;10:104–113
31. Castillo M, Smith JK, Kwock L.Correlation ofmyo-inositol levels and grading of cerebral astrocytomas. AJNR Am J Neuroradiol
2000;21:1645–1649
32. Chang L, McBride D, Miller BL, et al. Localized in vivo 1H magnetic resonance spectroscopy and in vitro analyses of hetero-geneous brain tumors.J Neuroimaging1995;5:157–163
33. Cheng LL, Chang IW, Louis DN, et al.Correlation of high-reso-lution magic angle spinning proton magnetic resonance spectros-copy with histopathology of intact human brain tumor specimens.
Cancer Res1998;58:1825–1832
34. Danielson ER, Ross BD.Magnetic Resonance Spectroscopy of Neurological Diseases.New York, NY: Marcel Dekker Inc., 1998 35. Dowling C, Bollen AW, Noworolski SM, et al.Preoperative proton MR spectroscopic imaging of brain tumors: correlation with his-topathologic analysis of resection specimens.AJNR Am J Neurora-diol2001;22:604–612
36. Falini A, Calabrese G, Origgi D, et al.Proton magnetic resonance spectroscopy and intracranial tumours: clinical perspectives.
J Neurol1996;243:706–714
37. Fountas KN, Kapsalaki EZ, Gotsis SD, et al.In vivo proton mag-netic resonance spectroscopy of brain tumors.Stereotact Funct Neurosurg2000;74:83–94
38. Fulham MJ, Bizzi A, Dietz MJ, et al.Mapping of brain tumor metabolites with proton MR spectroscopic imaging: clinical rele-vance.Radiology1992;185:675–686
39. Kaminogo M, Ishimaru H, Morikawa M, et al.Diagnostic potential of short echo time MR spectroscopy of gliomas with single-voxel and point-resolved spatially localised proton spectroscopy of brain.
Neuroradiology2001;43:353–363
40. Kugel H, Heindel W, Ernestus RI, et al.Human brain tumors: spectral patterns detected with localized H-1 MR spectroscopy.
Radiology1992;183:701–709
41. Butzen J, Prost R, Chetty V, et al.Discrimination between neo-plastic and nonneoneo-plastic brain lesions by use of proton MR spectroscopy: the limits of accuracy with a logistic regression model.AJNR Am J Neuroradiol2000;21:1213–1219
42. Luyten PR, Marien AJ, Heindel W, et al.Metabolic imaging of patients with intracranial tumors: H-1 MR spectroscopic imaging and PET.Radiology1990;176:791–799
43. McBride DQ, Miller BL, Nikas DL, et al.Analysis of brain tumors using 1H magnetic resonance spectroscopy.Surg Neurol1995;44: 137–144
44. McKnight TR, Noworolski SM, Vigneron DB, et al.An automated technique for the quantitative assessment of 3D-MRSI data from patients with glioma.J Magn Reson Imaging2001;13:167–177 45. Meyerand ME, Pipas JM, Mamourian A, et al.Classification of
biopsy-confirmed brain tumors using single-voxel MR spectros-copy.AJNR Am J Neuroradiol1999;20:117–123
46. Negendank WG, Sauter R, Brown TR, et al. Proton magnetic resonance spectroscopy in patients with glial tumors: a multicenter study.J Neurosurg1996;84:449–458
47. Nelson SJ.Analysis of volume MRI and MR spectroscopic imaging data for the evaluation of patients with brain tumors.Magn Reson Med2001;46:228–239
48. Ott D, Hennig J, Ernst T.Human brain tumors: assessment with in vivo proton MR spectroscopy.Radiology1993;186:745–752 49. Poptani H, Gupta RK, Roy R, et al.Characterization of
intracra-nial mass lesions with in vivo proton MR spectroscopy.AJNR Am J Neuroradiol1995;16:1593–1603
50. Preul MC, Caramanos Z, Collins DL, et al.Accurate, noninvasive diagnosis of human brain tumors by using proton magnetic reso-nance spectroscopy.Nat Med1996;2:323–325
51. Rand SD, Prost R, Haughton V, et al.Accuracy of single-voxel proton MR spectroscopy in distinguishing neoplastic from nonneo-plastic brain lesions.AJNR Am J Neuroradiol1997;18:1695–1704 52. Ross B, Michaelis T.Clinical applications of magnetic resonance
spectroscopy.Magn Reson Q1994;10:191–247
53. Rutter A, Hugenholtz H, Saunders JK, et al.Classification of brain tumors by ex vivo 1H NMR spectroscopy.J Neurochem1995;64: 1655–1661
54. Shimizu H, Kumabe T, Tominaga T, et al.Noninvasive evaluation of malignancy of brain tumors with proton MR spectroscopy.AJNR Am J Neuroradiol1996;17:737–747
55. Tedeschi G, Lundbom N, Raman R, et al.Increased choline signal coinciding with malignant degeneration of cerebral gliomas: a serial proton magnetic resonance spectroscopy imaging study.
J Neurosurg1997;87:516–524
56. Wilken B, Dechent P, Herms J, et al.Quantitative proton magnetic resonance spectroscopy of focal brain lesions.Pediatr Neurol2000; 23:22–31
57. Tamiya T, Kinoshita K, Ono Y, et al.Proton magnetic resonance spectroscopy reflects cellular proliferative activity in astrocytomas.
Neuroradiology2000;42:333–338
58. Shimizu H, Kumabe T, Shirane R, et al. Correlation between choline level measured by proton MR spectroscopy and Ki-67 labeling index in gliomas.AJNR Am J Neuroradiol2000;21:659–665 59. Yang D, Korogi Y, Sugahara T, et al.Cerebral gliomas: prospective comparison of multivoxel 2D chemical- shift imaging proton MR spectroscopy, echoplanar perfusion and diffusion-weighted MRI.
Neuroradiology2002;44:656–666
60. Law M, Cha S, Knopp EA, et al.High-grade gliomas and solitary metastases: differentiation by using perfusion and proton spectro-scopic MR imaging.Radiology2002;222:715–721
61. Henry RG, Vigneron DB, Fischbein NJ, et al. Comparison of relative cerebral blood volume and proton spectroscopy in patients with treated gliomas.AJNR Am J Neuroradiol2000;21:357–366 62. Tzika AA, Vajapeyam S, Barnes PD.Multivoxel proton MR
spec-troscopy and hemodynamic MR imaging of childhood brain tu-mors: preliminary observations.AJNR Am J Neuroradiol1997;18: 203–218
63. Lev MH.Gliomatosis cerebri has normal relative blood volume: really?! Who cares? Should you?AJNR Am J Neuroradiol2002;23: 345–346
64. Ringertz J.Grading of gliomas.Acta Pathol Microbiol Scand1950; 27:51–64
65. Wetzel SG, Cha S, Johnson G, et al.Relative cerebral blood volume measurements in intracranial mass lesions: interobserver and in-traobserver reproducibility study.Radiology2002;224:797–803 66. Lin AP, Ross BD.Short-echo time proton MR spectroscopy in the
presence of gadolinium.J Comput Assist Tomogr2001;25:705–712 67. Murphy PS, Dzik-Jurasz AS, Leach MO, et al.The effect of
Gd-DTPA on T1-weighted choline signal in human brain tumours.
Magn Reson Imaging2002;20:127–130
68. Smith JK, Kwock L, Castillo M.Effects of contrast material on single-volume proton MR spectroscopy.AJNR Am J Neuroradiol
2000;21:1084–1089
69. Tate AR, Majos C, Moreno A, et al.Automated classification of short echo time in in vivo 1H brain tumor spectra: a multicenter study.Magn Reson Med2003;49:29–36
70. Nelson JS, Tsukada Y, Schoenfeld D, et al.Necrosis as a prognos-tic criterion in malignant supratentorial, astrocyprognos-tic gliomas. Can-cer1983;52:550–554
71. Li X, Lu Y, Pirzkall A, et al.Analysis of the spatial characteristics of metabolic abnormalities in newly diagnosed glioma patients.J Magn Reson Imaging2002;16:229–237
72. Carpinelli G, Carapella CM, Palombi L, et al.Differentiation of glioblastoma multiforme from astrocytomas by in vitro 1H MRS analysis of human brain tumors.Anticancer Res1996;16:1559–1563 73. McKnight TR, von dem Bussche MH, Vigneron DB, et al. His-topathological validation of a three-dimensional magnetic reso-nance spectroscopy index as a predictor of tumor presence.J Neu-rosurg2002;97:794–802
74. Isobe T, Matsumura A, Anno I, et al.Quantification of cerebral metabolites in glioma patients with proton MR spectroscopy using T2 relaxation time correction.Magn Reson Imaging2002;20:343– 349
75. Cha S, Knopp EA, Johnson G, et al.Dynamic contrast-enhanced T2-weighted MR imaging of recurrent malignant gliomas treated with thalidomide and carboplatin.AJNR Am J Neuroradiol2000; 21:881–890
76. Nelson SJ, Huhn S, Vigneron DB, et al.Volume MRI and MRSI techniques for the quantitation of treatment response in brain tumors: presentation of a detailed case study.J Magn Reson Imag-ing1997;7:1146–1152