ISSN Online: 1949-5005 ISSN Print: 1949-4998
DOI: 10.4236/health.2018.102015 Feb. 11, 2018 181 Health
A Study into Blood Flow, Heart Rate Variability,
and Body Surface Temperature While Listening
to Music
Kenichi Itao
1, Makoto Komazawa
1, Hiroyuki Kobayashi
21WINFrontier Laboratory, WINFrontier Co. Ltd., Tokyo, Japan 2JUNTENDO University, Tokyo, Japan
Abstract
In this study we examined the relaxing effects of listening to music on a total of 12 women aged from their 20s to their 40s by measuring their blood flow, heart rate variability, and their body surface temperature. As a result, We found that there was a tendency for the volume of blood flow to the fingertips to significantly increase when listening to classical music, but there was a va-riety of changes in blood flow between each age group for healing music and J-Pop music. When measuring heart rate it was found that the LF/HF value, which is an index for the autonomic nervous system which shows tension and stress, fell significantly when listening to each type of music. Lastly, there was a trend for body surface temperature to rise when listening to classical or healing music, a rise which was particularly significant when listening to healing music. This study shows that a relaxing effect can be expected for all indices when listening to classical music. However, for healing music and J-Pop, personal musical preferences seemed to have an effect and the results were varied.
Keywords
Music, Blood Flow, Heart Rate Variability, Autonomic Nervous System, Body Surface Temperature
1. Introduction
Today’s world has long been described as a society of stress, but it is now known that continuous levels of excess stress over long periods of time can induce irre-gularities in the autonomic nervous system and the secretion of hormones from How to cite this paper: Itao, K.,
Komaza-wa, M. and Kobayashi, H. (2018) A Study into Blood Flow, Heart Rate Variability, and Body Surface Temperature While Lis-tening to Music. Health, 10, 181-188. https://doi.org/10.4236/health.2018.102015
Received: January 13, 2018 Accepted: February 8, 2018 Published: February 11, 2018
Copyright © 2018 by authors and Scientific Research Publishing Inc. This work is licensed under the Creative Commons Attribution International License (CC BY 4.0).
DOI: 10.4236/health.2018.102015 182 Health the adrenal cortex, etc. [1]. This can lead to a range of physical and mental dis-orders, such as high blood pressure, stomach ulcers, and depression [2].
This is why it is so important for individuals to be able to improve their ability to relieve the stress that they experience in their everyday lives.
In recent years, musical therapy has been attracting attention as one way to relieve stress [3], and is often used for purposes other than those in the medical field, such as in the promotion of wellbeing and relaxation.
From a medical standpoint, the effect of using music has been proven to re-gulate heart rate, blood pressure, and breathing, reduce the level of stress hor-mones, and improve immunity. It has also been seen to be effective in the reduc-tion of psychological stress [4], [5].
Furthermore, there are previous studies that, after measuring heart rate varia-bility and brain waves, conclude that listening to music has a relaxing effect [6], [7]. However, the number of these studies remains small and there are very few studies that examine multiple indices of the relaxing effect of listening to music.
Therefore this study will use three indices, blood flow, changes in heart rate variability, and body surface temperature to investigate the effect that listening to music has on the mind and body, as well as its comforting effect.
2. Experiment Description
2.1. Subject Selection
We selected 12 healthy women between their 20 s and 40 s (4 women each from the 20 s, 30 s, and 40 s age groups), who had been fully briefed and had agreed to participate in the study. We also acquired informed consent from each subject. In this research, we adopted healthy subjects. (Those who do not have a specific disease).
2.2. Measurement Indices
1) Volume of blood flowWe measured the average blood flow flux (PU) on the fingertip of the index finger of each subject using a blood flow sensor [8] (a moorFLPI manufactured by Moor Instruments). This is a piece of blood-flow imaging equipment that measures blood flow through contactless video imaging that uses laser speckling technology. In this study we calculated the average blood flow volume of the middle finger and used it in my analysis.
2) Heart rate variability
DOI: 10.4236/health.2018.102015 183 Health Hz - 0.4 Hz as a high frequency component (HF). The LF/HF values are used as sympathetic autonomic nervous system which represent tension, stimulation, and stress [11]. In this study we will evaluate the degree of stress and relaxation when listening to music using LF/HF.
3) Body surface temperature
We measured body surface temperature using a thermometer (a TIR-308 manufactured by Trusco Nakayama Corporation) and used it in my analysis.
2.3. Music
We had our subjects listen to three pieces of music, which were:
1) Classical music (“Pachelbel’s Canon” by Orchestre de chambre Jean- François Paillard)
2) Healing music (“Harukanaru Kage” by Yumi Nanatsutani *A cover of “(They Long to Be) Close to You” by The Carpenters)
3) Japanese pop music (J-Pop) (“Exile Pride - Konna Sekai wo Ai suru tame” by Exile)
2.4. Experiment Protocol
The flow of each experiment is shown in Figure 1. Once the subjects entered the lab, they were seated in a chair, and after taking a short rest, we began the expe-riment.
During the experiment, subjects would listen to 5 minutes of silence, followed by 3 minutes of music, followed by 5 more minutes of silence.
The heart rate sensor was attached from the start of the experiment until the end and continuously took heart rate data.
The blood flow sensor measured changes in blood flow volume at the fingertip from just before the music started until the end of the three minutes.
The body surface temperature was measured twice, just before the music started playing and just after. In this study, experiments were conducted three times (once for classical, healing, and J-Pop music) for each of the 12 subjects.
2.5. Statistical Processing
We used IBM SPSS Statics Version 22 to process the statistics for the measured data. The significance level of the testing was set at 5%.
3. Experiment Results
3.1. Blood Flow Volume
Here we compared the blood flow volume as measured by the blood flow sensor at the fingertip before and during the music.
Figure 2 shows the overall average difference in blood flow volume before and while listening to each piece of music. Tables 1-4 show blood flow volume re-sults for each age group and the overall result.
DOI: 10.4236/health.2018.102015 184 Health
Figure 1. Experiment flow.
[image:4.595.205.540.363.432.2]Figure 2. Changes in blood flow before and while listening to music (overall average).
Table 1. Changes in blood flow before and while listening to music (overall average).
Before Flux(PU) Listening Flux(PU)
Classic 87.8 ± 21.5 91.6 ± 22.5
JPOP 85.6 ± 22.4 84.7 ± 22.2
[image:4.595.206.540.463.530.2]Healing 80.7 ± 28.1 80.3 ± 28
Table 2. Changes in blood flow before and while listening to music (20s group average).
Before Flux(PU) Listening Flux(PU)
Classic 71.7 ± 21.6 75.6 ± 19.3
JPOP 68.5 ± 15.5 68.9 ± 14.9
[image:4.595.208.540.561.629.2]Healing 54.9 ± 14.4 55 ± 17.6
Table 3. Changes in blood flow before and while listening to music (30s group average).
Before Flux(PU) Listening Flux(PU)
Classic 86.2 ± 17.2 86.3 ± 17.8
JPOP 82 ± 14.7 78.1 ± 13.6
[image:4.595.208.540.661.724.2]Healing 77.3 ± 16.3 77.3 ± 15.5
Table 4. Changes in blood flow before and while listening to music (40s group average).
Before Flux(PU) Listening Flux(PU)
Classic 105.6 ± 12.3 113 ± 11.3
JPOP 106.4 ± 20.1 107.1 ± 17.2
DOI: 10.4236/health.2018.102015 185 Health flow volume to rise when listening to classical music compared to the measure-ment took beforehand. When we carried out a significance test we found a sig-nificant difference (t-test, p < 0.05). However, for J-Pop and healing music, we could not really find a variability in blood flow volume.
Breaking the results down by age group, they show that there was a tendency for blood flow volume to rise when listening to classical music for all age groups, but the results were varied when it came to J-Pop and healing music. These re-sults show that there is a tendency for blood flow to improve when listening to classical music and that it is possible to expect a relaxing effect from it.
3.2. Heart rate Variability
Here we compared the measurements taken by the heart rate sensor before, while, and after listening to music. In this study we used the LF/HF value which is used as an index for sympathetic nervous system. The larger the LF/HF value is, the more tension, stimulation, and stress. Figure 3 shows the overall average variability of LF/HF before, during, and after the music. Tables 5-8 show LF/HF results for each age group and overall.
[image:5.595.219.527.368.508.2]The results show that as an overall average, there was a tendency for LF/HF to fall and for the subjects to relax while listening to the music compared to before
[image:5.595.207.539.555.624.2]Figure 3. Changes in LF/HF before, while, and after listening to music (overall).
Table 5. Changes in LF/HF before, while, and after listening to music (overall average).
Before Listening After
Classic 1.3 ± 0.66 0.46 ± 0.46 0.87 ± 0.82
JPOP 1.49 ± 1.29 0.5 ± 0.68 1.09 ± 0.75
Healing 1.54 ± 1.15 0.91 ± 0.69 1.09 ± 0.71
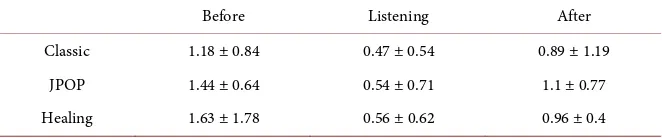
Table 6. Changes in LF/HF before, while, and after listening to music (20s group average).
Before Listening After
Classic 1.18 ± 0.84 0.47 ± 0.54 0.89 ± 1.19
JPOP 1.44 ± 0.64 0.54 ± 0.71 1.1 ± 0.77
[image:5.595.208.539.655.724.2]DOI: 10.4236/health.2018.102015 186 Health
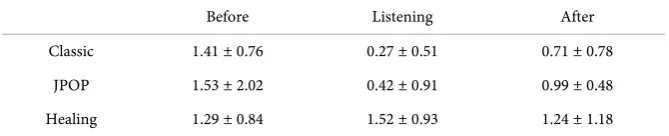
Table 7. Changes in LF/HF before, while, and after listening to music (30s group average).
Before Listening After
Classic 1.41 ± 0.76 0.27 ± 0.51 0.71 ± 0.78
JPOP 1.53 ± 2.02 0.42 ± 0.91 0.99 ± 0.48
[image:6.595.207.540.189.257.2]Healing 1.29 ± 0.84 1.52 ± 0.93 1.24 ± 1.18
Table 8. Changes in LF/HF before, while, and after listening to music (40s group average).
Before Listening After
Classic 1.59 ± 0.58 0.69 ± 0.44 1.06 ± 0.65
JPOP 1.6 ± 0.85 0.56 ± 0.3 1.2 ± 1.08
Healing 1.56 ± 0.69 0.36 ± 0.06 1.29 ± 0.55
and afterwards. When we carried out a significance test we found a tendency for a significant reduction in LF/HF for each piece of music when comparing mea-surements before the music and while listening (t-test, p < 0.05). When com-paring the measurements taken while listening to the music and after it finished, we found a tendency for a significant fall in LF/HF for classical and healing mu-sic while the subject was listening (t-test, p < 0.05). Even when the results are broken down by age group, despite the fact that they show a rise in LF/HF for women in their 30’s while listening to healing music, all of the other results tended to conform to the overall average.
These results show that while listening to music sympathetic nervous system is suppressed and parasympathetic nervous system is heightened, meaning a re-laxing effect can be expected.
3.3. Body Surface Temperature
Here we compared the difference in body surface temperature taken before the music began and while listening to the music.
Figure 4 shows the overall average difference in body surface temperature
from before listening to the music and while listening to the music for each piece of music. Tables 9-12 show temperature results for each age group and the overall result.
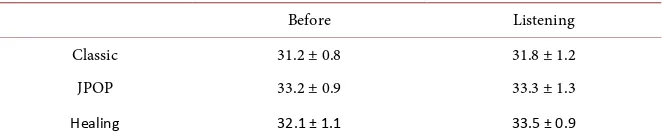
The result of these experiments show that, as an overall average, body surface temperature did rise after listening to both classical and healing music. Each age group generally conforms with the overall tendency. A tendency can be seen for a particularly significant rise in body surface temperature while listening to healing music (t-test, p < 0.05).
4. Conclusions
DOI: 10.4236/health.2018.102015 187 Health
[image:7.595.208.540.279.348.2]Figure 4. Change in body temperature before and while listening to music (overall aver-age).
Table 9. Change in body temperature before and while listening to music (overall average).
Before Listening
Classic 31.2 ± 1.3 31.4 ± 1.1
JPOP 32 ± 1.3 32 ± 1.4
[image:7.595.206.539.391.459.2]Healing 30.8 ± 1.6 31.6 ± 1.7
Table 10. Change in body temperature before and while listening to music (20’s group average).
Before Listening
Classic 31.1 ± 1.6 31.4 ± 1.2
JPOP 31.4 ± 1.7 31.2 ± 1.5
Healing 30.1 ± 1.5 30.5 ± 1.5
Table 11. Change in body temperature before and while listening to music (30’s group average).
Before Listening
Classic 31.2 ± 1.6 31 ± 1.1
JPOP 31.6 ± 0.6 31.5 ± 0.5
Healing 30.1 ± 1.7 30.8 ± 0.4
Table 12. Change in body temperature before and while listening to music (40’s group average).
Before Listening
Classic 31.2 ± 0.8 31.8 ± 1.2
JPOP 33.2 ± 0.9 33.3 ± 1.3
Healing 32.1 ± 1.1 33.5 ± 0.9
[image:7.595.207.540.502.569.2] [image:7.595.208.539.612.681.2]DOI: 10.4236/health.2018.102015 188 Health was more varied by age group for J-Pop and healing music. We think that this may be due to differences in musical preferences, etc., between the generations.
For heart rate variability, there was a tendency for the LF/HF values, which represent the index for the autonomic nervous system, which in turn indicates the degree of tension or stress a person is experiencing, to significantly fall while listening to each piece of music.
Lastly, there was a tendency for body surface temperature to significantly rise while listening to classical or healing music, and this rise was particularly pro-nounced when listening to healing music.
As a result of this study, there is a tendency to be able to expect a relaxing ef-fect when listening to classical music using each index. On the other hand, per-sonal musical preferences can be thought to have had an effect on the results for healing and J-Pop music and these results were more varied.
In the future we would like to continue my research into the relaxing effect of listening to music while taking personal musical preferences into account and using multiple indices
References
[1] Onaka, T. (2005) Stress and Its Neural Mechanisms. Journal of Pharmacological Sciences, 126, 170-173.
[2] Agari, I. and Takenaka, K. (2005) Sutoresu Manejimeno—“Kore Made” to “Kore Kara” [Stress Management—“Until Now” and “From Now”]. Yumani Shobo, 9, 4-6. [3] Urakawa, K. (2003) Rirakuseshon Puroguramu ni Okeru Ongaku ni Okeru Shinri-teki Kouka [The Psychological Effects of Music in Relaxation Programs]. Nihon Ongaku Ryoho Gakkaishi, 3, 71-78.
[4] Kotake, N., Nakamura, K. and Takahashi, Y. (2004). Ongaku Ryoho no Rirakuse-shon Kouka ni Kan suru Kenkyu [Research into the Relaxing effect of Musical Therapy]. Kenritsu Nagasaki Shiboruto Daigaku Kango Eiyogakubu Kiyo, 5, 1-10. [5] Hinohara, S. (2002) Ongaku Ryoho no Maukaubeki Michi [Where We Should Turn
in Musical Therapy]. Nihon Ongaku Ryoho Gakkaishi, 2, 1-10.
[6] Hori, K., Senga, Y., Minami, S. and Hori, S. (2004) Ongaku Choshu ga Shinpaku Hendo ni Oyobosu Eikyo [The Effect of Listening to Music on Heart Rate Va-riance]. Nihon Seikisho Gakkaishi, 41, 131-140.
[7] Fujimoto, C., et al. (2002) Ongaku Kanshochu ni Okeru Arufa Taiiki Seibun to Shinpaku Hendo no Kankei [Alpha Band Components in Music Appreciation and their Relationship to Heart Rate Variance]. Kagawa Kenritsu Iryo Tanki Daigaku Kiyo, 4, 129-131.
[8] Moor Instruments, moorFLPI. http://gb.moor.co.uk/product/moorflpi-moorflpi/4 [9] WHS-1 from Union Tool Co. http://uniontool.co.jp/product/sensor/index_02.html [10] Advance Viewer Software from WINFrontier Co., Ltd.
http://www.winfrontier.com/sensor.html