ORIGINAL RESEARCH
Diffusion Tensor Imaging of the Optic Nerve in
Multiple Sclerosis: Association with Retinal
Damage and Visual Disability
S.A. Smith Z.R. Williams J.N. Ratchford S.D. Newsome S.K. Farrell J.A.D. Farrell A. Gifford N.R. Miller P.C.M. van Zijl P.A. Calabresi D.S. Reich
BACKGROUND AND PURPOSE: There is a well-known relationship between MS and damage to the optic nerve, but advanced, quantitative MR imaging methods have not been applied to large cohorts. Our objective was to determine whether a short imaging protocol (⬍10 minutes), implemented with standard hardware, could detect abnormal water diffusion in the optic nerves of patients with MS.
MATERIALS AND METHODS: We examined water diffusion in human optic nerves via DTI in the largest MS cohort reported to date (104 individuals, including 38 optic nerves previously affected by optic neuritis). We also assessed whether such abnormalities are associated with loss of visual acuity (both high and low contrast) and damage to the retinal nerve fiber layer (assessed via optical coherence tomography).
RESULTS: The most abnormal diffusion was found in the optic nerves of patients with SPMS, especially in optic nerves previously affected by optic neuritis (19% drop in FA). DTI abnormalities correlated with both retinal nerve fiber layer thinning (correlation coefficient, 0.41) and loss of visual acuity, particularly at high contrast and in nerves previously affected by optic neuritis (correlation coefficient, 0.54). However, diffusion abnormalities were overall less pronounced than retinal nerve fiber layer thinning.
CONCLUSIONS:DTI is sensitive to optic nerve damage in patients with MS, but a short imaging sequence added to standard clinical protocols may not be the most reliable indicator of optic nerve damage.
ABBREVIATIONS:CI ⫽confidence interval; DTI ⫽diffusion tensor imaging; EDSS⫽Expanded Disability Status Scale; EPI⫽ echo-planar imaging; FA ⫽ fractional anisotropy; HV ⫽ healthy volunteer; ICC, intra- and interclass correlation coefficient; MD⫽mean diffusivity; MS⫽multiple sclerosis; MSSS⫽MS severity score; OCT⫽optical coherence tomography; OD⫽right eye/optic nerve; ON⫽optic neuritis; OS⫽left eye/optic nerve; PPMS⫽primary-progressive MS; PRNFL⫽ peripapillary retinal nerve fiber layer; RRMS⫽relapsing-remitting MS; ROI⫽region of interest; SE ⫽spin-echo; SENSE⫽ sensitivity encoding; SPMS⫽secondary-progressive MS; T2WI ⫽ T2-weighted imaging; TMV⫽ total macular volume; VEP⫽ visual-evoked potential; 储 ⫽ parallel diffusivity;⬜⫽perpendicular diffusivity
I
mpaired vision is extremely common in MS and may arise from damage (demyelination and axonal loss) to different components (eg, optic nerve, tract, and radiation) of the visualsystem. Of these components, the optic nerve is the best char-acterized, because ON is the presenting symptom in many cases of MS.1,2Nevertheless, recent research suggests that vi-sual dysfunction accumulates even without prior ON. This dysfunction can be detected clinically by using low-contrast letters to assess visual sensory function3, OCT to assess dam-aged or destroyed visual axons by measuring PRNFL thickness and TMV4, and VEPs to assess speed and amplitude of impulse conduction.5
MR imaging can detect visual pathway damage and has been extensively investigated. MR imaging shows T2-weighted hyper-intensities in optic nerves with prior ON, whereas in acute cases, postcontrast T1-weighted hyperintensities are appreciated.6 Re-cently, quantitative MR imaging techniques such as magnetiza-tion transfer imaging7-9 and diffusion-weighted imaging10-16 have revealed time-evolving abnormalities after an attack of ON. Unfortunately, both of these techniques are time-consuming, prohibiting clinical application.
DTI uses information contained in the diffusion properties of water to probe tissue microstructural abnormalities such as demyelination and axonal damage, both of which occur in ON. The most commonly reported DTI-derived indices are FA, MD, and储and⬜to the long axis of specific white matter tracts.17DTI studies of affected optic nerves in patients with a remote history of ON reveal reduced FA and elevated diffu-Received September 24, 2010; accepted after revision January 7, 2011.
From the Department of Radiology and Radiological Sciences (S.A.S.), Biomedical Engi-neering (S.A.S.), Institute of Imaging Science (S.A.S.), Vanderbilt University, Nashville, Tennessee; Russell H. Morgan Department of Radiology and Radiological Science (S.A.S., J.A.D.F., P.C.M.v.Z., D.S.R.), Baltimore, Maryland; F. M. Kirby Research Center for Func-tional Brain Imaging (S.A.S., J.A.D.F., P.C.M.v.Z.), Kennedy Krieger Institute, Baltimore, Maryland; Wilmer Eye Institute (Z.R.W., N.R.M.) and Departments of Neurology (J.N.R., S.D.N., S.K.F., D.S.R., P.A.C.) and Neurogenetics (A.G.), Johns Hopkins University, Balti-more, Maryland; and National Institute for Neurological Disease and Stroke (D.S.R.), National Institutes of Health, Bethesda, Maryland.
This study was supported by the National Multiple Sclerosis Society (grant TR3760A3), the National Institutes of Health (grants K01EB009120, K99NS064098, and P41RR015241, and the Intramural Research Program of the National Institute of Neurological Disorders and Stroke), and an unrestricted grant from EMD Serono to support data collection. The content is solely the responsibility of the authors and does not necessarily represent the official views of the funding agencies.
S.A.S. and Z.R.W. contributed equally.
Please address correspondence to Seth A. Smith, Department of Radiology and Radiolog-ical Sciences, Vanderbilt University, 1161 21st Ave S, MCN-AAA3111, Nashville, TN 37232; e-mail: [email protected]
Indicates open access to non-subscribers at www.ajnr.org
Indicates article with supplemental on-line table.
sivities as well as correlations with concurrent measurements of acuity, VEPs, and PRNFL thickness.10,14,16However, sam-ple sizes in these studies have been low due to technical hin-drances related to the small diameter (ⱕ3 mm) and mobility of the optic nerves and their proximity to the paranasal si-nuses, which induce susceptibility-related artifacts and inter-fere with conventional DTI. In addition, lengthy acquisition times actually may accentuate the effects of optic nerve motion.
The goals of this study were to 1) develop and evaluate a rapid optic nerve DTI sequence performed with standard coils in a clinically acceptable timeframe (⬍10 minutes) and 2) re-late abnormal water diffusion in the optic nerve to measures of visual sensory function and retinal structure in the largest MS cohort reported to date. This cohort includes patients who reported an attack of acute ON⬎6 weeks before scanning, patients without a history of clinically recognized ON, and healthy volunteers. Thus, we examined optic nerve abnormal-ities in a representative MS cohort rather than a cohort dom-inated by patients with ON. We hypothesized that DTI indices would distinguish MS optic nerves affected by prior ON from MS optic nerves without a history of ON, and from healthy optic nerves. Furthermore, we hypothesized that, at least in MS, DTI-derived measurements would correlate with visual sensory dysfunction, PRNFL thinning, and loss of TMV.
Materials and Methods
Participants
Individuals with MS were recruited from the Johns Hopkins MS Cen-ter (Baltimore, Maryland) afCen-ter the examining neurologist confirmed the diagnosis and the absence of confounding ophthalmologic or neurologic diseases. Healthy volunteers were recruited from the com-munity. Participants were not selected based on history of ON;
how-ever, scans performed⬍6 weeks after the onset of acute ON were
excluded. OCT and visual acuity testing by using both high- and low-contrast (Sloan) letters were performed on all participants within 30 days of MR imaging. The median time between MR imaging and OCT and visual acuity testing was 0 days (range, 0 –23 days). Before testing, all participants gave signed, informed consent, and all studies were approved by the institutional review board.
OCT and Visual Acuity Testing
PRNFL thickness, TMV, and both high- and low-contrast visual
acu-ity scores were measured as described previously.4PRNFL and TMV
measurements were obtained by using an OCT-3 scanner (Stratus; Carl Zeiss Meditec, Dublin, California) with the “Fast RNFL Thick-ness” and “Fast Macular ThickThick-ness” protocols, respectively. Partici-pants were encouraged to use their corrective lenses when performing contrast acuity testing with Sloan letter charts (Precision Vision, La Salle, Illinois) at 100%, 2.5%, and 1.25% contrast. Results were re-corded as the percentage of letters, out of 70, correctly identified.
MR Imaging Acquisition
MR imaging data were obtained on a 3T Achieva MR system (Philips, Best, the Netherlands) by using the quadrature body coil for trans-mission and a 16-channel neurovascular coil for reception. Data were acquired during a 442-day period between March 26, 2008, and June 11, 2009. Multisection, fat-saturated, double-echo proton-density
and T2-weighted sequences (TR/TE1/TE2⫽3000/10/80 ms;
echo-train length, 100; nominal acquired resolution, 0.67⫻0.88 mm
in-plane; matrix, 224⫻170; section thickness, 3.35 mm; SENSE factor,
2.5; 2 averages) and T1-weighted sequences (TR/TE⫽774/13 ms;
echo-train length, 2; nominal acquired resolution, 0.58⫻0.74 mm
in-plane; matrix, 260⫻204; section thickness, 3 mm; SENSE factor,
2; 2 averages) were used to provide anatomic information. In the MS cohort, the T1-weighted scans were performed after the intravenous administration of 0.1 mmol/kg gadopentetate dimeglumine (Magn-evist; Bayer HealthCare, Leverkusen, Germany). The sections were oriented coronal to the head, which was oblique to the orbital portion of the optic nerves in some cases.
DTI was performed in the same plane as conventional MR imag-ing, with a pulsed-gradient, spin-echo with single-shot,
echo-planar-imaging readout. The nominal acquired voxel size was 1.18⫻1.18⫻
2.5 mm, and the data were zero-padded ink-space to achieve a
recon-structed in-plane resolution of 0.28⫻0.28 mm. The FOV was 80⫻80
mm, and 25 sections were obtained covering the anterior visual path-way from the globe to the optic chiasm. A high parallel-imaging factor (SENSE factor, 3) enabled reduced TE, and high-order shims were combined with outer volume suppression to minimize susceptibility-related artifacts arising from the paranasal sinuses and tissues lateral to the optic nerves, respectively. Other parameters were as follows:
TR/TE⫽5300/55 ms, b-value⫽500 s/mm2, 15 gradient directions
uniformly distributed about a sphere, and 5 minimally
diffusion-weighted acquisitions (b⫽0; actual b-value,⬃33 s/mm2) that were
averaged on the scanner. Two separate DTI acquisitions were ob-tained and entered into the tensor calculation as independent mea-surements without preaveraging. No ocular fixation was used. The total scan time for the DTI acquisitions was 9 minutes 22 seconds.
MR Imaging Data Analysis
All diffusion data were processed using CATNAP.18
Diffusion-weighted images were coregistered to the firstb⫽0 scan by using a 6
degree-of-freedom registration algorithm supplied by AIR.19
Diffu-sion-weighting was corrected for the rotational component of the registration, and the tensor was calculated in the standard manner.
Maps of FA, MD,⬜, and储were calculated.17
The investigative team, which included a neuroradiologist, 2 neuro-ophthalmologists, and 4 neurologists, determined that the MD maps displayed the best contrast between the optic nerves and the surrounding CSF. Therefore, in each section where the optic nerve was visible, a trained neuro-ophthalmologist (Z.R.W.) placed ROIs circumscribing the optic nerve on the MD images. To minimize par-tial volume effects, the outermost voxels of the ROIs were automati-cally removed by using the erode function in MatLab (MathWorks, Natick, Massachusetts). Diffusivity values that were spuriously (ie, due to noise) negative were set to 0, and FA values that were
spuri-ously⬎1 were set to 1. This truncation prevents nonphysiologic
re-sults while reducing bias by removing those sections. DTI indices were then averaged across all sections, weighting the section by the number of included voxels. These averaged values entered into the statistical calculations.
Statistics
Statistical calculations were performed in STATA 9.0 (Stata LP, Col-lege Station, Texas). Stability of the quantitative measurements was assessed over the study’s 442-day period by using linear regression. There was no significant change in PRNFL thickness, TMV, visual
acuity scores, EDSS score,20MSSS,21or age (P⬎.05 in all cases).
However, diffusivity values gradually trended upward over time (P⫽
BRAIN
ORIGINAL
.05 for MD,P⫽.01 for储, andP⫽.07 for⬜), or approximately
16%/year for MD, 14% for储, and 22% for⬜. Scatterplots (data not
shown) revealed the relationship to be linear. Therefore, data were preprocessed by adjusting all DTI indices to their expected value at the center date of the study (November 7, 2008), based on the slope of a mixed effects regression by using data from both optic nerves. There
was no significant change in FA over time (P⫽.36), but the FA values
were adjusted similarly for consistency.
Intrarater and Interrater Reliability
A subset of 10 consecutive datasets was analyzed. The same
neuro-ophthalmologist analyzed 10 cases at 2 time points separated by⬎12
weeks; a second rater (J.N.R., MS neurologist) separately analyzed the same 10 cases. DTI indices were averaged across the right and left optic nerves, yielding a single measurement of each DTI index for each case. Bland-Altman analysis compared the results within the same rater as well as between the raters. Intraclass and interclass cor-relation coefficients also were calculated.
To assess differences between MS cases and controls and to quan-tify the correlations between DTI indices and PRNFL thickness, TMV, and visual acuity, mixed effects regression models were used to account for multiple observations (ie, from 2 optic nerves per
per-son), with aPvalue of 0.01 denoting statistical significance.
Results
Cohort characteristics are presented in Table 1. There was no difference in the age distribution between MS and healthy vol-unteer groups (P⫽.11,2test), though there was a higher proportion of women among the healthy volunteers. The overall disability level in our cohort was moderate: median EDSS score⫽3.5 and mean MSSS⫽4.8. In a linear mixed effects model accounting for age and sex, individuals with MS had decreased PRNFL thickness (P⫽.01), decreased TMV (P⫽.004), and worse monocular visual acuity at 1.25% (P⫽
.03) compared with healthy volunteers. Monocular visual acu-ity was normal at 100% (P⫽.41) and 2.5% (P⫽.10) contrast in both groups. None of the optic nerves in the MS cases dem-onstrated enhancement on postcontrast T1-weighted images. Figure 1 shows T2-weighted and DTI index maps for the right (OD, left) and left (OS, right) optic nerves in a healthy volunteer. The optic nerve is clearly visible on all images. It is brighter than the surrounding CSF in the FA and darker in all other maps and on the T2-weighted images. Images from an MS patient with remote left (OS) ON are shown in the right
panels. As is typical in ON, the T2-weighted signal intensity is increased within the affected optic nerve (circle). In the same nerve, FA is lower and all directional diffusivities are higher. These results are consistent with data from prior studies of remote ON.10-16
Statistical Reliability
Reliability was assessed by using Bland-Altman analysis.22 Dif-ferences among values derived by the same rater across both sessions are presented in On-line Table 1 (top). For all DTI indices, the difference between each session was⬍3%, and the 95% CI for the difference overlapped zero. The 95% limits of agreement indicate a threshold for detecting real differences between pairs of values for each index and were⬍10% for FA and approximately 15%–20% for diffusivities. Intraclass
[image:3.594.56.534.59.196.2]cor-Fig 1.Optic nerve DTI indices and T2WI for a healthy volunteer and an individual with MS with previous OS optic neuritis. Note the high signal intensity on the T2WI in the left optic nerve (circle).
Table 1: Cohort characteristics
All MS RRMS SPMS PPMS Healthy
No. participants (no. nerves) 104 (197) 63 (120) 23 (42) 18 (35) 15 (29) No. women (%) 67 (64) 44 (71) 14 (64) 9 (50) 13 (87) Mean age, yr (range) 46 (20–67) 40 (20–62) 54 (45–67) 53 (40–66) 38 (23–56) Mean disease duration, yr (range) 11 (0–44) 8 (0–25) 21 (2–39) 10 (1–44) N.A. Median EDSS Score (range) 3.5 (0–7.5) 2 (0–6.5) 6 (2.5–7) 5.5 (2.5–7.5) N.A. Mean MSSS (SD) 4.8 (2.6) 3.9 (2.5) 5.8 (2.1) 7.0 (1.6) N.A. Prior ON, no. individuals (no. eyes) 35 (38) 27 (29) 7 (8) 1 (1) 0 Mean PRNFL thickness,m (SD) 90 (14) 91 (15) 86 (13) 92 (13) 102 (14) Mean TMV, mm3(SD) 6.5 (0.5) 6.5 (0.4) 6.3 (0.5) 6.6 (0.4) 6.9 (0.4)
Mean monocular 100% contrast visual acuity, % correct (SD) 84 (14) 87 (13) 82 (9) 77 (19) 88 (11) Mean monocular 2.5% contrast visual acuity, % correct (SD) 40 (17) 42 (17) 35 (15) 37 (18) 49 (14) Mean monocular 1.25% contrast visual acuity, % correct (SD) 16 (15) 18 (16) 12 (12) 14 (14) 27 (16)
[image:3.594.302.532.228.500.2]relation coefficients were close to 1 for all indices, indicating excellent agreement.
Bland-Altman analysis of the difference between raters is shown in On-line Table 1 (bottom). As with the intrarater analysis, all the Bland-Altman 95% CIs for the difference over-lapped zero, indicating a nonsignificant deviation. The per-centage of difference between raters was larger, however, up to 9.4% for⬜but⬍5% otherwise. Interclass correlation coeffi-cients were again close to 1. The 95% limits of agreement were slightly larger for the interrater analysis and indicate that dif-ferences on the order of 10% for FA and 20% for the diffusivi-ties can be considered significant.
Cohort Analyses
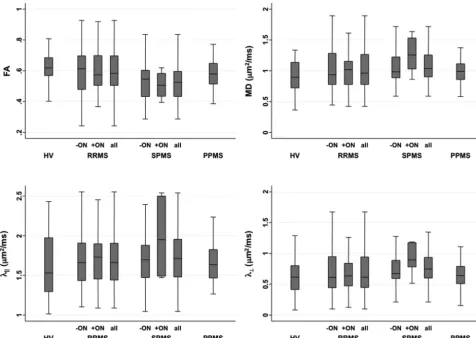
We obtained usable data from 226 of the 238 (95%) optic nerves; analysis of the other 12 nerves was marred by noise. We found no associations between any of the DTI indices and age, sex, or disease duration (P⬎.1), so we made no adjustments for these variables.
Figure 2 and On-line Table 2 present DTI indices for optic nerves with and without previous ON. The lowest FA and highest diffusivities were found in optic nerves with previous ON in patients with SPMS. However, in mixed effect models accounting for age and sex, only lower FA in SPMS compared with healthy volunteers (P ⫽ .001) and participants with RRMS (P⫽.01) was significant. These differences were per-sistent (P⫽.005 andP⫽.03, respectively) even when the analysis was restricted to optic nerves without prior ON,
sug-gesting that damage to the optic nerves in SPMS may reflect diffuse neurodegeneration in addition to prior inflammation. Neither regression analysis in the full MS cohort nor paired
ttests comparing optic nerves in individuals with prior unilat-eral ON revealed differences in DTI indices between optic nerves with and without prior ON. This contrasts with find-ings for measures of retinal structure and low-contrast visual acuity, in which prior ON plays a major role. Specifically, mixed effects regression analysis in eyes with prior ON re-vealed PRNFL thinning (P⬍.001), loss of TMV (P⬍.001), and decreased visual acuity at 2.5% (P⬍.001) and 1.25% (P⫽
.001) contrast (but not at 100% contrast;P⫽.16).
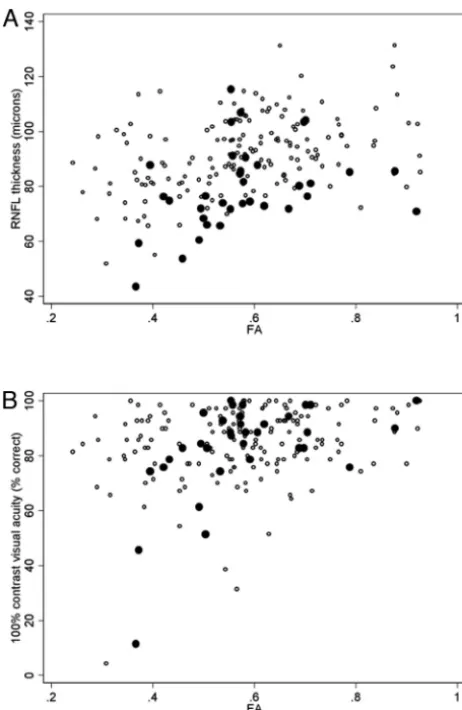
Mixed effects regression analysis assessed the correlation between DTI indices and OCT and visual acuity. The results are shown in Table 2 and reveal moderately strong correla-tions, particularly for PRNFL thickness versus FA (Fig 3A) and
⬜. We found correlation coefficients of similar magnitudes in the individual MS subgroups, but due to lower sample size, the correspondingPvalues were higher.
Table 2 reveals that lower FA and higher diffusivities were associated with PRNFL thinning, TMV loss, and impaired vi-sual acuity. Of the DTI indices, FA generated the strongest correlations and储generated the weakest correlations. Corre-lations with visual acuity scores were generally weaker than with PRNFL thickness and TMV and were strongest at high contrast. These correlations weakened substantially when PRNFL was included as a covariate (On-line Table 3).
Finally, correlations of DTI indices with PRNFL thickness did
[image:4.594.55.532.45.383.2]not strongly depend on prior history of ON. For visual acuity scores, however, stronger correlations were the trend with a known history of ON (eg, FA versus 100% contrast visual acuity; Fig 3B); this trend was also present for TMV. However, even the strongest of these correlations— between 100% contrast visual acuity and FA in optic nerves previously affected by ON—fell after adjusting for PRNFL thickness (On-line Table 3).
Discussion
This study describes the largest reported cohort of healthy and MS optic nerves investigated with DTI. We developed a rapid DTI protocol that was implemented by using standard MR imaging hardware. We show DTI-derived indices that are con-sistent with previous reports.10,13-16,23Contrary to many
pre-vious reports, but not all,12we did not find many significant differences between MS (with or without history of ON) and healthy volunteer optic nerves, though trends were apparent. Consistent with these trends, DTI indices in MS optic nerves correlated with measures of retinal structural damage and vi-sual acuity scores. Here, we interpret these results in the con-text of literature reports and make some concluding remarks about the potential future uses of optic nerve DTI.
Technique and Technical Challenges
Technical challenges abound with DTI of the optic nerve in vivo, and many investigators have attempted to address these challenges by using highly customized sequences with pur-pose-designed surface coils that require long acquisition times and extensive postprocessing.11,13,16,23-25 Those sequences were designed to minimize image distortions and maximize the signal intensity–to-noise ratio, thus providing optimal re-sults. Our goal was to devise a DTI acquisition that could be applied immediately on high-field clinical scanners with stan-dard multichannel, phased array head coils within a clinically acceptable timeframe. We therefore recognized that some im-age and data compromises would be necessary.
Our analysis procedure was straightforward, and initial processing of the images, including tensor and DTI index calculation, followed a standard pipeline previously imple-mented in the brain.26,27As shown in Fig 1, we obtained high-quality images even without explicit B0 correction.15 Rather than by using tractography, we drew ROIs on indi-vidual images and then eroded those ROIs to limit the ef-fects of partial volume averaging. We recognize, however, that given the oblique orientation of the optic nerves rela-tive to the section as well as the small cross-sectional diam-eter of the nerves, we were unable to eliminate partial vol-ume effects.
[image:5.594.52.532.58.137.2]Compared with previous studies, our optic nerve DTI in-dex values were generally in agreement. The SDs were slightly lower than those obtained in major cerebral white matter tracts, including the corpus callosum and optic radiations,28,29 but higher than those measured in the optic tract30; all of these values were recorded in overlapping, but not identical, co-horts. Note, however, that DTI indices can vary across struc-tures and are susceptible to imaging sequence parameters.26 Thus, we believe that our results represent reasonable esti-mates of the true DTI indices within the optic nerves and can be used to compare cohorts and assess relationships with non-DTI measurements.
Table 2: Correlation of MR imaging indices with OCT and visual acuity measurements
FA MD 㛳 ⬜
⫾ ⫺ ⫹ ⫾ ⫺ ⫹ ⫾ ⫺ ⫹ ⫾ ⫺ ⫹
PRNFL thickness 0.41§ 0.45§ 0.35 ⫺0.35‡ ⫺0.39‡ ⫺0.40 ⫺0.29* ⫺0.30* ⫺0.40 ⫺0.39§ ⫺0.42§ ⫺0.43 TMV 0.25‡ 0.27* 0.35 ⫺0.26* ⫺0.28* ⫺0.44 ⫺0.24* ⫺0.20* ⫺0.47 ⫺0.25* ⫺0.27* ⫺0.45* 100% acuity 0.29‡ 0.17 0.54‡ ⫺0.15 ⫺0.09 ⫺0.29 ⫺0.07 ⫺0.07 0.17 ⫺0.20* ⫺0.10 ⫺0.39 2.5% acuity 0.19* 0.13 0.36 ⫺0.18 ⫺0.10 ⫺0.27 ⫺0.13 ⫺0.11 ⫺0.15 ⫺0.18 ⫺0.08 ⫺0.35 1.25% acuity 0.13 0.13 0.10 ⫺0.21 ⫺0.14 0 ⫺0.14 ⫺0.21 0.10 ⫺0.16 ⫺0.20 0.05
Note:—Correlation coefficients derived from mixed effects regression analysis, accounting for correlations between optic nerves in the same individuals. Statistical significance is as follows: *P⬍.01), ‡P⬍.001, and §P⬍.0001). Prior ON status is denoted as follows:⫾, all optic nerves (197 nerves, 104 individuals);⫺, no prior ON (158 nerves, 96 individuals); and⫹, prior ON (35 nerves, 32 individuals).
[image:5.594.53.284.182.537.2]Interpretations
Reduced anisotropy and increased diffusivity are expected in extralesional MS white matter,31-33and these findings do not indicate specific types of tissue damage.34,35Such abnormali-ties also have been found in optic nerves after ON.36Thus, our observation of a trend in the DTI indices in this direction is not surprising. Because we only studied optic nerves that either were not previously affected by ON or in which ON had oc-curred at least 6 weeks earlier, we found no evidence of de-creased parallel diffusivity, as has been observed in the earliest stages of acute ON.16
Contrary to our expectations and those in the literature, we did not observe extensive DTI abnormalities in optic nerves previously affected by ON.10,14It is well established that after an episode of ON, affected optic nerves show a persistent in-crease in T2-weighted signal intensity and are atrophic6,8,37–39; thus, T2-weighted imaging remains the clinical standard for detecting previous ON. Nevertheless, it is clear from our cor-relations that there is a connection with underlying optic nerve pathology. Abnormal DTI indices are associated with PRNFL thinning; macular volume loss; and to a lesser extent, impaired visual acuity at high contrast. This last finding was contrary to our expectations, because low-contrast acuity is known to be particularly affected in patients with MS.3
Portions of the 2 optic nerves merge after their partial de-cussation at the optic chiasm, so a comparison of the results obtained here with our previous measurements in the optic tracts30must be interpreted with caution. In the optic tract study, by using a whole-brain DTI protocol, we found that optic tract MD and⬜were abnormally elevated and that FA was associated with both PRNFL thinning and TMV loss (but not visual acuity). Because the optic nerves and tracts are an-atomically linked, it is not surprising that we found similar results with similar correlation strengths in this study.
Shortcomings
Because of the limited spatial resolution and signal intensity– to-noise ratio of our acquisition, coupled with sections that were oblique rather than perpendicular to the serpentine optic nerves, we reported summary rather than section-wise mea-sures. Thus, data from nerves previously affected by ON show an average of potentially severely damaged segments with data from other, undamaged, or less-affected segments. Moreover, the most damaged segments may have been systematically de-emphasized because we included only data from sections where we could confidently identify and demarcate the optic nerve. We suspect these factors contributed to our lack of sen-sitivity for detecting differences between unaffected and af-fected optic nerves.
Two additional limitations of our study were the lack of high-resolution anatomic data for assessing cross-sectional area and volume as well as the lack of VEP measurements. Both have been shown to correlate with each other and with DTI indices10,16and are useful for a comprehensive analysis of optic nerve damage in MS.
A future study would rectify these shortcomings by1: using unilateral rather than bilateral nerve imaging to minimize obliqueness of the imaging section relative to the nerve axis and2transitioning to non-EPI acquisitions or to a multishot EPI acquisition with phase correction.
Conclusions
We suggest that optic nerve DTI, as a rapid, clinical adjunct to conventional T1- and T2-weighted imaging, is less sensitive to MS-induced tissue damage than OCT and low-contrast visual acuity measurements. Although DTI indices correlated with impaired visual acuity, much of that correlation could be ac-counted for by PRNFL thinning. Our results thus cast some doubt on the ultimate utility of DTI techniques derived from brain acquisitions as a tool in clinical care, at least in the chronic setting.
Acknowledgments
Terri Brawner, Kathleen Kahl, Ivana Kusevic, Stephanie Syc, and Christina Warner provided invaluable assistance with data collection. The CATNAP software was kindly provided by Dr Bennett Landman. P.C.M.v.Z. is a paid lecturer for Philips Healthcare and has technology licensed to Philips Healthcare; this arrangement has been approved by Johns Hopkins University in accordance with its Conflict of Interest policies.
Disclosures: John N. Ratchford:Research Support (including provision of equipment or materials):Novartis, University of California, Los Angeles.Details:I receive salary support in my function as the site PI for 2 clinical trials funded by Novartis and 1 funded by UCLA. Consultant:Sun Pharamceuticals.Details:Consulted on design of a clinical trial.Ownership Interest:Merck & Co, Inc.Details:Stockholder. Scott D. Newsome:Consultant:Biogen Idec. Details:Attended Advisory Board meeting and has given dinner talks. Peter van Zijl: Research Support (including provision of equipment or materials):Philips Healthcare. Details:Grant for research support.Speaker Bureau:Philips Healthcare.Details:Fees for lecturing. Peter A. Calabresi:Research Support (including provision of equipment or materials):Heidelberg Engineering, Biogen-Idec, Teva, Bayer, Serono, Genentech, Vertex, and Novartis.Details:Heidelberg provided an OCT scanner to our clinic as a loaner. The one used in this paper was from their competitor, Zeiss. All other affiliations are for clinical trials in MS or basic science lab projects unrelated to topic of this paper.Consultant: Biogen-Idec, Teva, Novonordisk, Serono, and Novartis.Details:For MS research projects unrelated to this paper.
References
1. Balcer LJ.Optic neuritis.N Engl J Med2006;354:1273– 80
2. Shams PN, Plant GT.Optic neuritis: a review.Int MS J2009;16:82– 89 3. Baier ML, Cutter GR, Rudick RA, et al.Low-contrast letter acuity testing
cap-tures visual dysfunction in patients with multiple sclerosis. Neurology
2005;64:992–95
4. Pulicken M, Gordon-Lipkin E, Balcer LJ, et al.Optical coherence tomography and disease subtype in multiple sclerosis.Neurology2007;69:2085–92 5. Sisto D, Trojano M, Vetrugno M, et al.Subclinical visual involvement in
mul-tiple sclerosis: a study by MRI, VEPs, frequency-doubling perimetry,
stan-dard perimetry, and contrast sensitivity. Invest Ophthalmol Vis Sci
2005;46:1264 – 68
6. Miller DH, Johnson G, McDonald WI, et al.Detection of optic nerve lesions in optic neuritis with magnetic resonance imaging.Lancet1986;1:1490 –91 7. Boorstein JM, Moonis G, Boorstein SM, et al.Optic neuritis: imaging with
magnetization transfer.AJR Am J Roentgenol1997;169:1709 –12
8. Inglese M, Ghezzi A, Bianchi S, et al.Irreversible disability and tissue loss in multiple sclerosis: a conventional and magnetization transfer magnetic reso-nance imaging study of the optic nerves.Arch Neurol2002;59:250 –55 9. Hickman SJ, Toosy AT, Jones SJ, et al.Serial magnetization transfer imaging in
acute optic neuritis.Brain2004;127:692–700
10. Kolbe S, Chapman C, Nguyen T, et al.Optic nerve diffusion changes and
atro-phy jointly predict visual dysfunction after optic neuritis. Neuroimage
2009;45:679 – 86
11. Hickman SJ, Wheeler-Kingshott CA, Jones SJ, et al.Optic nerve diffusion mea-surement from diffusion-weighted imaging in optic neuritis.AJNR Am J Neu-roradiol2005;26:951–56
12. Frohman EM, Dwyer MG, Frohman T, et al.Relationship of optic nerve and brain conventional and non-conventional MRI measures and retinal nerve fiber layer thickness, as assessed by OCT and GDx: a pilot study.J Neurol Sci
2009;282:96 –105
14. Trip SA, Wheeler-Kingshott C, Jones SJ, et al.Optic nerve diffusion tensor imaging in optic neuritis.Neuroimage2006;30:498 –505
15. Techavipoo U, Okai AF, Lackey J, et al.Toward a practical protocol for human optic nerve DTI with EPI geometric distortion correction.J Magn Reson Im-aging2009;30:699 –707
16. Naismith RT, Xu J, Tutlam NT, et al.Disability in optic neuritis correlates with diffusion tensor-derived directional diffusivities.Neurology2009;72:589 –94 17. Pierpaoli C, Basser PJ.Toward a quantitative assessment of diffusion
anisot-ropy.Magn Reson Med1996;36:893–906
18. Landman BA, Farrell JA, Jones CK, et al.Effects of diffusion weighting schemes on the reproducibility of DTI-derived fractional anisotropy, mean diffusivity,
and principal eigenvector measurements at 1.5T. Neuroimage 2007;36:
1123–38
19. Jenkinson M, Bannister P, Brady M, et al.Improved optimization for the ro-bust and accurate linear registration and motion correction of brain images. Neuroimage2002;17:825– 41
20. Kurtzke JF.Rating neurologic impairment in multiple sclerosis: an expanded disability status scale (EDSS).Neurology1983;33:1444 –52
21. Roxburgh RH, Seaman SR, Masterman T, et al.Multiple sclerosis severity score: using disability and disease duration to rate disease severity.Neurology
2005;64:1144 –51
22. Bland JM, Altman DG.Measuring agreement in method comparison studies. Stat Methods Med Res1999;8:135– 60
23. Chabert S, Molko N, Cointepas Y, et al.Diffusion tensor imaging of the human optic nerve using a non-CPMG fast spin echo sequence.J Magn Reson Imaging
2005;22:307–10
24. Sarlls JE, Pierpaoli C.In vivo diffusion tensor imaging of the human optic chiasm at sub-millimeter resolution.Neuroimage2009;47:1244 –51 25. Vinogradov E, Degenhardt A, Smith D, et al.High-resolution anatomic,
diffu-sion tensor, and magnetization transfer magnetic resonance imaging of the optic chiasm at 3T.J Magn Reson Imaging2005;22:302– 06
26. Farrell JA, Landman BA, Jones CK, et al.Effects of signal-to-noise ratio on the accuracy and reproducibility of diffusion tensor imaging-derived fractional anisotropy, mean diffusivity, and principal eigenvector measurements at 1.5 T.J Magn Reson Imaging2007;26:756 – 67
27. Reich DS, Smith SA, Zackowski KM, et al.Multiparametric magnetic reso-nance imaging analysis of the corticospinal tract in multiple sclerosis.Neuro-image2007;38:271–79
28. Ozturk A, Smith S, Gordon-Lipkin E, et al.MRI of the corpus callosum in multiple sclerosis: association with disability.Multiple Sclerosis 2010;16: 166 –77
29. Reich DS, Smith SA, Gordon-Lipkin EM, et al.Damage to the optic radiation in multiple sclerosis is associated with retinal injury and visual disability.Arch Neurol2009;66:998 –1006
30. Dasenbrock HH, Smith SA, Ozturk A, et al.Diffusion tensor imaging of the optic tracts in multiple sclerosis: association with retinal thinning and visual
disability. J Neuroimaging 2010;21:e41–9. http://www.ncbi.nlm.nih.gov/
pubmed/20331501. Accessed April 17, 2010
31. Ciccarelli O, Werring DJ, Wheeler-Kingshott CA, et al.Investigation of MS normal-appearing brain using diffusion tensor MRI with clinical correla-tions.Neurology2001;56:926 –33
32. Roosendaal SD, Geurts JJ, Vrenken H, et al.Regional DTI differences in mul-tiple sclerosis patients.Neuroimage2009;44:1397– 403
33. Ceccarelli A, Rocca M, Falini A, et al.Normal-appearing white and grey matter damage in MS.J Neurol2007;254:513
34. Budde MD, Kim JH, Liang HF, et al.Toward accurate diagnosis of white matter pathology using diffusion tensor imaging.Magn Reson Med2007;57:688 –95 35. Zhang J, Jones M, DeBoy CA, et al.Diffusion tensor magnetic resonance
im-aging of Wallerian degeneration in rat spinal cord after dorsal root axotomy. J Neurosci2009;29:3160 –71
36. Xu J, Sun SW, Naismith RT, et al.Assessing optic nerve pathology with
diffu-sion MRI: from mouse to human.NMR Biomed2008;21:928 – 40
37. Evangelou N, Konz D, Esiri MM, et al.Size-selective neuronal changes in the anterior optic pathways suggest a differential susceptibility to injury in mul-tiple sclerosis.Brain2001;124:1813–20
38. Hickman SJ, Toosy AT, Jones SJ, et al.A serial MRI study following optic nerve mean area in acute optic neuritis.Brain2004;127:2498 –505