https://doi.org/10.5194/amt-12-3825-2019 © Author(s) 2019. This work is distributed under the Creative Commons Attribution 4.0 License.
Method to retrieve cloud condensation nuclei number
concentrations using lidar measurements
Wangshu Tan1, Gang Zhao1, Yingli Yu1, Chengcai Li1, Jian Li2, Ling Kang3, Tong Zhu3, and Chunsheng Zhao1
1Department of Atmospheric and Oceanic Sciences, School of Physics, Peking University, Beijing 100871, China 2State Key Laboratory of Severe Weather & Key Laboratory of Atmospheric Chemistry of CMA, Chinese Academy of
Meteorological Sciences, Beijing 100081, China
3State Key Joint Laboratory of Environmental Simulation and Pollution Control, College of Environmental Science &
Engineering, Peking University, Beijing 100871, China Correspondence:Chengcai Li ([email protected])
Received: 18 January 2019 – Discussion started: 4 February 2019
Revised: 12 June 2019 – Accepted: 24 June 2019 – Published: 12 July 2019
Abstract. Determination of cloud condensation nuclei (CCN) number concentrations at cloud base is important to constrain aerosol–cloud interactions. A new method to re-trieve CCN number concentrations using backscatter and ex-tinction profiles from multiwavelength Raman lidars is pro-posed. The method implements hygroscopic enhancements of backscatter and extinction with relative humidity to de-rive dry backscatter and extinction and humidogram param-eters. Humidogram parameters, Ångström exponents, and li-dar extinction-to-backscatter ratios are then linked to the ra-tio of CCN number concentrara-tion to dry backscatter and ex-tinction coefficient (ARξ). This linkage is established based on the datasets simulated by Mie theory andκ-Köhler theory with in-situ-measured particle size distributions and chem-ical compositions. CCN number concentration can thus be calculated with ARξ and dry backscatter and extinction. An independent theoretical simulated dataset is used to validate this new method and results show that the retrieved CCN number concentrations at supersaturations of 0.07 %, 0.10 %, and 0.20 % are in good agreement with theoretical calculated values. Sensitivity tests indicate that retrieval error in CCN arises mostly from uncertainties in extinction coefficients and RH profiles. The proposed method improves CCN retrieval from lidar measurements and has great potential in deriv-ing scarce long-term CCN data at cloud base, which benefits aerosol–cloud interaction studies.
1 Introduction
Anthropogenic activities have caused an increase in atmo-spheric aerosols, and some of the aerosol particles affect the climate by serving as cloud condensation nuclei (CCN). CCN in clouds can modify cloud-forming processes and cloud microphysical properties (Rosenfeld et al., 2014). Al-though numerous impacts of aerosol–cloud interactions on radiative forcing (McCoy et al., 2017; Zhou et al., 2017), precipitation (Xu et al., 2017; Fan et al., 2018), cloud elec-trification (Wang et al., 2018), and severe weather or hazards (Fu et al., 2017) have been discovered, constraining the rela-tionships between aerosols and clouds is still a big challenge (Seinfeld et al., 2016). Lacking the knowledge of aerosol– cloud interactions limits our ability to estimate climate forc-ing caused by aerosols (Boucher et al., 2013).
however, employing CCN concentrations derived with this strategy limits our exploration of the relationship between CCN concentrations and cloud droplet concentrations in the natural environment. So far, CCN concentrations at cloud base are scarce for aerosol–cloud interaction studies.
Ground-based lidars can continuously provide optical properties of aerosol particles from ground up to cloud base (Mattis et al., 2016; Li et al., 2019), suggesting great poten-tial in deriving CCN concentrations near cloud base. Ghan and Collins (2004) propose a simple method to infer CCN profiles with the combination of surface in situ CCN and aerosol optical measurements. The method is only appli-cable when the boundary layer is well mixed from sur-face to cloud base (Ghan et al., 2006). Mamouri and Ans-mann (2016) investigate the potential of single-wavelength polarization lidar to retrieval CCN for three aerosol types (desert, nondesert continental, and marine). The polariza-tion lidar can separate desert and nondesert by means of the particle linear depolarization ratio. Based on datasets from multiyear AErosol RObotic NETwork (AERONET) obser-vations, valid relationships are found between particle ex-tinction coefficients, and number concentrations of particles with dry radius larger than 50 nm (for nondesert and marine) and 100 nm (for desert). CCN concentrations at different su-persaturations are parameterized with the particle number concentration derived from extinction profiles according to aerosol types. The consideration of the hygroscopicity of am-bient particles is empirical. In addition, single-wavelength li-dar also lacks sufficient information to quantify particle num-ber concentration, which will bring large uncertainty on CCN retrieval.
Multiwavelength Raman lidars (MWRLs) have been in-creasingly used to detect aerosol vertical distributions in cent years. The principle of MWRLs allows independent re-trieval of particle backscatter (β) and extinction coefficients (α), which provides more information about particle micro-physical properties (Müller et al., 2016). The 3β+2αMWRL systems (backscatter coefficients at 355, 532, and 1064 nm and extinction coefficients at 355 and 532 nm) have been widely recommended to derive particle microphysical prop-erties (Burton et al., 2016). Existing approaches to retrieve CCN using MWRLs are based on microphysical inversion techniques. Lv et al. (2018) build a lookup table based on AERONET datasets to retrieve particle number size distribu-tions from backscatter and extinction profiles. Then assumed activation critical diameters according to aerosol type classi-fication together with the retrieved optically equivalent par-ticle size distributions are utilized to calculate CCN concen-trations. It is worth noting that most of the foregoing meth-ods implement crude particle type classification to determine particle hygroscopicity.
There are three major challenges in CCN concentration retrieval with lidars. The first is the conversion of lidar-derived optical properties into particle number concentra-tions. High uncertainties of retrieved particle number
con-centrations could be an important source of CCN retrieval error. The second one is the determination of particle hygro-scopicity in order to evaluate the ability of particles to par-ticipate as CCN. Particle hygroscopicity, which is highly re-lated to chemical composition and the aging/coating effect, is found to cause nonnegligible variations in cloud droplet activation (Hudson, 2007; Zhang et al., 2017). The last is the influence of high relative humidity (RH) near clouds. Aerosol particles are likely to be humidified in the ambient environ-ment, and the consequent changes in optical properties make CCN retrieval more challenging. Most studies working on CCN retrieval with MWRLs mainly focus on deriving par-ticle number concentrations, but seldom commence to solve the issue of hygroscopicity.
In recent years, several aerosol hygroscopic studies based on lidar measurements have been carried out (Fernández et al., 2018; Lv et al., 2017; Bedoya-Velásquez et al., 2018). Backscatter and extinction enhancement factors can be de-rived with lidar measurements and RH profiles. The enhance-ment factor, which is associated with both particle size and hygroscopicity (Kuang et al., 2017), is defined as
fξ(RH, λ)=
ξ (RH, λ) ξ (RHref, λ)
, (1)
wherefξ is the enhancement factor of the optical property ξ (backscatter or extinction) at a specific light wavelengthλ and RH, and RHrefis the reference RH value. Many
stud-ies manifest that lidar-derived enhancement factors are in good agreement with in situ measurements (Wulfmeyer and Feingold, 2000; Pahlow et al., 2006; Fernández et al., 2015; Rosati et al., 2016). Feingold and Morley (2003) demon-strate that the extent of backscatter and extinction enhance-ments hints at the ability of particles to serve as CCN. Tao et al. (2018b) use in-situ-measured light-scattering enhance-ment factors to predictNCCN at 0.07 % supersaturation, and
pollution, which shows strong characteristics of continental aerosols. Mineral dust and marine particles are not consid-ered in this study.
The paper is structured as follows. The filed campaign and in situ measurements are introduced in Sect. 2.1. Section 2.2 briefly introduces the simulations to calculate CCN number concentrations, backscatter, and extinction coefficients from in-situ-measured microphysical and chemical data. The new CCN retrieval method for MWRLs is described in Sect. 3.1 in detail. Sensitivity of the method to the systematic and ran-dom errors of backscatter, extinction, and RH is tested in Sect. 3.2. Results and discussions are given in Sect. 4. Sec-tion 5 summarizes the paper.
2 Data
Since it is not easy to accumulate large datasets of simulta-neous measurements of lidar and aircraft, ground-measured aerosol microphysical and chemical data are used to simu-late lidar-derived backscatter and extinction coefficients and corresponding CCN number concentrations. The simulations are based onκ-Köhler theory and Mie theory. The required datasets include particle number size distribution (PNSD), black carbon (BC) mass concentrations (mBC), mixing state
of BC-containing particles, and size-resolved hygroscopicity. The simulation results are used to establish and validate the new retrieval method.
2.1 Datasets of aerosol microphysical and chemical properties
In-situ-measured aerosol properties were collected from five field campaigns at three different measurement sites in the NCP. The measurement sites are located at Wuqing (39◦230N, 117◦010E, 7.4 m a.s.l.) in Tianjin, Xianghe (39◦450N, 116◦580E, 36 m a.s.l.), and Wangdu (38◦400N, 115◦080E, 51 m a.s.l.) in Hebei Province. The specific lo-cations, topographical information, and pollution status of these measurement sites are shown in Fig. S1 in the Supple-ment. These three sites all lie inside the polluted NCP region and are highly representative of the polluted background (Xu et al., 2011; Bian et al., 2018; Sun et al., 2018). Time periods, measured parameters, and corresponding instruments of the individual campaign are listed in Table 1.
During these field campaigns, except measurement for size-resolved chemical compositions, ambient particles were drawn in through a PM10 inlet (16.67 L min−1), passed
through a silica gel diffusion drier, and then were split into different instruments. All instruments were operated at RH less than 30 %.
The particle number size distributions (PNSDs) were mea-sured with the combination of a twin differential mobility particle sizer (TDMPS, IfT, Leipzig, Germany) or a scanning mobility particle size spectrometer (SMPS) and an
aerody-namic particle sizer (APS, TSI, Inc., Shoreview, MN USA, model 3320 or model 3321). The statistical information about the measured PNSDs is shown in Fig. 1a. The peaks of the PNSDs are at about 100 nm (diameter in log scale), which shows strong characteristics of continental aerosols.
The black carbon (BC) mass concentrations (mBC) were
measured by a multi-angle absorption photometer (MAAP, Thermo, Inc., Waltham, MA USA, model 5012). As for mix-ing states of BC, BC and other non-absorbmix-ing compositions were found to be both externally mixed and core–shell mixed during the campaigns (Ma et al., 2012). The mass fraction of externally mixed BC (rext) is defined to quantify the mixing
states of BC: rext=
mext_BC mBC
, (2)
wheremext_BCis the mass concentration of externally mixed
BC. According to Ma et al. (2012),rextcan be retrieved from
hemispheric backscattering fractions (HBFs) measured by an integrating nephelometer (TSI, Inc., Shoreview, MN USA, model 3563).
Size-resolved chemical compositions all come from cam-paign C2. The size-resolved aerosol sampling was carried out with a 10-stage Berner low-pressure impactor (BLPI). Chem-ical species including inorganic ions (NH+4, Na+, K+, Mg2+,
Ca2+, NO−3, SO2−4 , Cl−), elemental carbon, organic carbon, water-soluble organic carbon, and some other species such as dicarboxylic acids were analyzed from sample substrates. After transforming the ambient wet aerodynamic diameters into dry volume-equivalent diameters, size-resolvedκ dis-tributions were derived from measured size-resolved chem-ical compositions. The chemchem-ical compositions are found to be size dependent during campaign C2, especially the mass fraction of organic matter (Liu et al., 2014). A total of 25 typical size-resolvedκ distributions in the NCP are given in Fig. 1b. The measured size-resolvedκdistributions vary a lot and cover a wide range of aerosol hygroscopicity (Kuang et al., 2018). More details about the measurements can be found in Liu et al. (2014).
2.2 Datasets of CCN number concentrations and lidar-derived optical properties
In-situ-measured aerosol properties mentioned above are uti-lized to calculate CCN number concentrations and particle backscatter and extinction coefficients based on κ-Köhler theory and Mie theory. For each simultaneously measured PNSD,mBC, and rext(16 183 sets of data), simulations are
carried out with every one of the 25 size-resolvedκ distribu-tions.
Table 1.Locations, time periods, parameters, and instruments of five field campaigns.
Location Wuqing Wuqing Xianghe Xianghe Wangdu
Campaign name C1 C2 C3 C4 C5
Time period 7 March to 12 July to 22 July to 9 July to 4 June to
4 April 2009 14 August 2009 30 August 2012 30 August 2013 14 July 2014
PNSD TDMPS+APS TDMPS+APS SMPS+APS TDMPS+APS TDMPS+APS
mBC MAAP MAAP MAAP MAAP MAAP
HBF TSI 3563 TSI 3563 TSI 3563 TSI 3563 TSI 3563
Size-resolved – Substrates sampled – – –
chemical composition by BLPI
Figure 1. (a)Box plot of particle number size distributions (PNSDs) in the datasets from five field campaigns. Each PNSD is normalized by its maximum value at the peak diameter. Green markers “+” represent the mean value of each diameter. The boxes extend from the lower to upper quartile values, with orange lines at the median. The whiskers extend from the box to the minimum–maximum values or extend from the box by 1.5 times the interquartile range. The flyers are not shown in the plot.(b)A total of 25 typical size-resolvedκdistributions. Each dotted line with color represents one size-resolvedκdistribution. The solid black line represents the mean value of the size-resolvedκ distributions.
RH with a single hygroscopic parameterκ:
RH(D)=1+SS(D)=
D3−Ddry3
D3−D3
dry(1−κ)
exp
4σ s/aMw RT ρwD
, (3)
whereDdry is particle dry diameter,σs/a is the surface
ten-sion of the solution–air interface,Mwis the molecular weight
of water,R is the universal gas constant,T is temperature, and ρw is the density of water. For a specific
supersatura-tion, critical activation diameter can be derived with theκ -Köhler equation using size-resolved κ distributions. CCN number concentrations can thereby be calculated by integrat-ing number concentrations of particles larger than the criti-cal diameter. CCN number concentrations at the supersatura-tions of 0.07 %, 0.10 %, 0.20 %, 0.40 %, and 0.80 % are ac-cordingly simulated. The selected supersaturation ratios are widely used in CCN measurements.
Particle backscatter and extinction can be calculated with PNSD,mBC, andrextusing Mie models. Mie theory can solve
light-scattering problems of homogeneous and coated spher-ical particles. Without the consideration of mineral dust,
us-ing the Mie model is quite reasonable because particles are likely to be spherical near clouds where the RH could be rel-atively high. When simulating particle backscatter and co-efficients, PNSD,mBC,rext, and the complex refractive
in-dex are needed. PNSD at different RHs can be calculated with theκ-Köhler equation as well. The refractive indices of BC, the non-absorbing component, and pure water are set to be 1.8+0.54i (Ma et al., 2012), 1.53+10−7i (Wex et al., 2002), and 1.33+10−7i, respectively. Backscatter coef-ficients (355, 532, and 1064 nm) and extinction coefcoef-ficients (355 and 532 nm) at dry conditions and RH from 60 % to 90 % are simulated with an interval of 1 %.
3 Methodology
3.1 Method to retrieve CCN number concentrations using MWRL
3.1.1 Overview
An optically related CCN activation ratio, ARξ, is introduced to bridge the gap between CCN and lidar-derived optical properties. ARξ is the ratio between CCN number concen-tration and backscatter or extinction coefficient, which can be expressed as
ARξ(SS, λ)=
NCCN(SS) ξdry(λ)
=NCCN(SS) Naerosol
·Naerosol ξdry(λ)
, (4)
whereNCCN is the CCN number concentration, andNaerosol
is the total number concentration of aerosol particles. ARξ can be divided into two parts: one is the ratio of CCN to the total particles, which is the origin definition of CCN activa-tion ratio; the other is the ratio of total number concentraactiva-tion to backscatter or extinction at dry conditions. Bulk CCN ac-tivation ratio is related to particle size distribution and hygro-scopicity, and the relationship between particle number con-centration and optical properties is mainly controlled by size distribution. Therefore, ARξ could be quantified with size and hygroscopicity information. The key point of our method is to seek parameters that can indicate size and hygroscopic-ity of particles from lidar measurement and use these param-eters to estimate ARξ. In addition, deriving backscatter and extinction coefficients at dry conditions is also important.
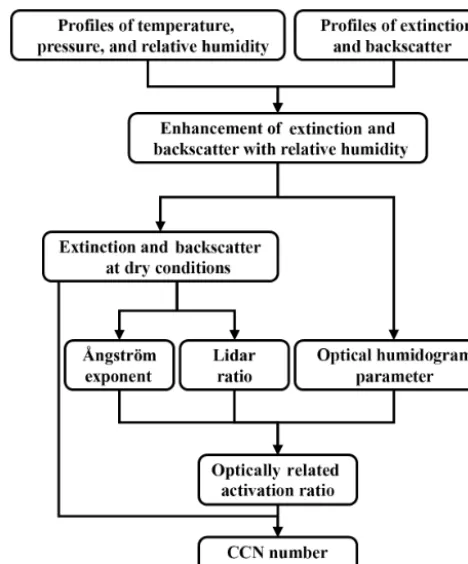
A schematic diagram of the method to retrieve CCN num-ber concentration is shown in Fig. 2.
Firstly, enhancement of backscatter and extinction co-efficients with RH (also called humidogram) is derived from lidar measurements and additional ancillary data (i.e. pressure, temperature, RH profiles). Humidogram parame-ter which can indicate particle hygroscopicity can be fitted from humidograms with parameterization equation. Particle dry backscatter and extinction can also be inferred from the humidograms. This step is applied to all the 3β+2α parame-ters. The approaches to select appropriate hygroscopic layers and fit humidogram parameters, dry backscatter, and dry ex-tinction are described in Sect. 3.1.2.
Then, Ångström exponent (å) and lidar extinction-to-backscatter ratio (lidar ratio, sa) are calculated from in-ferred dry backscatter and extinction coefficients. Extinction-related Ångström exponent (åα) is the most commonly used parameter to reveal information about the predominant size of aerosols. Generally speaking, a smaller åαrepresents more large particles. Similarly, backscatter-related Ångström ex-ponent (åβ) is often employed in lidar analysis (Fernández et al., 2015), and particle backscatter coefficients of different wavelengths have also been proven to have a valid Ångström exponent relationship (Komppula et al., 2012). Ångström ex-ponent of dry backscatter and extinction coefficients (åξ)
be-Figure 2.Schematic diagram of newly proposed method to retrieve cloud condensation nuclei number concentrations using multiwave-length Raman lidar.
tween two wavelengths can be derived using Eq. (5): åξ(λ1, λ2)= −
log(ξ1/ξ2)
log(λ1/λ2)
, (5)
where the subscripts 1 and 2 represent different wavelengths. Another widely used parameter to express aerosol charac-teristics in lidar studies is the particle lidar extinction-to-backscatter ratio (lidar ratio,sa), which is defined as the ratio of extinction coefficient to backscatter coefficient at a spe-cific light wavelength:
sa(λ)= α (λ) β (λ) =
4π
P (π )·ω. (6)
As is shown in Eq. (6), lidar ratio is determined by the scat-tering phase function at 180◦P (π )and the single-scattering albedo ω.P (π ) is mainly influenced by particle size and ωindicates the content and mixing state of light-absorbing components. Lidar ratio is often utilized in aerosol type clas-sification and is proven to be very sensitive to particle sizes (Zhao et al., 2017). The lidar ratio can provide information on particle type and also serve as a proxy for particle hygro-scopicity. Therefore, lidar ratio of dry particles could be a reliable parameter to estimate ARξ.
calcu-lated. Statistical relationships among humidogram parame-ters åξ,sa, and ARξare used in our new method. The estima-tion of ARξis introduced in Sect. 3.1.3 in detail. The imple-mentation of åξ andsais quite similar to the microphysical inversion process for particle size distribution retrieval. Mi-crophysical inversion is a physics-based approach but will bring large uncertainties in retrieving particle number con-centrations. Constraining ARξdirectly with a statistical rela-tionship is a much more simple and straightforward way.
Finally, after ARξ values of backscatter and extinction at different wavelengths are derived, CCN number concentra-tion can be calculated by multiplying ARξby the correspond-ingξdry. The average value of CCN concentrations calculated
by differentξdryis the final retrieval result.
3.1.2 Derivation of humidogram parameters, dry backscatter, and dry extinction from lidar measurement
A constraint needs to be satisfied when quantifying the en-hancements of backscatter and extinction coefficients with li-dar measurements. The selected vertical layers must be well-mixed, so we can guarantee that the variations in particle backscatter and extinction coefficients are caused by differ-ent RH and not by various aerosol types or loads. Atmo-spheric vertical homogeneity is fulfilled if the layer has little variability of virtual potential temperature profile and water vapor mixing ratio profile (Lv et al., 2017). Additional anal-yses can also be considered to evaluate vertical mixing of air masses, such as backward trajectory, horizontal wind veloci-ties at different altitude, or the third moment of the frequency distribution of vertical wind velocities (Bedoya-Velásquez et al., 2018).
Once vertical homogeneity is ensured, physical and chem-ical properties at dry conditions can be assumed to be uni-form in the selected layer, and the number concentrations are proportional to air molecule number density. Accordingly, the relative variations in particle backscatter and extinction coefficients against different RHs can be achieved after nor-malizing the backscatter and extinction coefficients with air molecule number density.
Humidogram parameterization is needed to find a repre-sentative parameter for the relationship between enhance-ment factor and RH. Unlike in-situ-controlled RH measure-ments, there is no such generic reference RH for dry con-ditions for lidar measurements to derive enhancement factor. Inferring backscatter and extinction coefficients at dry condi-tions (ξdry) is also an important issue in CCN retrieval.
There-fore, humidogram parameterization of lidar-derived optical properties should combineξdryandfξ(RH, λ)together.
Many equations to parameterize enhancement factors have been proposed by previous studies (Titos et al., 2016). Two one-parameter equations are selected to test their perfor-mance on estimating ξdry and representing particle
hygro-scopic growth characteristics. The first equation is the most
commonly used one initially introduced by Kasten (1969): ξ (RH, λ)=ξdry(λ)·fξ(RH, λ)=ξdry(λ)
·(1−RH)−γξ(λ), (7)
where the exponentγξ is the fitting parameter and describes the hygroscopic behavior of the particles; the other equa-tion is proposed based on physical understanding by Brock et al. (2016), which has been reported to have better perfor-mance in describing light-scattering enhancement factor than Eq. (7) (Yu et al., 2018):
ξ (RH, λ)=ξdry(λ)·fξ(RH, λ)=ξdry(λ) ·
1+κξ(λ) RH 1−RH
, (8)
whereκξ is the fitting parameter and shows significant cor-relation with bulk hygroscopic parameter κ (Kuang et al., 2017). Here, Eqs. (7) and (8) are denoted as theγ equation andκ equation, respectively. With given backscatter and ex-tinction at different RHs,ξdry andγξ orκξ can be fitted si-multaneously by means of least squares.
Comparisons between the performances of theγ equation andκequation on inferring backscatter and extinction at dry conditions are carried out to select a better parameterization. Four RH ranges (60 %–90 %, 60 %–70 %, 70 %–80 %, and 80 %–90 %) are selected. The fittedξdryvalues are compared
with theξdrycalculated by the Mie model. The slopes of
lin-ear regressions, determination coefficients (R2), and relative errors are listed in Table 2. Apparently, theκ equation has a better performance than theγ equation for all RH ranges. In-ferringξdrywith theγ equation will underestimate by about
10 %–30 %. It is consistent with the finding of Haarig et al. (2017) that the γ equation does not hold for RH lower than 40 %. The bias of backscatter is found to be larger than the bias of extinction.
The RH range of humidogram equations also influences the fitting results. Table 2 shows the fittedξdry values have
larger bias when the value of RH increases. The fitted humi-dogram parametersγξ andκξ from different RH ranges are compared to each other, and the results are displayed in Ta-ble 3. Parameterization equations are not always perfect for the whole RH range, so humidogram parameters fitted with various RH ranges can be different. If γξ andκξ are used to represent hygroscopic behavior of particles, more careful attention should be paid to the RH ranges.
Based on the comparisons above, Eq. (8) (κ equation) is selected as our humidogram equation to deriveξdry andκξ. The RH range for parameter fitting used is fixed to 60 %– 90 % in the following method.
3.1.3 Estimation of ARξ
Table 2.Slopes of linear regressions, determination coefficients (R2), and relative errors (RE) between Mie-model-simulated particle dry backscatter or extinction coefficients and those inferred from humidogram functions. A total of 404 575 pairs of the simulations from the in situ dataset are used. The REs are given in the form of mean value±1 standard deviation.
RH (%) ξ γ equation κequation
Slope R2 RE (%) Slope R2 RE (%)
60–90 α355,dry 0.850 0.998 −16.2±2.1 1.045 0.998 3.4±2.4
α532,dry 0.820 0.998 −19.2±2.0 1.017 0.999 0.5±1.8
β355,dry 0.784 0.960 −20.8±7.2 0.817 0.971 −9.6±7.5
β532,dry 0.812 0.972 −22.7±7.6 0.874 0.988 −11.7±5.6
β1064,dry 0.878 0.986 −12.9±5.7 0.935 0.994 −5.4±4.4 60–70 α355,dry 0.913 1.000 −9.2±1.1 1.016 1.000 1.1±0.9
α532,dry 0.900 0.999 −10.4±1.3 1.005 1.000 0.0±0.7
β355,dry 0.939 0.989 −9.1±6.0 0.906 0.991 −5.6±4.9
β532,dry 0.939 0.990 −9.9±5.6 0.939 0.996 −6.4±3.9
β1064,dry 0.966 0.997 −3.9±2.9 0.974 0.999 −1.9±2.0 70–80 α355,dry 0.852 0.999 −15.8±1.9 1.037 0.999 2.7±2.1
α532,dry 0.827 0.998 −18.3±1.9 1.012 0.999 0.3±1.5
β355,dry 0.799 0.950 −20.5±8.9 0.818 0.968 −10.5±8.1
β532,dry 0.833 0.966 −21.4±9.0 0.880 0.986 −11.7±6.6 β1064,dry 0.898 0.987 −10.8±5.7 0.942 0.995 −4.6±4.1 80–90 α355,dry 0.756 0.922 −26.5±3.8 1.110 0.991 8.5±5.5
α532,dry 0.702 0.994 −31.9±3.1 1.047 0.995 1.9±4.2
β355,dry 0.547 0.848 −37.0±11.1 0.695 0.892 −13.4±14.1 β532,dry 0.593 0.925 −42.1±8.7 0.775 0.961 −19.2±8.7
β1064,dry 0.702 0.934 −30.4±10.3 0.867 0.971 −11.5±8.8
Table 3.Slopes of linear regressions and determination coefficients (R2) betweenγξandκξfitted from RH range 60 %–90 % and those fitted from limited RH ranges (60 %–70 %, 70 %–80 %, and 80 %– 90 %).
RH (%) ξ γξ κξ
Slope R2 Slope R2
60–70 α355 0.992 0.958 1.113 0.955
α532 0.969 0.978 1.007 0.977
β355 1.019 0.814 1.213 0.819
β532 0.790 0.797 0.891 0.799
β1064 0.806 0.834 1.011 0.812
70–80 α355 1.021 0.996 1.045 0.995
α532 1.015 0.997 1.014 0.997
β355 1.115 0.968 1.195 0.958
β532 1.078 0.973 1.128 0.969
β1064 0.999 0.979 1.034 0.972
80–90 α355 0.941 0.939 0.847 0.934
α532 0.957 0.969 0.969 0.967
β355 0.741 0.679 0.684 0.626
β532 0.970 0.851 1.002 0.827
β1064 1.090 0.816 1.036 0.818
and lidar ratios are not independent of each other (any pa-rameter can be calculated from other papa-rameters), we reduce the number of parameters to a sufficient number to represent all the information. The selected nine parameters are listed in Table 4. One possible way to seek the relationship between the nine parameters and ARξ is to build a lookup table, but too many input parameters would make the lookup table too large to build and operate.
Table 4.Lidar-derived parameters for predicting optically related CCN activation ratio ARξ.
Parameter Description
κα355 Fitted parameter of extinction humidogram at 355 nm inκequation form
κα532 Fitted parameter of extinction humidogram at 532 nm inκequation form
κβ355 Fitted parameter of backscatter humidogram at 355 nm inκequation form
κβ532 Fitted parameter of backscatter humidogram at 532 nm inκequation form
κβ1064 Fitted parameter of backscatter humidogram at 1064 nm inκequation form sa355 Particle dry lidar extinction-to-backscatter ratio at 355 nm
sa532 Particle dry lidar extinction-to-backscatter ratio at 532 nm
åα355&532 Ångström exponent of particle dry extinction coefficients between 355 and 532 nm åβ532&1064 Ångström exponent of particle dry backscatter coefficients between 532 and 1064 nm
RF model, and the ARξ values of 3β+2α are the output parameters.
Some tuning parameters required by the RF model need to be specified by users. Experiments are made to determine the optimal values of the tuning parameters. Experiment results are showed in Fig. S7 in the Supplement and the detailed settings of the RF model are listed in Table S2 in the Supple-ment. In this case, the results are rather insensitive to the tun-ing parameters. Data simulated with datasets measured from campaigns C1–C4 are utilized as the training data, and those from C5 are used as test data.
3.2 Sensitivity test
Both systematic and random errors exist in lidar-retrieved backscatter and extinction coefficients (Mattis et al., 2016). Systematic errors in backscatter and extinction can come from instrumentation setup, data processing method, and re-trieval algorithm. Sensitivity test is carried out to test the impact of systematic errors of backscatter and extinction on CCN retrieval. Errors in backscatter or extinction influence the value of Ångström exponents and lidar ratios. The errors of individual backscatter or extinction are considered to be independent, though systematic errors of different parame-ters are related. The systematic errors are given in the range of −20 % to 20 % with an interval of 2 %. In each test, the error is only applied to one parameter, and other parameters are error-free.
RH is another crucial factor in this new method to retrieve CCN. Profiles of RH derived by remote-sensing techniques are also influenced by errors. At present, RH profiles are usually obtained with the combination of temperature from microwave radiometer and water vapor mixing ratio from MWRL. Both measurements can cause systematic and ran-dom errors in RH (Bedoya-Velásquez et al., 2018). Errors in RH will influence the values ofξdryandκξ, which in turn in-fluence all the nine input parameters. Systematic errors rang-ing from −10 % to 10 % in intervals of 1 % are considered for RH.
Random errors in observations can be reduced by temporal averaging but cannot be eliminated. The influence of random
errors in backscatter, extinction, and RH on CCN retrieval are investigated with the Monte Carlo method. Three sets of sen-sitivity tests for random errors are conducted. Errors obeying Gaussian distribution are generated randomly with the mean value of zero. The standard deviation of Gaussian distribu-tion is fixed at 10 % for backscatter and extincdistribu-tion, and the standard deviation of RH is set to be 5 %, 10 %, and 20 % for each test. The procedure is repeated 2000 times. All the 80 575 sets of data from campaign C5 are used for sensitivity test.
4 Results and discussions
4.1 Supersaturations for lidar CCN retrieval
CCN number concentrations are related to supersaturations. Critical diameters of each supersaturations calculated with 25 size-resolvedκdistributions are shown in Fig. 3a. Most of the critical diameters at a supersaturation of 0.07 % are larger than 200 nm, while critical diameters at a supersaturation of 0.80 % are around 50 nm. Suitable supersaturations for lidar CCN retrieval depend on the ability of lidar optical properties to provide information about number and hygroscopicity of CCN-related sizes.
Size cumulative contributions of particle number of all measured particle size distribution and corresponding cal-culated backscatter and extinction at dry conditions are also displayed in Fig. 3a. As the cumulative contributions of parti-cle number suggest, partiparti-cles with diameter less than 100 nm dominate particle number concentrations (over 65 %). How-ever, most backscatter and extinction come from particles larger than 200 nm (around 90 %) and almost 100 % come from particles larger than 100 nm. If critical diameter is small, dry backscatter and extinction are insensitive to par-ticle diameters that contribute to most CCN concentrations.
Figure 3. (a) Cumulative contributions (accumulate from large particle size to small particle size) of particle number concentra-tions (measured), dry particle backscatter coefficients (simulated), and dry particle extinction coefficients (simulated). The solid and dashed lines represent the median values of five field campaigns, and the shadows cover from the lower to upper quartile values. The box plots in brown contain statistical information about critical di-ameter of each supersaturation condition (rightyaxis). The boxes extend from the lower to upper quartile values, with lines at the me-dian. The whiskers extend from the box to the minimum–maximum values or extend from the box by 1.5 times the interquartile range. The markers “o” are the flyers.(b) Normalized size-resolved en-hancement contributions when relative humidity increases from 60 % to 90 %, which are theoretically calculated by the mean parti-cle number size distribution, the mean black carbon mass concentra-tion (4.717 µg m−3), the mean mass ratio of externally mixed black carbon (0.664 %), and the mean size-resolvedκdistribution.
represents the proportion of each size to the enhancement in backscatter or extinction. As is shown in Fig. 3b, the con-tributions of the extinction enhancements are concentrated in the diameters within 200 to 700 nm, and extinction en-hancement at 355 nm is related to smaller particles than that at 532 nm. Similar to particle number, particles with diame-ters smaller than 100 nm contribute little to the enhancements of both backscatter and extinction.
Figure 3b also shows that differentκξ values are sensitive to the hygroscopicity of different size. Size-dependent hy-groscopicity is important to estimate CCN rather than bulk hygroscopicity information, especially for different supersat-uration conditions. One humidogram may indicate the bulk hygroscopicity, but it is the hygroscopicity of small particles that influences CCN number concentrations most. Usingκξ of all the 3β+2αvalues can provide some information about the hygroscopicity of small particles.
Comparing sensitive size of optical properties and criti-cal diameters at different supersaturations, 3β+2αMWRL
systems have potential to retrieve CCN number concentra-tions at supersaturaconcentra-tions smaller than 0.20 %. It is not rec-ommended to estimate CCN concentrations using lidar data at supersaturations larger than 0.40 %.
4.2 CCN number concentrations retrieved with error-free data
With error-free data as input, the model-predicted extinction-related activation ratio at 532 nm (ARα532) and the retrieved
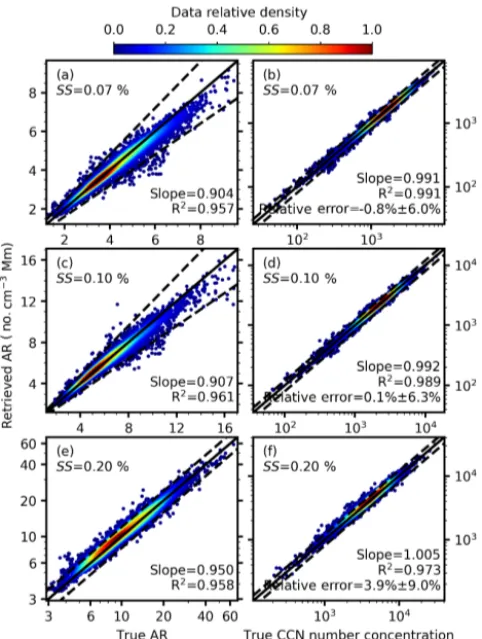
CCN number concentrations at supersaturations of 0.07 %, 0.10 %, and 0.20 % are compared to the theoretical calcu-lated values. A total of 80 575 pairs of data calcucalcu-lated from campaign C5 are used for verification. The retrieval results are displayed in Fig. 4. The values ARα532 at a specific
su-persaturation are distributed in a wide range and can span over an order of magnitude, indicating that the relationship between CCN and optical parameters is very complex. Ac-cording to Fig. 4, all data points are distributed almost evenly on both sides of the 1:1 line and the relative errors of most points are within 20 %. The determination coefficients (R2) of CCN concentrations are all larger than 0.97, and the results do not show obvious systematic deviations. The retrieval er-rors are found to grow with supersaturation. Retrieval results for higher supersaturations (i.e. 0.40 % and 0.80 %) are dis-played in Fig. S8 in the Supplement. There are larger errors for supersaturations of 0.40 % and 0.80 %. Only 47.76 % of the retrieved CCN number concentrations at a supersatura-tion of 0.80 % have relative errors less than 20 %. The results demonstrate again that lidars may not be sufficient enough to retrieve CCN number concentrations at supersaturations lager than 0.40 %.
4.3 Importance of size-related and hygroscopicity-related parameters
RF models can evaluate the importance of features (input pa-rameters) by calculating the mean decrease impurity (MDI) for each feature among all the trees in the forest. The MDIs and corresponding standard deviations of each parameter at different supersaturations are shown in Fig. 5. Importance of the nine input parameters varies with supersaturations. For 0.07 % and 0.10 %,κα355 andκβ1064 are the two most
important parameters, showing the impact of hygroscopic-ity on the relationship between CCN and optical proper-ties. For 0.20 %, åα355&532becomes much more important.
Among the nine input parameters,κξ values are denoted as hygroscopicity-related parameters, and åξvalues are denoted as size-related parameters. In particular,sa can be regarded as a parameter related to both size and hygroscopicity. As is shown in Fig. 5, hygroscopicity-related parameters, espe-ciallyκα355,κβ1064, andsa532, play crucial roles in retrieving
con-Figure 4. Comparison of the theoretical calculated extinction-related CCN activation ratio at 532 nm (true AR) and the model-predicted extinction-related CCN activation ratios at 532 nm (re-trieved AR) at supersaturations of (a) 0.07 %, (c) 0.10 %, and (e) 0.20 %, and comparison of the theoretical calculated CCN number concentrations (true CCN number concentration) and the retrieved CCN number concentrations at supersaturations of (b)0.07 %,(d)0.10 %, and(f)0.20 %. A total of 80 575 pairs of data calculated from campaign C5 are used. The solid line is the 1:1 line, and the dashed lines are 20 % relative difference lines. Colors represent the relative density of the data points normalized by the maximum data density of each panel. The relative error shown in the figure is mean value±1 standard deviation.
centrations retrieved with and without κξ are compared to show the importance ofκξ. When retrieving CCN withoutκξ, the RF model is also trained with datasets from campaigns C1–C4, but the input data only contain Ångström exponents and lidar ratios. The retrieved CCN concentrations are all compared with datasets from campaign C5, and the results are listed in Table 5. R2 of retrieved CCN decreases from 0.991 to 0.887 for supersaturations of 0.07 %, from 0.992 to 0.857 for 0.10 %, and from 0.973 to 0.785 for 0.20 %. Re-trieval errors also increase overwhelmingly, and there are sig-nificant positive systematic biases. Parameters which are de-rived from backscatter and extinction enhancements,κξ, are indispensable parameters in CCN retrieval.
Figure 5.Importance of each feature (input parameter) output by the random forest model for predicting optically related CCN ac-tivation ratios at supersaturations of(a) 0.07 %, (b) 0.10 %, and (c)0.20 %. The values of feature importance indicate the decrease in impurity for each feature. The length of the bar represents the mean values among all trees and the error bars give the standard deviations.
4.4 Impact of systematic and random error on CCN retrieval
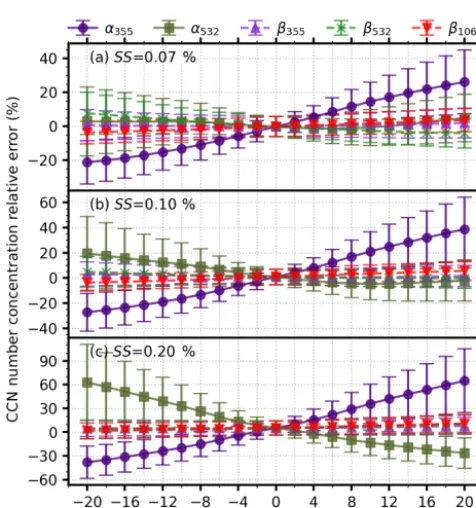
Figure 6 shows the relative errors of CCN retrieved with systematic errors in backscatter and extinction. Errors of re-trieved CCN increase as errors of backscatter and extinction increase, and higher supersaturations are more affected by errors of optical parameters. Errors in extinction coefficients at 355 nm (α355) influence the retrieval results most. On
av-erage, a positive relative error of 20 % in α355 will cause
about a 20 % overestimate in CCN number concentrations for supersaturation of 0.07 %, about a 40 % overestimate for 0.10 %, and about a 60 % overestimate for 0.20 %. A nega-tive error of 20 % inα355 will underestimate CCN
concen-trations, and the degree of impact is slightly smaller than the positive error. Errors in extinction coefficient at 532 nm (α532) and at 355 nm have the opposite effect on retrieval
er-ror. Errors inα532 do not show a significant impact at
su-persaturations of 0.07 % and 0.10 %, but an overwhelming effect is found at supersaturations of 0.20 %. It is interest-ing to note that the errors in backscatter coefficients do not affect the results much. However, in practical applications of MWRLs, the errors in extinction are always much larger than the errors of backscatter. If the error of retrieved CCN con-centrations needs to be limited to 20 % at a supersaturation of 0.20 %, the errors of retrieved extinction coefficients should to be controlled within 5 %.
Table 5.Slopes of linear regressions, determination coefficients (R2), and relative errors (RE) between theoretical calculated CCN number concentrations and CCN number concentrations retrieved with and withoutκξ as input parameter. The relative errors are given in the form of mean value±1 standard deviation.
Supersaturation ratio Withκξ Withoutκξ
Slope R2 RE (%) Slope R2 RE (%)
0.07 % 0.991 0.991 −0.8±6.0 0.877 0.866 4.6±26.1 0.10 % 0.992 0.989 0.1±6.3 0.857 0.837 5.9±26.7 0.20 % 1.005 0.973 3.9±9.0 0.860 0.785 11.9±28.1
Figure 6.Relative errors in retrieved CCN number concentrations at supersaturations of(a)0.07 %,(b)0.10 %, and(c)0.20 % as a func-tion of systematic errors in backscatter or extincfunc-tion. The markers are the mean values, and the error bars denote the standard devia-tions.
of retrieval relative error increase with RH error, and the ex-treme value of the mean retrieval error appears at the RH error of 5 %. Underestimating RH will cause much more er-rors than overestimation. Great care should be paid to RH profiles if enhancements of backscatter and extinction with RH are utilized.
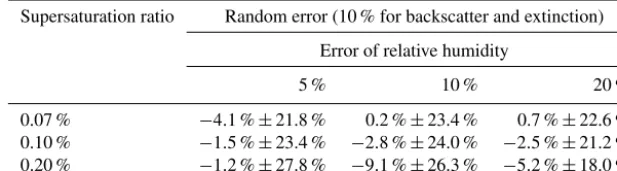
The relative error of retrieved CCN with random errors is presented in Table 6. The retrieval error does not change sig-nificantly as the random error of RH increases. For all the conditions that are tested, the mean values of relative error are below or near zero, and the standard deviations are within 18 %–28 %. The impact of random errors on the nine input parameters is also evaluated and is shown in Fig. 8. Random errors will underestimate κξ by 30 %–35 % on average for 5 % RH error, 80 %–85 % for 10 % RH error, and 90 %–95 %
Figure 7.Relative errors in retrieved CCN number concentrations at supersaturations of 0.07 %, 0.10 %, and 0.20 % as a function of systematic errors in relative humidity. The markers are the mean values, and the error bars denote the standard deviations.
Figure 8.Relative errors in fitted and calculated parameters with 10 % random errors for backscatter and extinction and 5 % (blue), 10 % (orange), and 20 % (green) random error for relative humidity. The dots are the median values, and the error bars denote the 5th and 95th percentiles. The dashed red line marks the position of zero.
for 20 % RH error.sa355,sa532, and åβ532&1064are likely to
be overestimated. As the random error of RH grows, the ab-solute relative error of input parameters will become larger.
5 Summary
Table 6.Mean and 1 standard deviation (SD) values (mean±SD) of relative errors in retrieved CCN number concentrations at different supersaturations with different random error conditions. The uncertainty of backscatter and extinction coefficients of all the tests is 10 %, and the uncertainties of relative humidity are 5 %, 10 %, and 20 %.
Supersaturation ratio Random error (10 % for backscatter and extinction)
Error of relative humidity
5 % 10 % 20 %
0.07 % −4.1 %±21.8 % 0.2 %±23.4 % 0.7 %±22.6 % 0.10 % −1.5 %±23.4 % −2.8 %±24.0 % −2.5 %±21.2 % 0.20 % −1.2 %±27.8 % −9.1 %±26.3 % −5.2 %±18.0 %
from MWRL measurements is proposed. Enhancements of backscatter and extinction coefficients with RH are imple-mented to derive dry backscatter and extinction ξdry and
humidogram parameter κξ. The ratio of CCN number con-centration to dry backscatter or extinction coefficient ARξ, which is estimated byκξ, Ångström exponents, and lidar ra-tios, is introduced to retrieve CCN number concentrations.
The method is established and verified by theoretical sim-ulations using Mie theory and κ-Köhler theory with in-situ-measured particle size distributions, mixing states, and chemical compositions. The values of ARξare found to have large variations due to different size distributions and hygro-scopicity. Theoretical analyses show that optical properties provided by current 3β+2αMWRL systems basically con-tain size distribution and hygroscopicity information of par-ticles with diameters larger than 100 nm, which only fits the critical diameters for supersaturations lower than 0.20 %. Ac-cordingly, CCN number concentrations at supersaturations of 0.07 %, 0.10 %, and 0.20 % are retrieved. The performance of the new method is evaluated with error-free data, and CCN number concentrations at all three supersaturations are in good agreement with theoretical calculated values.
Sensitivity tests are carried out to show the influence of systematic and random errors of lidar-derived optical proper-ties and auxiliary RH profiles on CCN retrieval. Systematic errors in extinction coefficients and RH are found to have a large impact on error in retrieved CCN. Parameters fitted from backscatter and extinction enhancements (i.e.ξdryand κξ) are significantly influenced by RH. The uncertainty of RH profiles derived by remote-sensing techniques is a major problem in CCN retrieval. Optical properties near cloud base from lidar measurements are always influenced by high RH. Thus, transforming backscatter and extinction coefficients at ambient RH to dry conditions is a must for CCN retrieval, and accurate RH profiles are in high demand.
The importance of humidogram parametersκξ is demon-strated by comparing the error of CCN concentration re-trieved with and without κξ. Neglecting hygroscopicity in-formation contained in backscatter and extinction enhance-ments will bring huge errors to CCN retrieval by lidars. The performance of two parameterization schemes for
backscat-ter and extinction humidograms is evaluated. Theκ equation shows better performance on inferring dry backscatter and extinction than theγ equation. Theκ equation, therefore, is recommended to describe the hygroscopic behaviors of the backscatter and extinction coefficients from lidar measure-ments. The fitted hygroscopic parameters are found to be sen-sitive to fitting RH range when the RH range is limited and relatively high (between 60 % and 90 %). This is an extreme essential problem for current research for aerosol hygroscop-icity with lidar measurements. Great care should be paid to the RH range when evaluating the hygroscopic growth of the lidar-related optical properties.
It should be noted that the theoretical analyses in this pa-per are based on datasets of continental aerosols, and the im-plementation of Mie theory also limits the scope of the re-sults. The results can be applied in the North China Plain but are not fit for sea salt and mineral dust. Studies with datasets of other aerosol types should be carried out in the fu-ture. Although the applicability of this new method is limited by large uncertainties in RH profiles, comparison between real measured MWRL data and airborne in situ measurement should also be conducted.
This work furthers our understanding of the relationship between CCN and aerosol optical properties and providing an optional way to retrieve CCN number concentration pro-files from lidar measurements. The newly proposed method has the potential to provide long-term CCN at cloud base for aerosol–cloud interaction studies.
Data availability. All of the datasets from field measurement and the corresponding simulated datasets can be obtained from the repository with the doi https://doi.org/10.5281/zenodo.3255086 (Tan et al., 2019).
Author contributions. CZ and CL determined the main goal of this study. WT and GZ designed the methods. WT carried them out and prepared the paper with contributions from all co-authors.
Competing interests. The authors declare that they have no conflict of interest.
Financial support. This research has been supported by the Na-tional Key R&D Program of China (grant nos. 2016YFC0202004 and 2017YFC0209904) and the National Natural Science Founda-tion of China (grant nos. 41375008, 41590872, 9154400001, and 41527807).
Review statement. This paper was edited by Ulla Wandinger and reviewed by two anonymous referees.
References
Bedoya-Velásquez, A. E., Navas-Guzmán, F., Granados-Muñoz, M. J., Titos, G., Román, R., Casquero-Vera, J. A., Ortiz-Amezcua, P., Benavent-Oltra, J. A., de Arruda Moreira, G., Montilla-Rosero, E., Hoyos, C. D., Artiñano, B., Coz, E., Olmo-Reyes, F. J., Alados-Arboledas, L., and Guerrero-Rascado, J. L.: Hy-groscopic growth study in the framework of EARLINET dur-ing the SLOPE I campaign: synergy of remote sensdur-ing and in situ instrumentation, Atmos. Chem. Phys., 18, 7001–7017, https://doi.org/10.5194/acp-18-7001-2018, 2018.
Bian, Y., Zhao, C., Xu, W., Kuang, Y., Tao, J., Wei, W., Ma, N., Zhao, G., Lian, S., Tan, W., and Barnes, J. E.: A novel method to retrieve the nocturnal boundary layer structure based on CCD laser aerosol detection system measurements, Remote Sens. Environ., 211, 38–47, https://doi.org/10.1016/j.rse.2018.04.007, 2018.
Bohren, C. F. and Huffman, D. R.: Absorption and Scattering by an Arbitrary Particle, in: Absorption and Scattering of Light by Small Particles, Wiley-VCH Verlag GmbH, Weinheim, 57–81, 2007.
Boucher, O., Randall, D., Artaxo, P., Bretherton, C., Feingold, G., Forster, P., Kerminen, V.-M., Kondo, Y., Liao, H., Lohmann, U., Rasch, P., Satheesh, S. K., Sherwood, S., Stevens, B., and Zhang, X. Y.: Clouds and Aerosols, in: Climate Change 2013: The Phys-ical Science Basis, Contribution of Working Group I to the Fifth Assessment Report of the Intergovernmental Panel on Climate Change, edited by: Stocker, T. F., Qin, D., Plattner, G.-K., Tig-nor, M., Allen, S. K., Boschung, J., Nauels, A., Xia, Y., Bex, V., and Midgley, P. M., Cambridge University Press, Cambridge, United Kingdom and New York, NY, USA, 571–658, 2013. Breiman, L.: Random Forests, Mach. Learn., 45, 5–32,
https://doi.org/10.1023/a:1010933404324, 2001.
Brock, C. A., Wagner, N. L., Anderson, B. E., Attwood, A. R., Beyersdorf, A., Campuzano-Jost, P., Carlton, A. G., Day, D. A., Diskin, G. S., Gordon, T. D., Jimenez, J. L., Lack, D. A., Liao, J., Markovic, M. Z., Middlebrook, A. M., Ng, N. L., Perring, A. E., Richardson, M. S., Schwarz, J. P., Washenfelder, R. A., Welti, A., Xu, L., Ziemba, L. D., and Murphy, D. M.: Aerosol
optical properties in the southeastern United States in summer – Part 1: Hygroscopic growth, Atmos. Chem. Phys., 16, 4987– 5007, https://doi.org/10.5194/acp-16-4987-2016, 2016. Burton, S. P., Chemyakin, E., Liu, X., Knobelspiesse, K., Stamnes,
S., Sawamura, P., Moore, R. H., Hostetler, C. A., and Ferrare, R. A.: Information content and sensitivity of the 3β+2αlidar measurement system for aerosol microphysical retrievals, At-mos. Meas. Tech., 9, 5555–5574, https://doi.org/10.5194/amt-9-5555-2016, 2016.
Fan, J., Rosenfeld, D., Zhang, Y., Giangrande, S. E., Li, Z., Machado, L. A. T., Martin, S. T., Yang, Y., Wang, J., Artaxo, P., Barbosa, H. M. J., Braga, R. C., Comstock, J. M., Feng, Z., Gao, W., Gomes, H. B., Mei, F., Pöhlker, C., Pöhlker, M. L., Pöschl, U., and de Souza, R. A. F.: Substantial convection and precipi-tation enhancements by ultrafine aerosol particles, Science, 359, 411–418, https://doi.org/10.1126/science.aan8461, 2018. Feingold, G. and Morley, B.: Aerosol hygroscopic
proper-ties as measured by lidar and comparison with in situ measurements, J. Geophys. Res.-Atmos., 108, 4327, https://doi.org/10.1029/2002JD002842, 2003.
Fernández, A. J., Apituley, A., Veselovskii, I., Suvorina, A., Henzing, J., Pujadas, M., and Artíñano, B.: Study of aerosol hygroscopic events over the Cabauw experimental site for atmospheric research (CESAR) using the multi-wavelength Raman lidar Caeli, Atmos. Environ., 120, 484–498, https://doi.org/10.1016/j.atmosenv.2015.08.079, 2015.
Fernández, A. J., Molero, F., Becerril-Valle, M., Coz, E., Sal-vador, P., Artíñano, B., and Pujadas, M.: Application of re-mote sensing techniques to study aerosol water vapour up-take in a real atmosphere, Atmos. Res., 202, 112–127, https://doi.org/10.1016/j.atmosres.2017.11.020, 2018.
Fu, S., Deng, X., Li, Z., and Xue, H.: Radiative effect of black car-bon aerosol on a squall line case in North China, Atmos. Res., 197, 407–414, https://doi.org/10.1016/j.atmosres.2017.07.026, 2017.
Ghan, S. J. and Collins, D. R.: Use of In Situ Data to Test a Raman Lidar–Based Cloud Condensation Nuclei Remote Sensing Method, J. Atmos. Ocean. Tech., 21, 387–394, https://doi.org/10.1175/1520-0426(2004)021<0387:uoisdt>2.0.co;2, 2004.
Ghan, S. J., Rissman, T. A., Elleman, R., Ferrare, R. A., Turner, D., Flynn, C., Wang, J., Ogren, J., Hudson, J., Jonsson, H. H., Van-Reken, T., Flagan, R. C., and Seinfeld, J. H.: Use of in situ cloud condensation nuclei, extinction, and aerosol size distribution measurements to test a method for retrieving cloud condensation nuclei profiles from surface measurements, J. Geophys. Res.-Atmos., 111, D05S10, https://doi.org/10.1029/2004jd005752, 2006.
Grange, S. K., Carslaw, D. C., Lewis, A. C., Boleti, E., and Hueglin, C.: Random forest meteorological normalisation mod-els for Swiss PM10 trend analysis, Atmos. Chem. Phys., 18, 6223–6239, https://doi.org/10.5194/acp-18-6223-2018, 2018. Haarig, M., Ansmann, A., Gasteiger, J., Kandler, K., Althausen, D.,
Hudson, J. G.: Variability of the relationship between particle size and cloud-nucleating ability, Geophys. Res. Lett., 34, L08801, https://doi.org/10.1029/2006GL028850, 2007.
Immitzer, M., Atzberger, C., and Koukal, T.: Tree Species Classi-fication with Random Forest Using Very High Spatial Resolu-tion 8-Band WorldView-2 Satellite Data, Remote Sens., 4, 2661– 2693, https://doi.org/10.3390/rs4092661, 2012.
Kasten, F.: Visibility forecast in the phase of pre-condensation, Tel-lus, 21, 631–635, https://doi.org/10.3402/tellusa.v21i5.10112, 1969.
Komppula, M., Mielonen, T., Arola, A., Korhonen, K., Lihavainen, H., Hyvärinen, A.-P., Baars, H., Engelmann, R., Althausen, D., Ansmann, A., Müller, D., Panwar, T. S., Hooda, R. K., Sharma, V. P., Kerminen, V.-M., Lehtinen, K. E. J., and Vi-isanen, Y.: Technical Note: One year of Raman-lidar measure-ments in Gual Pahari EUCAARI site close to New Delhi in India – Seasonal characteristics of the aerosol vertical structure, At-mos. Chem. Phys., 12, 4513–4524, https://doi.org/10.5194/acp-12-4513-2012, 2012.
Kotsiantis, S. B.: Decision trees: a recent overview, Artif. Intell. Rev., 39, 261–283, https://doi.org/10.1007/s10462-011-9272-4, 2013.
Kuang, Y., Zhao, C., Tao, J., Bian, Y., Ma, N., and Zhao, G.: A novel method for deriving the aerosol hygroscopic-ity parameter based only on measurements from a humidi-fied nephelometer system, Atmos. Chem. Phys., 17, 6651–6662, https://doi.org/10.5194/acp-17-6651-2017, 2017.
Kuang, Y., Zhao, C. S., Zhao, G., Tao, J. C., Xu, W., Ma, N., and Bian, Y. X.: A novel method for calculating ambient aerosol liquid water content based on measurements of a humidified nephelometer system, Atmos. Meas. Tech., 11, 2967–2982, https://doi.org/10.5194/amt-11-2967-2018, 2018.
Li, J., Li, C., Guo, J., Li, J., Tan, W., Kang, L., Chen, D., Song, T., and Liu, L.: Retrieval of aerosol profiles by Raman lidar with dynamic determination of the lidar equation reference height, Atmos. Environ., 199, 252–259, https://doi.org/10.1016/j.atmosenv.2018.11.048, 2019.
Liu, H. J., Zhao, C. S., Nekat, B., Ma, N., Wiedensohler, A., van Pinxteren, D., Spindler, G., Müller, K., and Herrmann, H.: Aerosol hygroscopicity derived from size-segregated chemical composition and its parameterization in the North China Plain, Atmos. Chem. Phys., 14, 2525–2539, https://doi.org/10.5194/acp-14-2525-2014, 2014.
Lv, M., Liu, D., Li, Z., Mao, J., Sun, Y., Wang, Z., Wang, Y., and Xie, C.: Hygroscopic growth of atmospheric aerosol particles based on lidar, radiosonde, and in situ measurements: Case stud-ies from the Xinzhou field campaign, J. Quant.Spectrosc. Ra., 188, 60–70, https://doi.org/10.1016/j.jqsrt.2015.12.029, 2017. Lv, M., Wang, Z., Li, Z., Luo, T., Ferrare, R., Liu, D., Wu, D.,
Mao, J., Wan, B., Zhang, F., and Wang, Y.: Retrieval of Cloud Condensation Nuclei Number Concentration Profiles From Li-dar Extinction and Backscatter Data, J. Geophys. Res.-Atmos., 123, 6082–6098, https://doi.org/10.1029/2017jd028102, 2018. Ma, N., Zhao, C. S., Müller, T., Cheng, Y. F., Liu, P. F., Deng, Z.
Z., Xu, W. Y., Ran, L., Nekat, B., van Pinxteren, D., Gnauk, T., Müller, K., Herrmann, H., Yan, P., Zhou, X. J., and Wiedensohler, A.: A new method to determine the mixing state of light absorb-ing carbonaceous usabsorb-ing the measured aerosol optical properties
and number size distributions, Atmos. Chem. Phys., 12, 2381– 2397, https://doi.org/10.5194/acp-12-2381-2012, 2012. Mamouri, R.-E. and Ansmann, A.: Potential of
polariza-tion lidar to provide profiles of CCN- and INP-relevant aerosol parameters, Atmos. Chem. Phys., 16, 5905–5931, https://doi.org/10.5194/acp-16-5905-2016, 2016.
Mattis, I., D’Amico, G., Baars, H., Amodeo, A., Madonna, F., and Iarlori, M.: EARLINET Single Calculus Chain – technical – Part 2: Calculation of optical products, Atmos. Meas. Tech., 9, 3009– 3029, https://doi.org/10.5194/amt-9-3009-2016, 2016.
McCoy, D. T., Bender, F. A. M., Mohrmann, J. K. C., Hartmann, D. L., Wood, R., and Grosvenor, D. P.: The global aerosol-cloud first indirect effect estimated using MODIS, MERRA, and AeroCom, J. Geophys. Res.-Atmos., 122, 1779–1796, https://doi.org/10.1002/2016JD026141, 2017.
Müller, D., Böckmann, C., Kolgotin, A., Schneidenbach, L., Che-myakin, E., Rosemann, J., Znak, P., and Romanov, A.: Micro-physical particle properties derived from inversion algorithms developed in the framework of EARLINET, Atmos. Meas. Tech., 9, 5007–5035, https://doi.org/10.5194/amt-9-5007-2016, 2016. Pahlow, M., Feingold, G., Jefferson, A., Andrews, E., Ogren, J. A.,
Wang, J., Lee, Y. N., Ferrare, R. A., and Turner, D. D.: Compar-ison between lidar and nephelometer measurements of aerosol hygroscopicity at the Southern Great Plains Atmospheric Radia-tion Measurement site, J. Geophys. Res. Atmos., 111, D05S15, https://doi.org/10.1029/2004JD005646, 2006.
Petters, M. D. and Kreidenweis, S. M.: A single parameter representation of hygroscopic growth and cloud condensa-tion nucleus activity, Atmos. Chem. Phys., 7, 1961–1971, https://doi.org/10.5194/acp-7-1961-2007, 2007.
Rosati, B., Herrmann, E., Bucci, S., Fierli, F., Cairo, F., Gysel, M., Tillmann, R., Größ, J., Gobbi, G. P., Di Liberto, L., Di Don-francesco, G., Wiedensohler, A., Weingartner, E., Virtanen, A., Mentel, T. F., and Baltensperger, U.: Studying the vertical aerosol extinction coefficient by comparing in situ airborne data and elastic backscatter lidar, Atmos. Chem. Phys., 16, 4539–4554, https://doi.org/10.5194/acp-16-4539-2016, 2016.
Rosenfeld, D., Andreae, M. O., Asmi, A., Chin, M., de Leeuw, G., Donovan, D. P., Kahn, R., Kinne, S., Kivekäs, N., Kul-mala, M., Lau, W., Schmidt, K. S., Suni, T., Wagner, T., Wild, M., and Quaas, J.: Global observations of aerosol-cloud-precipitation-climate interactions, Rev. Geophys., 52, 750–808, https://doi.org/10.1002/2013RG000441, 2014.
Rosenfeld, D., Zheng, Y., Hashimshoni, E., Pohlker, M. L., Jef-ferson, A., Pohlker, C., Yu, X., Zhu, Y., Liu, G., Yue, Z., Fis-chman, B., Li, Z., Giguzin, D., Goren, T., Artaxo, P., Bar-bosa, H. M., Poschl, U., and Andreae, M. O.: Satellite retrieval of cloud condensation nuclei concentrations by using clouds as CCN chambers, P. Natl. Acad. Sci. USA, 113, 5828–5834, https://doi.org/10.1073/pnas.1514044113, 2016.
Wieden-sohler, A., Ogren, J., Matsuki, A., Yum, S. S., Stratmann, F., Baltensperger, U., and Gysel, M.: Long-term cloud condensa-tion nuclei number concentracondensa-tion, particle number size distribu-tion and chemical composidistribu-tion measurements at regionally rep-resentative observatories, Atmos. Chem. Phys., 18, 2853–2881, https://doi.org/10.5194/acp-18-2853-2018, 2018.
Seinfeld, J. H., Bretherton, C., Carslaw, K. S., Coe, H., DeMott, P. J., Dunlea, E. J., Feingold, G., Ghan, S., Guenther, A. B., Kahn, R., Kraucunas, I., Kreidenweis, S. M., Molina, M. J., Nenes, A., Penner, J. E., Prather, K. A., Ramanathan, V., Ra-maswamy, V., Rasch, P. J., Ravishankara, A. R., Rosenfeld, D., Stephens, G., and Wood, R.: Improving our fundamen-tal understanding of the role of aerosol-cloud interactions in the climate system, P. Natl. Acad. Sci. USA, 113, 5781–5790, https://doi.org/10.1073/pnas.1514043113, 2016.
Sun, T., Che, H., Qi, B., Wang, Y., Dong, Y., Xia, X., Wang, H., Gui, K., Zheng, Y., Zhao, H., Ma, Q., Du, R., and Zhang, X.: Aerosol optical characteristics and their vertical distribu-tions under enhanced haze pollution events: effect of the re-gional transport of different aerosol types over eastern China, At-mos. Chem. Phys., 18, 2949–2971, https://doi.org/10.5194/acp-18-2949-2018, 2018.
Tan, W., Zhao, G., Yu, Y., Li, C., Li, J., Kang, L., and Zhao, C.: Dataset for “Method to retrieve cloud conden-sation nuclei number concentrations using lidar measure-ments”, Data set, Atmospheric Measurement Techniques, Zen-odo, https://doi.org/10.5281/zenodo.3255086, 2019.
Tao, J., Zhao, C., Ma, N., and Kuang, Y.: Consistency and ap-plicability of parameterization schemes for the size-resolved aerosol activation ratio based on field measurements in the North China Plain, Atmos. Environ., 173, 316–324, https://doi.org/10.1016/j.atmosenv.2017.11.021, 2018a. Tao, J., Zhao, C., Kuang, Y., Zhao, G., Shen, C., Yu, Y., Bian,
Y., and Xu, W.: A new method for calculating number concen-trations of cloud condensation nuclei based on measurements of a three-wavelength humidified nephelometer system, Atmos. Meas. Tech., 11, 895–906, https://doi.org/10.5194/amt-11-895-2018, 2018b.
Titos, G., Cazorla, A., Zieger, P., Andrews, E., Lyamani, H., Granados-Muñoz, M. J., Olmo, F. J., and Alados-Arboledas, L.: Effect of hygroscopic growth on the aerosol light-scattering coefficient: A review of measurements, tech-niques and error sources, Atmos. Environ., 141, 494–507, https://doi.org/10.1016/j.atmosenv.2016.07.021, 2016.
Tong, W., Hong, H., Fang, H., Xie, Q., and Perkins, R.: Decision Forest:? Combining the Predictions of Multiple Independent De-cision Tree Models, J. Chem. Inf. Comp. Sci., 43, 525ßß531, https://doi.org/10.1021/ci020058s, 2003.
Wang, Q., Li, Z., Guo, J., Zhao, C., and Cribb, M.: The climate im-pact of aerosols on the lightning flash rate: is it detectable from long-term measurements?, Atmos. Chem. Phys., 18, 12797– 12816, https://doi.org/10.5194/acp-18-12797-2018, 2018. Wex, H., Neusüß, C., Wendisch, M., Stratmann, F., Koziar, C.,
Keil, A., Wiedensohler, A., and Ebert, M.: Particle scattering, backscattering, and absorption coefficients: An in situ closure and sensitivity study, J. Geophys. Res.-Atmos., 107, LAC4-1-LAC4-18, https://doi.org/10.1029/2000JD000234, 2002. Wulfmeyer, V. and Feingold, G.: On the relationship between
relative humidity and particle backscattering coefficient in the marine boundary layer determined with differential ab-sorption lidar, J. Geophys. Res.-Atmos., 105, 4729–4741, https://doi.org/10.1029/1999JD901030, 2000.
Xu, W. Y., Zhao, C. S., Ran, L., Deng, Z. Z., Liu, P. F., Ma, N., Lin, W. L., Xu, X. B., Yan, P., He, X., Yu, J., Liang, W. D., and Chen, L. L.: Characteristics of pollutants and their correlation to meteorological conditions at a suburban site in the North China Plain, Atmos. Chem. Phys., 11, 4353–4369, https://doi.org/10.5194/acp-11-4353-2011, 2011.
Xu, X., Guo, X., Zhao, T., An, X., Zhao, Y., Quan, J., Mao, F., Gao, Y., Cheng, X., Zhu, W., and Wang, Y.: Are precipitation anoma-lies associated with aerosol variations over eastern China?, At-mos. Chem. Phys., 17, 8011–8019, https://doi.org/10.5194/acp-17-8011-2017, 2017.
Yu, Y., Zhao, C., Kuang, Y., Tao, J., Zhao, G., Shen, C., and Xu, W.: A parameterization for the light scattering enhancement factor with aerosol chemical compositions, Atmos. Environ., 191, 370– 377, https://doi.org/10.1016/j.atmosenv.2018.08.016, 2018. Zhang, F., Wang, Y., Peng, J., Ren, J., Collins, D., Zhang, R., Sun,
Y., Yang, X., and Li, Z.: Uncertainty in Predicting CCN Activity of Aged and Primary Aerosols, J. Geophys. Res.-Atmos., 122, 11723–11736, https://doi.org/10.1002/2017jd027058, 2017. Zhao, G., Zhao, C., Kuang, Y., Tao, J., Tan, W., Bian, Y., Li,
J., and Li, C.: Impact of aerosol hygroscopic growth on re-trieving aerosol extinction coefficient profiles from elastic-backscatter lidar signals, Atmos. Chem. Phys., 17, 12133–12143, https://doi.org/10.5194/acp-17-12133-2017, 2017.