GLOBAL JOURNAL OF ADVANCED ENGINEERING TECHNOLOGIES AND
SCIENCES
TUMOR CELL IDENTIFICATION IN MEDICAL IMAGES USING IMAGE
PROCESSING TECHNIQUES
Basavanna M*, Shivanand S. Gornale, T. N. Govindaiah
*
Assistant Professor, Post Graduate Department of Computer Science, Government
College(Autonomous), Mandya- Karnataka-India
Associate Professor, Department of Computer Science, School of Mathematics and Computing
Sciences, Rani Channamma University, Belgavi. Karnataka-India
Assistant Professor, Post Graduate Department of Physics, Government College(Autonomous),
Mandya- Karnataka-India
ABSTRACT
Lung cancer is one of the most common and deadly diseases in the world. Detection of lung cancer in its early stage is the key of its cure. Therefore, an attempt to detect lung cancer at an early stage is required, so that it may increase the chances of survival among cancer patients. In this paper, unlike existing methods a different classifier to detect tumor cell is proposed. We introduce Max Min cluster algorithm and histogram information of sub-components in the lung component to verify the tumor cell in the sub-components. Then the method studies size of each sub-component in the detected lung component to identify the exact tumor cell. The method is tested on a variety of images and is compared with the existing method to show that the proposed method is superior.
KEYWORDS: Max Min cluster algorithm, histogram information, lung component, tumor cell.
INTRODUCTION
Lung cancer mortality rate is the highest among all other types of cancer. It is one of the most serious cancers in the world, with the survival rate very less after the diagnosis. Survival from lung cancer is directly related to its growth at its detection time. The earlier the detection is, the higher the chances of successful treatment are. An estimated 85% of lung Cancer cases in males and 75% in females are caused by cigarette smoking.[1,2]. There are many techniques to diagnose lung cancer, like Chest Radiography (x-ray), Computed Tomography (CT), Magnetic Resonance Imaging (MRI scan). But, most of these techniques are costly and time consuming. And most of these techniques are detecting the lung cancer in its advanced stages. Hence, there is a great need of a new technology to diagnose the lung cancer in its early stages. [12, 13, 14]. The underlying idea of developing a new method or system is not to delegate the diagnosis to a machine, but rather that a machine algorithm acts as a support to the radiologist and points out locations of suspicious objects, so that the overall sensitivity is raised. Detecting system should meet four main objectives, they are; improving the quality and accuracy of diagnosis, increasing therapy success by early detection of cancer, avoiding unnecessary biopsies and reducing radiologist’s interpretation time. To achieve these objectives, system should have a good method that can detect cancer cell accurately without any confusion. However, it is noticed from literature that Radiologists can miss up to 30% of lung nodules in chest radiographs due to the background anatomy of the lungs which can hide the nodules. Thus lung cancer cell identification is still an elusive goal for researchers in medical imaging [6, 7, 8].
In summary, it is observed from the literature review that most of the methods or systems use classifier and pixel level features to identify tumor cell. It is true that classifier dependent method requires large number of samples for training and it restricts the ability to work on different data sets. In the same way, pixel based methods are sensitive to noise and distortions. Thus, researchers are becoming more and more concerned with the elaboration of automated CAD systems for lung cancer. Many publications proposed different automated nodule recognition systems using image processing, and including, different techniques for segmentation, feature extraction and classification [3,4,5,9]. Therefore, in this paper, we propose a new method based on topological components such as number of holes at component level and sharpness of the components in order to identify tumor cell. The advantage of topological components is that these features are invariant to rotation, scaling, shape and to some extent to distortions.
The main contribution of this work is as follows-Classifying lung cancer components which contain tumor cells from the other components based on topological features and clustering by division. Identifying tumor cells by exploring sharpness features at component level with minimal supervision [6, 7, 8].
PROPOSED METHODOLOGY
The Pre-processing stage that enhances the quality of the image by restraining un- wanted distortions & highlight the data of interest.
The feature extraction acquires the discrete components of the image under processing.
The classification stage that identifies the objects of image & groups according to the certain classes & helps in their efficient recognition
Image acquisition can be broadly defined as the action of retrieving an image from some source which is further processed to get new and better image
Pre-processing enhances some important features relevant to understand the image. Initially pre-processing techniques are used which are application dependent. Pre-processing enhances some important features by suppressing unwanted distortions [30].
Image segmentation is the process where the image is partitioned into its constituent parts or objects that can be identified individually. Through image segmentation, we fragment the image in a series of region, based on features of image that are constant in each region, but differ from one region to another. As per the literature survey some of the image segmentation techniques used are:[1,2]
Region Based Methods Pattern Recognition based Atlas based methods Mean shift algorithm Discrete step algorithm Otsu’s Segmentation method Watershed Segmentation
Image enhancement techniques are used to improve the quality of the image to great extent. It is an automated process based on mathematical functions [9]. The technique can improve image quality in terms of shading, linear contrast adjustment, un-sharp mask filtering, median filtering and color. Image enhancement techniques are divided amongst two major domains that are frequency domain and spatial domain methods.
Feature Extraction is one the important module for image processing. In this stage we extract features of an image which results in recognition, accuracy with very simple classification module. The generic features are:
Morphological features focusing on shape attributes.
Classification is a process of classifying whether the output image is affected or Normal by using different classifiers like K-Nearest Neighbour, Decision Tree, Support Vector Machine, Multilevel Slice, Minimum Distance, Maximum Likelihood etc.
Algorithm:
Step-1: Input grayscale image
Step-2: Apply histogram to the grayscale image
Step-3: Find the index of two peak values index say P1 and P2 from the histogram shown above
Step- 4: Find the average of two peaks A=(P1+P2)/2;
Step- 5: From this average point A, find the average of all grayscale values before A say A1 and similarly find average of all grayscale values after A say A2
Step- 6: Perform max and min clustering, find the cluster value by finding out the average using Cluster value= (A1+A2)/2;
Step- 7: Then compare all the grayscales value with cluster value,
If(grayscalevalues<=clustervalue) then plot in the grayscale image. Step- 8: Then repeat steps 2 to 7 to obtain the results,
Step- 9: Obtain right lung and repeat step 2 to 7, the min cluster results
Step-10 : Now from the left lung component obtain the second largest sub component say C1 similarly for right lung component the second largest sub component say C2. Step-11: Then compare area of C1 with area of C2, whichever area is larger plot that corresponding sub component in the lung component.
RESULTS AND DISCUSSION
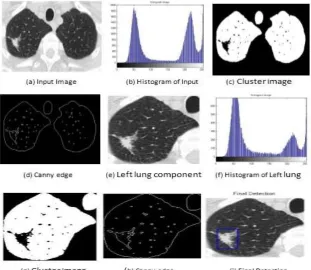
In this work, we explore the Image Processing Techniques for detection of lung cancer cell in the CT image. We have Input grayscale image and then apply histogram to the grayscale image, find the index of two peak values index say P1 and P2 from the histogram shown in the Figure 1(b), then find the average of two peaks A=(P1+P2)/2; From this average point A, find the average of all grayscale values before A say A1 and similarly find average of all grayscale values after A say A2, then to perform max and min clustering, find the cluster value by finding out the average using cluster value= (A1+A2)/2. There are two peaks in the histogram, we take average of first part and second part then we get cluster values using cluster_value=(avg_of_first_part+avg_of_second_part)/2. Then compare all the grayscales value with cluster value, if(grayscalevalues<=clustervalue) then plot in the grayscale image Figure 1(c).
The canny of the gray image is in the Figure 1(d), from this we obtain the left lung component Figure 1(e), then repeat the steps 2 to 7 to obtain the Figure 1 (f) results, to obtain right lung and repeat step 2 to 7, the min cluster results are shown in the Figure 1 (f). The Canny images of the Figure 1(h) obtained left and right lung components. Now from the left lung component obtain the second largest sub component say C1 similarly for right lung component the second largest sub component say C2. The reason to choose second largest sub component is that lung component which is also a sub component is the first largest. Then compare area of C1 with area of C2, whichever area is larger plot that corresponding sub component in the lung component as shown below, Here tumor cell is identified using the size of the tumor cell since most of other sub components are eliminated in the earlier stage Figure 1(i).
CONCLUSION AND FUTURE WORK
This paper presents a Tumor Cell Identification in Medical Images using image processing techniques. The method works on the basis that the max min clustering and histogram information to detect the tumor cell in the lung components. Experimental results show that the proposed method gives promising results. In future, we are planning to propose new objective heuristics to detect the tumor cell in the lung components in CT images.
ACKNOWLEDGEMENT
This research work is supported by University Grants Commission (UGC), New Delhi, India. F. No. 1504-MRP/14-15 KAMY022/UGC-SWRO.
REFERENCES
[1] Bhagyashri G. Patil , Prof. Sanjeev N. Jain, “Cancer Cells Detection Using Digital Image Processing Methods”, International Journal of Latest Trends in Engineering and Technology (IJLTET), ISSN: 2278-621XVol. 3 Issue 4 March 2014.
[2] Mokhled S. al-tarawneh, “Lung Cancer Detection Using Image Processing Techniques”, Leonardo Electronic Journal of Practices and Technologies ISSN 1583-1078 Issue 20, January-June 2012 p. 147-158.
[3] H. Mahersia1, M. Zarou et. al. “Lung Cancer Detection on CT Scan Images: A Review on the Analysis
Techniques”, (IJARAI) International Journal of Advanced Research in Artificial Intelligence, Vol. 4, No.4, 2015.
[4] D. Sharma and G. Jindal, Identifying Lung Cancer using Image Processing Techniques, International Conference on Computational Techniques and Artificial Intelligences (ICCTAI), pp. 116–120, (2011). [5] Arvind Kumar Tiwari, PREDICTION OF LUNG CANCER USING IMAGE PROCESSING
TECHNIQUES: A REVIEW”, Advanced Computational Intelligence: An International Journal (ACII), Vol.3, No.1, January 2016.
[6] L. Delrue, R. Gosselin, B. Ilsen, A. V. Landeghem, J. de Mey and P. Duyck, Difficulties in the Interpretation of Chest Radiography, Comparative Interpretation of CT and Standard Radiography of the Chest, Medical Radiology, Springer-Verlag Berlin Heidelberg, pp. 27–50 (2011).
[7] C. Feichtenhofer, H. Fassold and P. A. Schallauer, Perceptual Image Sharpness Metric based on Local Edge Gradient Analysis, Signal Processing Letters, IEEE, vol. 20, issue 4, pp. 379–382, (2013). [8] Sachith B K, Shivakumara P, Basavanna M, Roopa C K, “Sharpness based Method for Lung Cancer
Cell Identification”, Eighth International Conference on Image and Signal Processing (ICISP-2014), The Society of Information Processing, (SIP), Bangalore, pp 7-12.
[9] Ed-Edily Mohd. Azhari1, Muhd. Mudzakkir Mohd. Hatta1, Zaw Zaw Htike1 and Shoon Lei Win2, TUMORDETECTIONINMEDICALIMAGING:A SURVEY”, International Journal of Advanced Information Technology (IJAIT) Vol. 4, No. 1, February 2014.
[10]Amit Verma* and Gayatri Khanna, A Survey on Digital Image Processing Techniques for Tumor Detection”, Indian Journal of Science and Technology, Vol 9(14), DOI: 1210.17485/ijst/2016/v9i14/84976, April 2016.
[11]Shivanand S. Gornale, Pooja U. Patravali, Ramesh R. Manza “A Survey on Exploration and Classification of Osteoarthritis Using Image Processing Techniques”, International Journal of Scientific and Engineering Research (IJSER), ISSN 2229-5518, Volume 7, Issue 6,July 2016.
[12]Aniket Gaikwad1, Azharuddin Inamdar2, Vikas Behera3, Lung cancer detection using digital Image processing On CT scan Images”, International Research Journal of Engineering and Technology (IRJET) e-ISSN: 2395 -0056, Volume: 03 Issue: 04, Apr-2016.
[14]Ajil M V, Sreeram S, “Lung Cancer Detection from CT Image using Image Processing Techniques”, International Journal of Advance Research in Computer Science and Management Studies, ISSN: 2321-7782 (Online), Volume 3, Issue 5, May 2015.