A Novel Method for the Detection of
Microcalcifications Based on Multi-scale
Morphological Gradient Watershed
Segmentation Algorithm
S. Vijaya Kumar*, M.Naveen Lazarus**, C. Nagaraju***
* Asst. Professor in IT, RGMCET, Nandyal. ** M.Tech (IInd year), RGMCET, Nandyal.
***Professor & Head of IT, LBR College of Engineering, Mylavaram. E-mail: [email protected] , [email protected], [email protected]
Abstract:
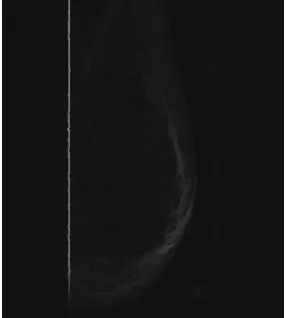
This paper presents an automated system for detecting masses in mammogram images. Breast cancer is one of the leading causes of women mortality in the world. Since the causes are unknown, breast cancer cannot be prevented. It is difficult for radiologists to provide both accurate and uniform evaluation over the enormous number of mammograms generated in widespread screening. Microcalcifications (calcium deposits) and masses are the earliest signs of breast carcinomas and their detection is one of the key issues for breast cancer control. Computer-aided detection of Microcalcifications and masses is an important and challenging task in breast cancer control. This paper presents a novel approach for detecting microcalcification clusters. First digitized mammogram has been taken from Mammography Image Analysis Society (MIAS) database. The Mammogram is preprocessed using Adaptive median filtered. Next, the microcalcification clusters are identified by using the marker extractions of the gradient images obtained by multiscale morphological reconstruction and avoids Over segmentation vivid in Watershed algorithm. Experimental result show that the microcalcification can be accurately and efficiently detected using the proposed approach.
Keywords: Mammograms, Micro-calcification, pre-processing, segmentation, watershed transform. 1. Introduction
Breast cancer is one of the leading cancers in the female population. About 25% of all cancers diagnosed in women are breast cancers and about 20% of all lethal cancers are breast cancers. It is the leading cause of death due to cancer in women [1].The risk of developing Breast Cancer can be reduced by: Having children before 30, Breast-feeding, Limiting alcohol intake, maintaining a healthy weight, exercising regularly [2]. Early detection is the key to improving breast cancer prognosis. Mammograms have been shown to be one of the most reliable methods for early detection of breast carcinomas. Although computer-aided mammography has been studied for two decades, automated interpretation of micro calcifications is still very difficult. The dense tissues, and especially in younger women, cause suspicious region to be almost invisible and may be easily misinterpreted as calcifications and yield a high False Positive (FP) rate that is a major problem with most of the existing algorithms. Double readings, as carried out, for example, by two radiologists, usually improve the quality of diagnostic findings, thus, greatly reducing the probability of misdiagnosis.[3] On these grounds, adequate computational tools are expected to be helpful to the radiologist. The method we proposed is simple to detect the micro calcification clusters based on multi-scale morphological Gradient watershed segmentation algorithm. This paper is organized as follows. Section 2 introduces Mammogram image Acquisition and preprocessing using Adaptive median filter. In Section 3, Morphological Reconstruction of Mammogram image is described. In Section 4, Generation of Gradient image is presented .In Section 5, Generation of Final Gradient image is presented. In Section 6, Marker Extraction is presented. In Section 7, Clustering based on segmentation is applied .The experimental results are presented in Section 8 and Section 9 concludes the work.
2. Image Acquisition and Pre-Processing
2.1 Pre-processing
The pre-processing phase is the most important step in mammogram image analysis. Adaptive Median filtering has been found to be very powerful in removing noise from two-dimensional signals without blurring edges. This makes it particularly suitable for enhancing mammogram images.
Adaptive Median Filter:
Adaptive median filter works on a rectangular region Sxy. It changes the size of Sxy during the filtering operation depending on certain conditions as listed below [4, 5].The output of the filter is a single value which replaces the current pixel value at (x, y), the point on which S is centered at the time [6]. The following notation is used:
Zmin = minimum pixel value in Sxy Zmax = maximum pixel value in Sxy Zmed = median pixel value in Sxy Zxy= pixel value at coordinates (x, y) Smax = maximum allowed size of Sxy
The adaptive median filter works in two levels, denoted Level A and Level B, as follows: Level A:
If Zmin <Zmed <Zmax Go to level B Else
Increase the window size If window size <= Smax Repeat level A
Else
Output Zxy
Level B:
If Zmin <Zxy <Zmax I Output Zxy Else
Output Zmed
First mammogram image (mdb030 G MISC B 322 676 43) has be taken from MIAS database and pre-processed using Adaptive median filtered as mentioned above. The result of preprocessed mammogram image is displayed in section 8, fig 8.2.
Block Diagram for Detection of Micro calcification:
Fig 1. Block Diagram for Detection of Micro calcification Marker Extraction
Watershed Segmentation Clustered Output Image Pre-processing using Adaptive median Filter
Image Reconstruction using Morphological operations
Multi-scale Gradient Image Generation Final Gradeint Image
Generation Mammogram Image
3. Morphological Reconstruction of Mammogram Image
The Preprocessed mammogram image is morphologically reconstructed for smoothening the interior objects i.e. calcium deposits [7]. The basic morphological operators involved in this phase are listed below.
The two most fundamental morphological operations are dilation and erosion. Dilation of the image, f by the 4 or 8 connected structuring element (SE), B expands the image while the erosion of f by B shrinks the image. Dilation and erosion can be represented as ∂ (f) (s,t) , ε(f) (s,t) .
The smoothening of the calcium deposits i.e. micro calcifications is performed using the morphological closing by partial reconstruction operator, (Фk) on the pre processed, dilated image, ∂(f) with a reference image, φk(f)
which is obtained by closing the pre-processed image k times. This is given by
MF( f) = Φ(rec) (∂(f), φk (f)) 0≤ k ≤ n (1)
Where φk(f) is the closing of the mammogram image, where n is the size of the structure element, B. The output of this phase result is displayed in section 8, fig 8.3.
4 .Multi-scale Gradient Image Generation
The gradient magnitude is used often to preprocess a gray-scale image prior to use the watershed transform for segmentation[8].The gradient magnitude image of mammogram has high pixel values along object(calcium deposits) edges and low pixel values everywhere else. The gradient image, G (f) is morphologically obtained by subtracting the eroded image, ε(f) from its dilated version, ∂(f) . A multiscale gradient, MG(f) is the average of morphological gradients taken for different scales of the structure element, Bi.
MG (f) = 1/n∑[ε (∂ (MF (f), Bi ) – (MF(f),Bi ),B i-1)] (2) Where Bi is a SE of size (2i+1)x (2i+1).
The noise and quantization errors in the homogenous regions of the image may produce many insignificant minima in the resulting gradient image which causes over segmentation when subjected to watershed segmentation algorithm. The multi-scale gradient image is displayed in section 8, fig 8.4.
To overcome this i.e. to eliminate the irrelevant minima, Final Gradient image can be generated by using Multi-scale Gradient image.
5. Final Gradient Image Generation
To eliminate the irrelevant minima, the multiscale gradient image, MG (f) is dilated with a SE of smaller size. The local minima with very low contrast can be removed by adding a constant gray value, h which is approximately 30 percentile of histogram of the dilated MG (f).A Final Gradient image, FG (f) is obtained by reconstructing the multiscale gradient image, MG (f) with its dilated image as a reference image.
FG(f)Φ(rec) MGf B + h , MGf
The final gradient image which is obtained by using the above morphological reconstruction is displayed in section 8, fig 8.5.
6. Marker Extraction
Marker extraction is an important step in morphological segmentation procedure. The goal of marker extraction is to detect the presence of homogeneous regions on the mammogram [9]. The Watershed segmentation algorithm applied directly to the gradient image can cause over-segmentation due to serious noise or image irregularities. The over segmentation image after directly applying watershed segmentation is displayed in section 8, fig 8.6.
production of markers by identifying the interior of the objects to be segmented. Due to the presence of large no of regional minimas the over segmentation arising. The regional minimas can be seen in section 8, fig 8.7.
6.1 Internal Markers
Most of the regional minimas are very shallow and represent detail that is irrelevant to our segmentation problem. To eliminate these extraneous minima, internal markers [11] are obtained. Internal Markers are associated wit h the objects of interest. Internal markers can mark the objects of the mammogram image. Internal marker image is displayed in section 8, fig 8.8.
6.2 External Markers
External Markers [11] are belonging to background are calculated. These markers can be calculated by finding pixels that are exactly midway between the internal markers. External marker image is displayed in section 8,fig 8.9.
After finding the internal and external markers, modified gradient image can be generated so that the mammogram image is modified since regional minima occur only in the marked locations. Other pixel values are pushed up as necessary to remove all other regional minima.
From the marker modified gradient image (fig we can observe that calcium deposits i.e. microcalcifications which are represented using the internal markers separated by external markers and imposed on final Gradient image. The marker modified gradient image is displayed in section 8, fig 8.10.
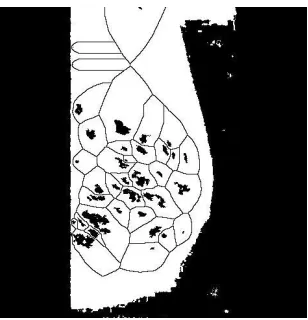
7. Watershed Segmentation
The Final Gradient image which is marker extracted is subjected to Watershed Segmentation. Watershed segmentation [10]-[11] produces a more stable segmentation of objects including continuous segmentation boundaries by a concept of producing catchments basin (watershed) and watershed line (divide lines or dam boundaries). Watershed transformation is applied on the Modified marker gradient image. Thus the watershed algorithm is provided the image C(f) which was obtained from Modified marker gradient image(MMGI) and original image .After applying watershed transformation on MMGI superimpose the watershed ridge line on the original mammogram image. The segmentation using watershed algorithm is displayed in section 8, fig11.
8. Experimental results
Fig 8.3 Morphologically reconstructed Fig 8.4 Multi-scale Gradient Image
Fig 8.5 Final Gradient Image Generation Fig2.6 Over-segmentation problem
Fig 8.9 External Marker image Fig 8.10 Marker modified gradient image
Fig 8.11 detection of microcalfications on the original image (Segmented image).
9. Conclusions:
In this paper, we have applied a novel approach to the detection of micro-calcifications based on Multi-scale Morphological gradient watershed algorithm on mammogram image .This method is simple and would give better segmentation results .We applied this algorithm on the 36 samples of mammograms ,while detection rate of the proposed methodology is equals to the doctor’s detection.
This paper has highlighted a method for detection of microcalcifications in breast at an early stage by Digital mammogram image analysis. The problem here is to differentiate between the benign and malignant tumors. For this, one has to go for the biopsy of the suspected malignant tumors.
References:
[1] S. Detounis. Computer-Aided Detection and Second Reading Utility and Implementation in a High-Volume ,Breast Clinic. Applied Radiology, 8-15, 2004.
[2] 2.K.Thangavel, M.Karnan,”Computer Aided Diagnosis in Digital Mammograms:Detection of Microcalcifications by Meta Heuristic Algorithms”, ICGST-GVIP Journal, Volume (5), Issue (7), July 2005.
[3] K. Thangavel, M. Karnan, R. Siva Kumar, and A. Kaja Mohideen. Automatic Detection of Microcalcifications in Mammograms–A Review. International Journal onGraphics Vision and Image Processing. 5, 2005.
[4] Yanming Zhao, Dongmei Li, and Zhaohui Li,” Performance enhancement and analysis of an adaptive median filter”.
[5] R.C. Gonzalez and R.E. Woods, Digital Image Processing-Second Edition (Beijing, Publishing House of Electronics Industry, 2003). [6] H. Hwang, and R. A. Haddad, Adaptive median filters: new algorithms and results, IEEE Trans. Image Processing, 4, 499 (1995). [7] P.Salembier and J.Serra. “Morphological Multiscale Image Segmentation” in proc. Visual Communication and Image Processing,
[8] Krishnan Nallaperumal, K.Krishnaveni,” A novel Multi-scale Morphological Watershed SegmentationAlgorithm”, IJISE,GA,USA,ISSN:1934 9955, VOL.1,NO.2, APRIL 2007.
[9] S.Anusuya ,”Morphological segmentation of digital images based on multiscale gradient watershed algorithm”.
[10] S. Beucher. The Watershed Transformation Applied to Image Segmentation. Proc. Pfefferkorn Conf. on Signal and Image Processing in Microscopy and Microanalysis, Cambridge, UK, pp. 299-314, Sept. 1991.
[11] R. Lotufo,W. Silva, Minimal set of markers for the watershed transform, in: Proc. ISMM2002
S.Vijaya Kumar Received the B.Tech (CSE) degree from KSRM College of Engineering in 2004. He received the M.Tech (CS) degree from RGMCET Nandyal in 2007. At present he is working as Assistant Professor in the department of IT at RGMCET, Nandyal. He has got 5 years of teaching experience. His research interest includes Image Processing, Pattern Recognition, and Ant colony optimization. He has 5 research papers in various national and international journal and conferences. He has 2 seminars and workshops. He is member of various professional societies like ISTE,IAENG ,IACSIT and CSI
M.Naveen Lazarus Received the B.Tech (CSE) from M R R I T S in 2007. He is pursuing M.Tech (IInd year) in R G M College of Engineering and Technology, Nandyal . He has one research paper in national conference. His area of interests includes Image Processing, Pattern Recognition, and Ant colony optimization. He has 3 research papers in various national and international journal and conferences. He is member of various professional societies like ISTE,IAENG, CSI.