http://www.sciencepublishinggroup.com/j/aff doi: 10.11648/j.aff.20170601.17
ISSN:2328-563X (Print); ISSN:2328-5648 (Online)
Study on Classification Corn Seedling and Weed Based on
RGB Model and HSV Model
Xinyu Hu
*, Fuzhong Li
Department of Software, Shanxi Agriculture University, Taigu, China
Email address:
[email protected] (Xinyu Hu)
*Corresponding author
To cite this article:
Xinyu Hu, Fuzhong Li. Study on Classification Corn Seedling and Weed Based on RGB Model and HSV Model. Agriculture, Forestry and Fisheries. Vol. 6, No. 1, 2017, pp. 49-54. doi: 10.11648/j.aff.20170601.17
Received: February 27, 2017; Accepted: March 13, 2017; Published: March 15, 2017
Abstract:
RGB (Red-Green-Blue) model and HSV (Hue-Saturation-Value) model are used to classify corn seeding and weed. Plants are distinguished from background based on color feature, and the binary image is acquired. As foreground in binary image, corn seedling and weed are labelled effectively with a set of numbers after clearing noise and labelling connected components. Then saturation energy of each connected component with a certain label can be calculated, and the maximum saturation energy is corresponded to the region of corn seedling. Furthermore, in hue image, corn seedling root has larger hue value, so the location of root is acquired. Therefore, we can not only classify corn seedling and weed, but also acquire location of corn seedling root, and the results show that the method of classification corn seedling and weed based on RGB model and HSV model has a great accuracy and real-time performance.Keywords:
Connected Components Labeling, Saturation Energy, Classification, Corn Seedling, Location1. Introduction
Weeds are great harmful to crops especially in seedling stage, they compete with crops for fertilizer, light, water and space. They are easy to cause pest and disease damage, thus reduce crop yield and quality. The currently existing weeding methods include artificial weeding, mechanical weeding, chemical weeding, biological weeding, flame weeding, electricity weeding, and radiation weeding. While mechanical weeding can not only resist effectively the use of pesticides and chemical fertilizer so that meet the requirements of people for food security and environmental protection, but also increase the air permeability and water permeability of soil so that contribute to the growth of crops (Athanasios et al., 2010). The key technology of mechanical weeding is the precise identification of weed, which guarantees intelligence and accuracy.
Corn has become the biggest grain crop in China. In the process of growth, corn in seedling stage is harmed by weeds most seriously, therefore, corn seedling stage is a key period of weeding (Li et al., 2011).
Currently, weed identification methods can be divided into:
The accuracy and real-time performance are very important in weed identification. The main objectives of this research were to classify corn seedling and weed based on RGB model and HSV model.
2. Materials and Methods
2.1. Image Acquisition
Images were acquired through a color camera Z30C with a resolution of 640 * 480 pixels and a maximum frame rate of 60 per second, and the camera was connected to a microcomputer with Intel Core(TM) i5-4590 CPU through a USB 2.0 cable. Image processing was performed on MATLAB R2015a.
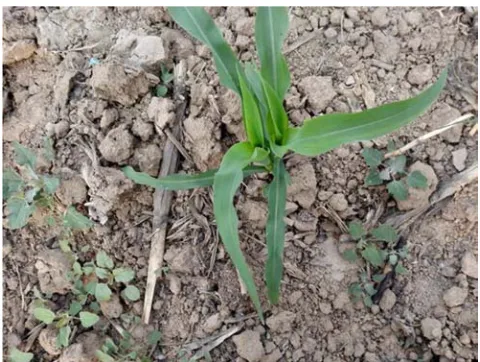
Corn seedling stage is a key period of weeding. Figure 1 shows the images which acquired by above methods, and it contains corn seedling (double seedlings), weeds, straw, soil and gravel.
Figure 1. Image in corn seedling with weeds, straw, soil and gravel.
2.2. Background Removal and Binarization.
Figure 1 has complex background. In order to classify corn seedling and weed rapidly, color feature was used to remove soil, gravel, and straw. In this research, soil, gravel, and straw were regarded as background, while corn seedling and weed were regarded as foreground, so that classify corn seedling and weed in foreground region. Binarization gives background the value of binary 0 and foreground binary 1, therefore binary image can be the template of mask operation for later image processing.
Plants are usually green, soil and gravel are usually yellowish-brown or reddish-brown, and straws are usually faint yellow (Long et al., 2007), so we can use following formula to get binary image:
1 ( , ) ( , ) & ( , ) ( , ) ( , )
0 BW
G x y R x y G x y B x y
I x y
otherwise
> >
=
(1)
where,
( , )x yis the coordinate of a pixel,
R,
Gand
Bdenote respectively the red, green and blue
color components of an RGB image,
IBWis the
binary image.
Large tests showed that the background removal is very effective using the above method. Figure 2 is the binary image of Figure 1.
Figure 2. Binary image.
2.3. Noise Cleaning and Connected Components Labelling
Binary image from the original RGB image is perturbed by noise, and some of the noise can be removed with morphologically filter. Morphological opening and closing as a grouping operation can clean the islands and holes noise (Maragos et al., 1987). However, the area of noise pixels is very small, so in the foreground of binary image, those small connected components can be seen as noise pixels and cleaned directly, that is, we can give these pixels binary 0 and regard them as background. Therefore, two operation of noise cleaning and connected components labelling can be processed at the same time.
Connected components labelling is a very common operation for image processing. An efficient method (Robert et al., 1992) can be concluded as follows:
(1) Encode run-length to the input image;
(2) Scan the runs, assign preliminary labels and record label equivalences in a local equivalence table;
(3) Resolve the equivalence classes;
(4) Relabel the runs based on the resolved equivalence classes.
Through connected components labelling, foreground is described as a set of connected components with different labels. Calculating the area of each connected component, if the area is lower than threshold, the connected component will be labelled 0 and regarded as background, so that realizing noise cleaning. Then relabeling the binary image after noise cleaning.
in the connected components with different labels as shown in Figure 3.
Figure 3. Image after noise cleaning and connected components labeling.
2.4. Classification Corn Seedling and Weed
2.4.1. Hue and Saturation Analysis in HSV Model
Humans interpret a color largely based on hue and saturation (Eleftheriadis et al., 1995). Hue is a color attribute associated with the dominant wavelength in a mixture of light waves, and represents the dominant color as perceived by an observer; while saturation refers to the relative purity or the amount of white light mixed with a hue. Hue and saturation together describe the chrominance (Gonzalez, et al., 1992). The HSV (hue, saturation, value) color model is very closely to the human perception of color (Plataniotis et al., 2000).
The color of object is determined by its spectral reflective characteristic and light source characteristic (Chang et al., 1996). Inanimate soil, gravel, straw and living plants have different spectral reflectance characteristics. Corn seedling and weed with different morphology and biological characteristics also show different spectral reflectance characteristics. Obviously, different spectral reflective characteristics result in different hue and saturation.
The following equations can be used to transform the RGB coordinate to HSV space:
2
2
( ) ( )
arccos{ }
2 ( ) ( )( )
( ) ( )
2 arccos{ }
2 ( ) ( )( )
− + −
≤
− + − −
=
− + −
− >
− + − −
R G R B
B G
R G R B G B
H
R G R B
B G
R G R B G B
π
(2)
max( , , ) min( , , ) max( , , )
−
= R G B R G B
S
R G B (3)
max( , , ) 255
= R G B
V (4)
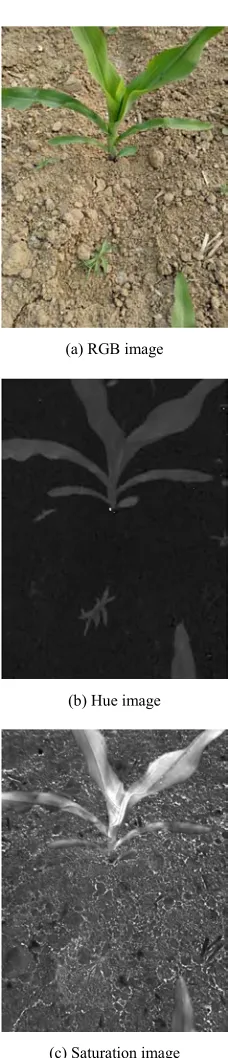
Therefore, HSV model can be acquired based on RGB model. Figure 4 show that seedling, weed, soil and other background have different values of hue and saturation.
(a) RGB image
(b) Hue image
(c) Saturation image
Figure 4. RGB image, hue image and saturation image.
In Figure 4(b), there is a very bright region, and it is just corn seedling root, which can be used to detect the location of corn seedling root. In Figure 4(c), the sheath and stem of corn seedling is brighter than other parts in the image, this is because corn seedling leaf and stem distribute like a horn upside down, which decides different parts of corn seedling have different amounts of reflection to light and different saturation values.
2.4.2. Saturation Energy Definition
and variance of saturation value in a region, the mathematic equation is as the following:
2 ( , )
2
2 2
2 2
2 2
2 2
[ ( , ) ]
[ ( , ) ]
[ ( , ) 2 ( , ) ]
( , ) 2 ( , )
( , )
[ ( , )]
( , ) ∈
= −
= −
= − +
= − +
= −
= −
∫∫
∑∑
∑∑
∑∑
∑∑
∑∑
∑∑
∑∑
I x y I
E S x y S dxdy
S x y S
S x y SS x y S
S x y S S x y nS
S x y nS
S x y
S x y
n
(5)
where, I is a connected component in the image, ( , )x y is the coordinate of a pixel in the connected component I , that is ( , )x y ∈I , S x y( , ) is the saturation value of the pixel
( , )x y , S is the average of all saturation values in the
connected component I , that is S=
∑∑
S x y( , ) n , n is the total pixel numbers in the connected component I , EI is saturation energy of the connected component I.2.4.3. Calculating Saturation Energy Based on Connected Components Labelling
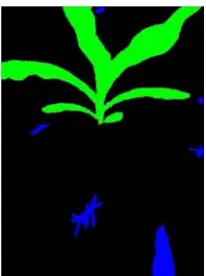
According to connected components labelling in the section 2.3, the foreground has been divided into several different regions with different labels. In order to calculate saturation energy in these regions, the labeling result can be the template to mask the saturation image. Because of the difference of spectral reflective characteristics, different regions have different saturation energy values, and the region of corn seedling has much larger saturation energy than other regions. Figure 5 shows the saturation image masked by binary image after labelling. Figure 5(a) is the result of the image Figure 4(a) after noise cleaning and connected components labelling., Figure 5(a) was used to mask Figure 4(c), and
Figure 5(b) was obtained. In Figure 5(b), the edge of each region was marked with red line, and the number of each region was texted with green.
(a) Image after labelling
(b) Saturation image masked by labelled image
Figure 5. Saturation image after labeling.
As shown in Figure 5(b), the foreground in saturation image has been divided into several different regions with different labels. Therefore, saturation energy of each region can be calculated, and the results are shown in Table 1.
Table 1. Saturation energy of each region in Fig.5(b).
Region number 1 2 3 4 5 6 7
Saturation energy 1406.29 4.40 26.65 4.03 37.89 3.41 0.82
In Table 1, Region 1 has much larger saturation energy, and it denotes the region of corn seedling.
2.4.4. Acquire Location of Corn Seedling Root Based on Hue
According to the above analysis, corn seedling root has much larger hue, which can be used to detect the location of corn seedling root. In addition, the region of corn seedling root intersects with foreground. The above analysis can be described in mathematics as the following:
T R FR
R
if ( , )> and then
∩ ≠ ∅ ∈ root
H x y H I I
I I (6)
where, H x y( , ) is the hue value of the pixel ( , )x y , HT is threshold of hue, IR is a connected component whose points all satisfy H x y( , )>HT, IFR is the foreground, Iroot is the region of corn seedling root.
Figure 6. Result of identifying corn seedling and marking corn seedling root.
3. Results and Discussion
The method of classification corn seedling and weed based on RGB model and HSV model has been proposed in this paper. In order to demonstrate the efficiency of this method, 150 images in corn seedling were collected in two corn fields. In these images, the soil characteristics, the distribution of gravel and straw, and the species of weeds are different. The methods in this paper were applied to classify corn seedling and weed in the 150 images. The results show that the accuracy rate is 97.33%, and the average processing time is 0.3370s, moreover, an image including a corn seedling has a more accurate classification result.
When corn is planted, plant distance in the row is usually 20~50cm (Wu et al., 2012).In order to ensure the accuracy and real-time performance, the agricultural tractor carrying camera can drive at 2.14~7.69km/h speed, which can meet the requirements of the agricultural machinery operation.
This method can not only classify corn seedling and weed, but also acquire location of corn seedling root, which is helpful to the design of mechanical weeding machine and the achievement of precise weeding.
As weeding end executor, the hoe’s performance affects weeding efficiency directly, and there are many kinds of hoe. In 2007, a rotating disc with cut-out was first designed (O’Dogherty et al., 2007), it can achieve intra-row weeding and avoid damaging the plant stems. The model is as shown in Figure 7. The hoe can be equipped and applied if the corn seedling has been identified and the root location has been acquired.
Figure 7. Rotating disc with cut-out.
4. Conclusion
In the paper, plants are distinguished from background according to color feature based on RGB model, hue image and saturation image are acquired based on HSV model, corn seedling and weed are classified on saturation energy, and location of corn seedling root are acquired on hue value. Therefore, the method of classification corn seedling and weed based on RGB model and HSV model are proposed. In addition, the processing accuracy and speed can meet actual agricultural needs.
To improve the accuracy and robustness, our ongoing and future research is as follows: 1. Considering the situation of corn seedling and weed overlapping, and adding segmentation method; 2. On the basis of saturation energy, adding elongation, roundness, complexity and other shape features to increase classification rate; 3. In hue image, the hue value of corn seedling root is much larger than other region, but there are some restrictions, such as camera installing with an acute angel not vertical, soil cannot be harden or be dark brown and blackish, which should be further researched.
Acknowledgements
This research work has been supported by Shanxi Agriculture University Science and Technology Innovation Project (2015YJ09), Shanxi Provincial Program for Science and Technology (20140311013-5).
References
[1] Athanasios, P. D., and T. Bartzanas. 2010. Soil Engineering. Berlin: Springer.
[2] Chang, Y. C., and J. F. Reid. 1996. Characterization of a color vision system. Transactions of the Asabe, 39 (1): 263-273. [3] Cordill, C., and T. E. Grift. 2011. Design and testing of an
intra-row mechanical weeding machine for corn. Biosystems Engineering, 110 (3): 247-252.
[4] Eleftheriadis, A., and A. Jacquin. 1995. Automatic face location detection for model-assisted rate control in H.261-compatible coding of video. Signal Processing Image Communication, 7 (4): 435-455.
[5] Gonzalez, R., and R. E. Woods. 1992. Digital Image Processing. Boston: Addison-Wesley Publishing Company. [6] Hemming, J., and T. Rath. 2001. Computer-vision-based weed
identification under field conditions using controlled lighting. Journal of Agricultural Engineering Research, 78 (3): 233-243. [7] Li, Y., and H. L. Chen. 2013. Optimal spatial scale for
crop-weed discrimination. Transactions of the Chinese Society of Agricultural Engineering, 29 (16): 159-165.
[8] Li, Y. L., and Q. W. Jia. 2011. Weed occurrence regularity and chemical control technology in corn field. Modern Agricultural Sciences and Technology, 21: 206-207.
[10] Maragos, P., and R. W. Schafer. 1987. Morphological filters-Part I: Their set-theoretic analysis and relations to linear shift-invariant filters. IEEE Transactions on Acoustics Speech & Signal Processing, 35 (8): 1153-1169.
[11] O’Dogherty, M. J., R. J. Godwin, A. P. Dedousis, J. L. Brighton, and N. D. Tillett. 2007. A mathematical model of the kinematics of a rotating disc for inter- and intra-row hoeing. Biosystems Engineering, 96 (2): 169-179.
[12] Persson, M., and B. Åstrand. 2008. Classification of crops and weeds extracted by active shape models. Biosystems Engineering, 100 (4): 484-497.
[13] Plataniotis, K. N., and A. N. Venetsanopoulos. 2000. Color Image Processing and Applications. Berlin: Springer. [14] Robert, M. H., and G. S. Linda. 1992. Computer and robot
vision. Boston: Addison-Wesley Publishing Company. [15] Shearer, S. A., and R. G. Holmes. 1990. Plant identification
using color co-occurrence matrices. Transactions of the Asae, 33 (6): 2037-2044.
[16] Tian, L. F., and D. C. Slaughter. 1998. Environmentally adaptive segmentation algorithm for outdoor image segmentation. Computers & Electronics in Agriculture, 21 (3): 153-168.
[17] Visser, R., and A. J. M. Timmermans. 1996. Weed-It: a new selective weed control system. Proceedings of SPIE - The International Society for Optical Engineering, 2907: 120-129. [18] Woebbecke, D. M., G. E. Meyer, K. V. Bargen, and D. A.
Mortensen. 1995. Shape features for identifying young weeds using image analysis. Transactions of the Asae, 38 (1): 271-281.