101
Volume LVIII 11 Number 2, 2010
VALIDATION OF MODIFIED MILK REFERENCE
SAMPLE IN TERMS OF ITS SUITABILITY FOR
INFRA-RED ANALYSIS CALIBRATION VIA
EVALUATION OF PHYSICAL PROPERTIES
O. Hanuš, V. Genčurová, T. Kopec, T. Yong, L. Janů
Received: November 30, 2009
Abstract
HANUŠ, O., GENČUROVÁ, V., KOPEC, T., YONG, T., JANŮ, L.: Validation of modifi ed milk reference sample in terms of its suitability for infra-red analysis calibration via evaluation of physical properties. Acta univ. agric. et silvic. Mendel. Brun., 2010, LVIII, No. 2, pp. 101–110
Routine milk analyses using the effi cient indirect infra-red method are important for the milk food chain quality. The reliability of the results depends on the calibration quality. It is important to use a relevant set of reference calibration samples (RCSs). RCSs with right range of values can be prepared using various methods. This paper was aimed to balance the impacts of dilution for decrease of main components in RCSs because of minimal change of matrix interference eff ects. Cow milk samples (MSs) were diluted (4/1) using distilled water, NaCl solution and a solution with specifi c composition (SC; because of disturbance in the balance of the milk matrix (NaCl 1.145; KCl 0.849; K2HPO4 1.8463; citric acid 1.7; urea 0.3 g / l)) for reduction in main milk components. Fat (F), crude protein (CP), lactose (L), milk freezing point (MFP), osmolality (OS) and electrical conductivity (EC) were measured in all (original as well as modifi ed) MSs. The lowest MFP and OS were in the original milk −0.5559 °C and 274.5 mOsmol/kg. The MFP was increased to −0.4369 °C and osmolality decreased to 217.83 mOsmol/ kg by the addition of water. The MFP was decreased (−0.4903 °C) and returned to original milk value by the addition of NaCl solutin. MFP was −0.4788 °C due to SC addition. The decrease was less than for NaCl. The ability of other SC components (K2HPO4, KCl, citric acid and urea) to MFP decrease is less than for NaCl solution. EC was highest for NaCl set 4.69 mS / cm, EC for SC was 4.48 mS / cm (P < 0.001). The original MSs set showed EC 4.27 mS / cm. The SC was the nearest to original MSs in terms of total mineral composition. ECs for both modifi cations diff ered (P < 0.001) from original MSs. The procedure is applicable for balance of interference eff ects of milk matrix because of relevant cali-bration.
milk, interference eff ect, composition, milk freezing point, osmolality, electrical conductivity
The results of routine milk analysis are impor-tant for improving the genetics of dairy cattle and ensuring the quality of the milk food chain. Mo-dern methods include effi cient indirect methods as infra-red (IR) analysis. This procedure is usual ly performed in mid IR or as near IR variant. Over the years a number of authors (Sjaunja, 1984 a, b, c; Sjaunja et al., 1984; Sjaunja and Andersson, 1985; Hanuš et al., 1992, 1995 a, 2002; Tsenkova et al., 2000; Kukačková et al., 2000; Jankovská and Šustová, 2003; Kráčmar et al., 2004; Bijgaart, 2006; Broutin, 2006; Šustová et al., 2006, 2007) have investigated
urea) or withdrawals (milk fat) of components or me-chanical stress of milk samples (free fatty acids) are commonly used etc. (Hanuš et al., 1995 b, 1997, 2003, 2008 a, b; Hering et al., 2008). The addition of water or other solutions is used to achieve lower values of milk components. The required row of milk compo-sition values in RCSs is achieved by modifi cations for IR analysis calibration purposes.
Milk samples (MSs) used in the regular calibration of analytical instruments which work on basis of IR absorption spectrophotometry are seldom pur-posely modifi ed to cover the range of investigated components found in the real fi eld. This is why dis-tilled water is added in selected MSs of the calibra-tion set owing to decrease in fat, protein and lac-tose contents. Of course, such addition can disturb the whole milk composition (milk matrix) to a cer-tain extent in particular in terms of soluble mineral composition. The mineral matters or salts of some inorganic and organic acids in milk can be con si-de red as agent of interference eff ects for measure-ment via IR analyzer (Hanuš et al., 1992). There are above all chlorides, sodium, potassium, citric acid, urea, free fatty acids etc. (Kerkhof Mogot et al., 1982; Sjaunja, 1984 c). The dilution of milk with distilled water alone leads to decrease in the fat, protein and lactose contents and a change in concentration of minerals and other soluble matter at the same time. This can cause a change in interference eff ects in measured MS and consequently also error measure-ment in the IR analysis. The calibrated instrumeasure-ment automatically compensates mean interference ef-fects on the results of measurement in the current (average) MSs. However, this could be diff erent in modifi ed milk. MS was diluted using NaCl solution at a concentration that was approximately equal to the total milk mineralization, instead of plain wa-ter to avoid possible unfavourable eff ects such as change of normal interference eff ect in milk matrix. However, the NaCl solution could cause diff erent interference eff ect to the above mentioned whole specifi c composition (SC; chlorides, sodium, potas-sium, citric acid and urea). For this reason the SC water solution which approaches the modifi ed MS to fi nal current matrix composition a er its addi-tion to milk as much as possible, was created. This leads to desired decrease in fat, protein and lactose concentrations in modifi ed MS. The other compo-sition (minerals, organic acids) should approach the composition of original milk. The change of in-terference eff ects for IR analysis should be minimal. For instance the measurable signals and in this way also possible interference eff ects of minority milk components such as urea and citric acid on infra-red milk analysis are marked in results more papers (Grappin, 1987; Hanuš et al., 1995 b, 2001, 2008 b, 2009 a, b; Hering et al., 2008).
The measurement results of milk composition by the indirect method of IR spectrophotometry can be infl uenced by interference eff ects. Average in-tereference eff ects are automatically compensated by the technical solution of the method. These
in-terference eff ects are caused by mutual interactions of milk components in simultaneous measurement. The changes in interference eff ects can be caused by milk components which have been manipulated. These eff ects are known but missing is detailed in-formation about their size or dependence on quan-tity of manipulated components.
The hypothesis tested was that it was possible to increase the calibration quality of indirect analytical method (IR analysis) for reliability of measurement of concrete milk components via compensation of possible negative interference eff ect caused by mo-di fi ca tion changes in milk matrix during the prepa-ration of RCSs. This could be successfully done by verifying targeted method for modifi cation of milk RCSs in terms of composition. Hence the goal of this study was to verify and balance the impact of specifi c dilution for reduction in main milk com-ponents in RCSs, which are intended for IR analy-sis calibration, into milk matrix via manipulation in the soluble composition of cow milk.
MATERIAL AND METHODS
Experimental sample preparation Cow milk RCS was prepared with targeted de-creased fat, protein and lactose content for calibra-tion of IR analyzer. The milk dilucalibra-tion was carried out using: distilled water; NaCl solution; solution of other matter composition (SC). This was based on the rationale of approximating the percentage of main mineral and other minority non-protein ni-trogen matter and organic acids in milk as much as possible (Tab. I). The replacement of distilled wa-ter by NaCl solution was made to balance the de-crease in mineral matter caused due to sample dilu-tion. The total mineral concentration approximated the original concentration a er sample treatment al-though the composition was a little diff erent. The ef-fort to minimize the interference eff ect changes and maximize the analytical improvement of method led consequently to proposed SC which should cor-respond to original milk as much as possible.
A row of six MSs was prepared with original fat content from 3.61 to 6.94%. This row was marked as set 1 (original set). Three further sets (Tab. II) were prepared from this original row as follows: – set 2 (water): six MSs of original set were diluted by dis-tilled water in the ratio milk/water 4/1; – set 3 (NaCl): six MSs of set 1 was diluted by NaCl solution (4 g / l
I: Specifi c composition (SC) used for preparation of reference milk sample (MS) set 4
Component Mass [g/l]
NaCl 1.1450
KCl 0.8490
K2HPO4 1.8463
Citric acid (anhydride) 1.7000
of distilled water) in the ratio 4 / 1; – set 4 (specifi c composition; SC): six MSs of set 1 was diluted by salt solution (NaCl, KCl, K2HPO4), citric acid (anhydride) and urea (Tab. I) in the ratio 4 / 1. The followed indi-cators were measured and compared to characteri-zation of modifi ed MSs in terms of mineral compo-sition: milk freezing point (MFP, °C); osmolality (OS, mOsmol / kg); electrical conductivity (EC, mS / cm).
Analytical methods
The following milk indicators were investigated in the MSs sets: somatic cell count (SCC, thousand / ml); fat (F, %); crude protein (CP, %); lactose monohydrate (L, %); solid non fat (SNF, %). The SCC was deter-mined by Fossomatic 90 (Foss Electric, Denmark) ac-cording to ČSN EN ISO 13366-3. The extensive com-bined result uncertainty (UN) was ± 9.3% for SCC < 900 thousands/ml. F, CP, L and SNF were meas-ured via instrument MilkoScan 133B (Foss Electric, Denmark), which was regularly calibrated accord-II: Means of indicators of MS sets and diff erences modifi ed set – original set
SS 1 2 3 4 TVDSs
F (%) 5.35 ± 1.108 4.35 ± 0.892 4.34 ± 0.891 4.38 ± 0.885 4.31
CP (%) 3.203 ± 0.009 2.58 ± 0.011 2.58 ± 0.007 2.60 ± 0.007 2.58
L (%) 4.675 ± 0.109 3.71 ± 0.100 3.72 ± 0.094 3.69 ± 0.091 3.76
SNF (%) 8.43 ± 0.099 6.83 ± 0.087 6.84 ± 0.087 6.83 ± 0.089
SCC (ths./ml) 652.5 ± 243.505 681.83 ± 264.073 719.67 ± 266.450 738.00 ± 278.409
log SCC 2.781 ± 0.1754 2.7900 ± 0.1929 2.8179 ± 0.1989 2.8400 ± 0.1932
EC (mS/cm) 4.25 ± 0.024 3.75 ± 0.052 4.69 ± 0.053 4.48 ± 0.039
MFP (°C) −0.5559 ± 0.0119 −0.4369 ± 0.0098 −0.4903 ± 0.0121 −0.4788 ± 0.0111
OS (mOsmol/kg) 274.5 ± 2.930 217.83 ± 2.267 245.33 ± 2.687 237.83 ± 2.911
OS 2 (mOsmol/kg) 290.4 ± 6.277 240.6 ± 5.155 268.6 ± 6.361 262.5 ± 5.841
diff erence modifi ed – original
F (%) −1.00 ± 0.216 −1.01 ± 0.217 −0.97 ± 0.223
CP (%) −0.62 ± 0.002 −0.62 ± 0.002 −0.60 ± 0.002
L (%) −0.97 ± 0.009 −0.96 ± 0.015 −0.99 ± 0.018
SNF (%) −1.60 ± 0.012 −1.59 ± 0.012 −1.60 ± 0.010
SCC (ths./ml) 29.33 ± 20.568 67.17 ± 22.945 85.50 ± 34.904
log SCC 0.01 ± 0.0175 0.04 ± 0.0235 0.06 ± 0.0178
EC (mS/cm) −0.50 ± 0.029 0.44 ± 0.030 0.23 ± 0.016
MFP (°C) 0.1190 ± 0.0021 0.0656 ± 0.0002 0.0771 ± 0.0008
OS (mOsmol/kg) −56.67 ± 0.663 −29.17 ± 0.243 −36.67 ± 0.019
OS 2 (mOsmol/kg) −49.80 ± 1.122 −21.80 ± 0.084 −27.90 ± 0.436
pair t-test: original versus modifi ed
F (%) *** *** ***
CP (%) *** *** ***
L (%) *** *** ***
SNF (%) *** *** ***
SCC (ths./ml) ns ns *
log SCC ns ns *
EC (mS/cm) *** *** ***
MFP (°C) *** *** ***
OS (mOsmol/kg) *** *** ***
OS 2 (mOsmol/kg) *** *** ***
ing to the reference method results (ČSN 57 0536; the Röse-Gottlieb’s method for fat content, Kjel-dahl’s method for crude protein content and po-larimetric and gravimetric methods for lactose and SNF contents (ČSN 57 0530)). The UNs are shown in Tab. III. OS was investigated using a Roebling os-mometer with thermistor probe principle (Hermann Roebling Messtechnik, Berlin, Germany). This was calibrated according to relevant solutions. Further the osmolality values were calculated on the basis of MFP according to relevant recalculation equa-tion freezing point of concentraequa-tion row of urea so-lutions with known molality. These were marked as osmolality (OS) 2. MFP values were analysed us-ing the cryoscopic instrument Cryo-Star automatic (Funke-Gerber, Germany). The selected measure-ment mood was Plateau Search (with parameters: interval = 23 seconds and delta t = 0.4 m°C). Instru-ment was regularly calibrated using standard NaCl solutions. The UN was ± 0.00608 °C, it means ± 1.18%. EC was measured using OK 102/1 (Radelkis, Hungary) conductometer at 20 °C (in mS×cm−1) with help of the geometrical exactly defi ned bell glass electrode with the platinum ring contacts. The in-strument was calibrated by the relevant salt (KCl) so-lution (10.2 mS×cm−1) at the measurement of each milk sample set.
Statistical evaluation
The average values of investigated indicators were calculated for each set much like the diff erences between values of the original set and modifi ed sets. These values of modifi ed sets were tested used the paired t-test against original set of MSs (Tab. II). The diff erence in values of individual sets and origi-nal set were used for characterization of single sets and their mutual comparison to determine whether the added NaCl solution or SC solution infl uenced the properties of single sample sets. The paired t-test was carried out at SC versus sets 2 and 3 for F, CP and L contents.
RESULTS AND DISCUSSION
Basic comparison of milk indicators of sample sets
Characteristics of milk composition and properties of single sample sets are shown in Tab. II. The mu-tual comparison of results of modifi ed RCSs via MFP, OS and EC determination was used for investi-gation the importance of all changes from the origi-nal milk matrix. The goal was not to cause deviations in mentioned measurements by manipulations. It is presumed that the changes in possible interference eff ects on IR analysis were minimal. Results of MFP and closely related OS and EC are tight connected to main mineral and other minority non-protein nitro-gen matters and organic acids (buff er system) in milk (Freeman and Bucy, 1967; Demott, 1969; Eisses and Zee, 1980; Brouwer, 1981; Walstra and Jenness, 1984; Koops et al., 1989; Bauch et al., 1993; Wiedemann et al., 1993; Buchberger, 1990, 1994). The ave ra ge diff e ren-ces between original set and sets 2 and 3 were insig-nifi cant for SCC and log SCC va lues. The SCC and log SCC diff erence between original set (1) and set 4 (SC) was signifi cant (P < 0.05). The values were sig ni-fi cant ly diff erent (P < 0.001) for EC, OS, MFP and also for other indicators as F, CP, L and SNF. The evalua-tion shows the result of manipulating the design in MSs. In set 3 (NaCl) that va lues F, CP and L were dif-ferent (P < 0.001) from values of set 4 while in set 2 (water) were diff erent (P < 0.05) for F and L and also for CP (P < 0.01; Tab. III).
The comparison of MFP, OS and EC values as most important characteristics in terms of mineral sample composition between single
sets
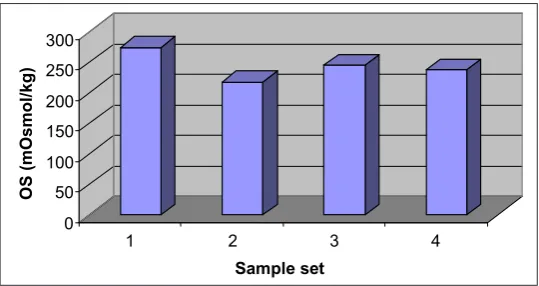
Set 1 showed the lowest values of MFP and OS −0.5559 °C and 274.5 mOsmol / kg (Tab. II, Fig. 1, 3). The MFP value increased to −0.4369 °C and OS value decreased to 217.83 mOsmol / kg due to addition of distilled water in set 2. The MFP value decreased again (−0.4903 °C) and approached the value of MS (set 1) by NaCl solution addition (set 3) in lieu of wa-ter. However, the original value was not reached be-cause L in sample was decreased. The L be-causes MFP depression by 54% in contrast to NaCl which to-gether with other mineral salts cause 30.5% (Walstra and Jenness, 1984). The MFP was only −0.4788 °C in set 4 due to SC addition. The decrease is smaller than for NaCl. It is possible to explain this by the fact that NaCl concentration was lower in the SC. However other salts (Tab. I), citric acid and urea were present. For instance the quantity of supplied NaCl is equal to 68.4 mmol / l in set 3 while in SC set the total quan-III: The extensive combined uncertainties (UNs) of measurement results of individual indicators for the Milkoscan 133B apparatus (95% of probability level)
Component Fat Crude protein Lactose
UNs (%) relative ± 2.77 ± 2.59 ± 2.37
UNs (%) absolute ± 0.101 ± 0.085 ± 0.115
IV: Diff erences between averages of set 4 (composition) and set 2 and set 3
SS 2
Water
3 NaCl
F (%) * ***
CP (%) ** ***
L (%) * ***
tity of mineral salts, citric acid and urea was equal to 55.44 mmol / l. The NaCl matter amount in SC was only 19.6 mmol / l. The ability of other components of composition (K2HPO4, KCl, citric acid and urea) to reduce MFP was less than for alone NaCl alone. The EC was highest in set 3 (4.69 mS / cm; Tab. II,
Fig. 2) and for set 4 was lower (4.48 mS / cm), the dif-ference was signifi cant (P < 0.001). Set 1 reached EC in about 4.27 mS / cm. In total from mineral quan-tity point of view set 4 was nearest to the original MS. The values of both solutions were diff erent (P < 0.001) from original MS.
–0.6 –0.5 –0.4 –0.3 –0.2 –0.1 0
MFP (°C)
1 2 3 4
Sample set
1: Milk freezing point (MFP) averages of original and modified MS sets
MS sets (x axis): set 1 (original milk); 2 (milk diluted by distilled water); 3 (milk diluted by NaCl solution); 4 (milk diluted by solution of specifi c composition (SC) of mineral salts, urea and citric acid (Tab. I)).
0 1 2 3 4 5
EC (mS/cm)
1 2 3 4
Sample set
2: Electrical conductivity (EC) averages of original and modified MS sets
MS sets (x axis): set 1 (original milk); 2 (milk diluted by distilled water); 3 (milk diluted by NaCl solution); 4 (milk diluted by solution of specifi c composition (SC) of mineral salts, urea and citric acid (Tab. I)).
0 50 100 150 200 250 300
OS (mOsmol/kg)
1 2 3 4
Sample set
3: Osmolality (OS) averages of original and modified MS sets
The theoretical calculation fat, protein and lactose in sample diluted by distilled water
(set 2)
Theoretical values of F, CP and L in set 2 were calculated to discover the interference eff ects of added (missing) minerals in the reference milk sam-ple. The calculation was carried out on the basis of known composition of original sample set and exact volume (ratio milk/water) of added distilled water into MSs in set 2. Knowledge of theoretical F, CP and L contents in set 2 allows us to discover the inaccu-racies in infraanalyzer measurement which could be caused by possible changed interference eff ects. These could be determined by comparison with real measured values and also by comparison with values which were measured in sets 2 and 3, since due to addition of NaCl or eventually SC solution the amounts of F, CP and L are not changed in these sets. In this way it is possible to determine the possi-ble eff ects of selected minerals, citric acid and urea on measurement accuracy.
Contents of F, CP and L in original sample were: 5.35; 3.20 and 4.68% (g/100g). Water addition cor-responded to 4/1 in the volume ratio milk/water. The concentrations of components in diluted milk were: F 4.18%; CP 2.50%; L 3.65%. The theoretical va-lues were compared with real measured vava-lues of F, CP and L contents in other sets (Tab. II). The cal-culated values (Tab. II) were lower than measured values. F theoretical value was 4.18% while for set 2 (water) and set 3 (NaCl) they were 4.35 and 4.34%. The average F 4.38% which is the value mostly dis-tant from calculated value was measured in the SC. CP values are more balanced between sets. The SC addition showed again the higher value (2.60%) than water (2.58), NaCl (2.58) and theoretical value (2.50%). On the contrary it is for L where the SC re-sult (set 4) 3.69% was the nearest to theoretical value (3.65%). The set 2 and 3 showed a little higher va lues (3.71 and 3.72%). The theoretical calculation did not
confi rm the harmony of calculated values with set 4. On the contrary set 4 values deviated from theoreti-cal values in the cases of F and CP. However, the dif-ferences between compared sets were very small (in the order of hundredths of %). However, it is also necessary to take the uncertainties of instrument measurement (UNs) into account in comparison (Tab. III). UNs were higher than the mentioned dif-ferences.
Main attention was paid to diff erences between original sample (set 1) and modifi ed sample in SC (set 4). Theoretically these procedures should ap-proximate their values as much as possible. As it was shown by MFP and OS values the set 2 (NaCl solu-tion) was near to original milk. However, it is possible to explain the fact that NaCl, which was contained in higher amount in set 3 than in set 4, participated in the MFP depression and in OS increase much more than other mineral matter contained in the SC. This is why the EC is a property which is considered the most important indirect indicator of milk mi ne-ral composition. EC values measured in set 4 were the nearest to original milk. We confi rmed that SC approaches in composition and properties the com-position of original milk in terms of appreciation of main soluble components.
CONCLUSIONS
The procedure described for balancing the inter-ference eff ects of milk matrix at manipulation with milk components in RCSs for IR analysis calibration is applicable. The reasons for application of proce-dure in RCS set preparation are two: 1) preclusion of deviation of mean interference eff ects of milk matrix in the framework of multicomponent simultaneous milk IR analysis; 2) stability assurance of buff ering system and capacity and also shelf-life of relevant RCSs for obtaining low values of calibration curves. More research and experiments are necessary.
SUMMARY
re-turned to original milk value by the addition of NaCl solutin. MFP was −0.4788 °C due to SC addition. The decrease was less than for NaCl. The ability of other SC components (K2HPO4, KCl, citric acid and urea) to MFP decrease is less than for NaCl solution. EC was highest for NaCl set 4.69 mS / cm, EC for SC was 4.48 mS / cm (P < 0.001). The original MSs set showed EC 4.27 mS / cm. The SC was the near-est to original value of MSs in terms of total mineral composition. EC values for both modifi cations diff ered (P < 0.001) from original MSs. The mentioned procedure is applicable for balance of in ter fe-ren ce eff ects of milk matrix because of relevant calibration of infra-red method with using of modi-fi ed milk samples. The method is important for laboratories which analyse raw milk in system of milk recording and milk quality control.
SOUHRN
Ověření modifi kovaného referenčního vzorku mléka ve smyslu jeho vhodnosti pro
kalibraci metody infračervené analýzy pomocí hodnocení fyzikálních vlastností
Znalost základního složení mléka je významná pro šlechtění skotu a také pro technologii v mlékárně a informaci spotřebitelů mléka. Rutinní mléčné analýzy za použití výkonné nepřímé infračervené metody jsou důležité pro řízení a kvalitu mléčného potravinového řetězce. Věrohodnost výsledků zá-visí na kvalitě kalibrace. Ke kalibraci je důležité použít sadu referenčních kalibračních vzorků (RCSs) s nezbytným oborem hodnot měřených mléčných ukazatelů. RCSs může být připravena prostřed-nictvím použití četných metod modifi kací, které se vyvarují poškození přirozeného složení mléka a změn interferenčních vlivů základní mléčné matrice pro zajištění správnosti kalibrace. Často jsou použity přídavky nebo odejmutí hlavních nebo minoritních složek mléka. Přídavek vody může být použit pro dosažení nižších složkových hodnot. Cílem této práce bylo vyvážit vlivy ředění mléka pro snížení koncentrace hlavních složek v RCSs pro dosažení minimálních změn interferenčních vlivů matrice. Vzorky kravského mléka (MSs) byly ředěny (4/1) za použití destilované vody, roztoku NaCl a roztoku se specifi ckým složením (SC; kvůli porušení v rovnováze v mléčné matrici (NaCl 1,145; KCl 0,849; K2HPO4 1,8463; kyselina citronová 1,7; močovina 0,3 g / l)) pro snížení hlavních mléčných slo-žek. Ve všech (původních i modifi kovaných) MSs byly měřeny tuk (F), hrubé bílkoviny (CP), laktóza (L), bod mrznutí mléka (MFP), osmolalita (OS) a elektrická vodivost (EC). Nejnižší MFP a OS byly v pů-vodním mléce −0,5559 °C a 274,5 mOsmol / kg. MFP byl zvýšen na −0,4369 °C a osmolalita snížena na 217,83 mOsmol / kg prostřednictvím přídavku vody. MFP byl snížen (−0,4903 °C) a navrácen k pů-vodní hodnotě mléka pomocí přídavku roztoku NaCl. MFP byl −0,4788 °C v důsledku přídavku roz-toku SC. Pokles byl menší než pro roztok NaCl. Schopnost ostatních složek SC (K2HPO4, KCl, kyse-lina citronová a močovina) k poklesu MFP je menší než pro roztok NaCl. EC byla nejvyšší pro soubor NaCl 4,69 mS / cm, EC pro SC byla 4,48 mS / cm (P < 0,001). Původní sada MSs ukázala EC 4,27 mS / cm. Roztok SC byl nejblíže k původní hodnotě MSs ve smyslu celkového minerálního složení. Hodnoty EC se lišily od původních MSs pro obě modifi kace (P < 0,001). Uvedený postup je použitelný pro vy-vážení interferenčních vlivů mléčné matrice pro správnou kalibraci infračervené metody s použitím modifi kovaných vzorků mléka. Metoda je důležitá pro laboratoře analyzující syrové mléko v kontrole užitkovosti a kontrole kvality mléka.mléko, interferenční vliv, složení, bod mrznutí mléka, osmolalita, elektrická vodivost Acknowledgment
This work was supported by the research projects MSM 2678846201, ME 09081 and QF 3019 and was provided in frame of research activities of NRL-RM in Rapotín.
REFERENCES
BAUCH, W., HUBER, B., BUCHBERGER, J., 1993: Zum Einfl uss einiger Parameter auf die Bestim-mung des Gefrierpunktes von Milk mit den Cryo-star II – LC. Dtsch. Milchwirtsch. Zeit., Lebensmit-tel und Milchwirtscha , 114, 5, 112–114.
BIJGAART VAN DEN, H., 2006: New applications of mid-infra-red spectrometry for the analysis of milk and milk products. 2 Free fatty acids. IDF Bul-letin, 406, 22–28.
BROUTIN, P. J., 2006: New applications of mid-in-fra-red spectrometry for the analysis of milk and milk products. 1 Casein. IDF Bulletin, 406, 2–21.
BROUWER, T., 1981: Calculations concerning the determination of the freezing-point depres-sion of milk. Neth. Milk Dairy J., 35.
BUCHBERGER, J., 1990: Ursachen von Überschrei-tungen des Grenzwertes von −0,515 °C beim Ge-frierpunkt der Milch. Schule und Beratung, IV–8–10, 9–10.
BUCHBERGER, J., 1994: Zum Gefrierpunkt der Milch: Bewertung und Interpretation. Dtsch. Milchwirtsch. Zeit., 115, 8, 376–383.
EISSES, J., ZEE, B., 1980: The freezing point of au-tentic cow’s milk and farm tank milk in the Ne-ther lands. Neth. Milk Dairy J., 34, 162–180. FREEMAN, T. R., BUCY, J. L., 1967: Distribution of
milk freezing points in authentic herd samples. J. Dairy Sci., 50, 6, 951.
GRAPPIN, R., 1987: Application of indirect instru-mental methods to the measurement of fat and protein content of ewes and goats milk. Bulletin of IDF, Doc. 208, 41–43.
HANUŠ, O., FICNAR, J., KOPECKÝ, J., JEDEL-SKÁ, R., BERANOVÁ, A., HAVLÍČKOVÁ, K., 1997: A retrospective study of results and evolu-tion of methodical design for preparaevolu-tion of urea milk calibration standard sets. (In Czech) Výzkum v chovu skotu / Cattle Research, 2, 7–21.
HANUŠ, O., FICNAR, J., JEDELSKÁ, R., KO-PECKÝ, J., BERANOVÁ, A., GABRIEL, B., 1995 a: Me tho di cal problems of nitrogen matters deter-mination in cow’s milk. Vet. Med. – Czech, 40, 12, 387–396. (In Czech)
HANUŠ, O., GENČUROVÁ, V., GABRIEL, B., 1992: The eff ect of sample aging on the accuracy of an infrared analysis of basic milk composition. Vet. Med. – Czech, 37, 149–160. (In Czech)
HANUŠ, O., HERING, P., MOTYČKA, Z., JEDEL-SKÁ, R., 2002: Eff ect of milk samples freezing on practical interpretationability of individual so-matic cell counts. Výzkum v chovu skotu / Cattle Research, 2, 9–13. (In Czech)
HANUŠ, O., GENČUROVÁ, V., YONG, T., KU-ČERA, J., ŠTOLC, L., JEDELSKÁ, R., KOPECKÝ, J., 2009 a: Reference and indirect instrumental deter-mination of basic milk composition and somatic cell count in various species of mammals. Sci. Ag-ric. Bohem., 40, 4, 196–203.
HANUŠ, O., HERING, P., FRELICH, J., JÍLEK, M., GENČUROVÁ, V., JEDELSKÁ, R., 2008 b: Re lia-bi li ty of milk urea analyse results by various me-thods in use of artifi cial milk control samples. Czech J. Anim. Sci., 53, 4, 156–165.
HANUŠ, O., HULOVÁ, I., GENČUROVÁ, V., ŠTOLC, L., KUČERA, J., KOPECKÝ, J., JEDEL-SKÁ, R., MOTYČKA, Z., 2009 B: Result interpreta-tion of experimental calibrainterpreta-tion for milk citric acid determination via infra-red spectroscopy (MIR-FT). (In Czech) Acta univ. agric. et silvic. Mendel. Brun., LVII, 5, 87–101. (In Czech)
HANUŠ, O., JÍLEK, M., FICNAR, J., BERANOVÁ, A., JEDELSKÁ, R., HAVLÍČKOVÁ, K., MÍČOVÁ, Z., 1995 b: Ways of preparing standards for calibra-tion of indirect methods of determinacalibra-tion of urea concentration in milk. Živoč. Výr. / Czech J. Anim. Sci., 40, 10, 441–451. (In Czech)
HANUŠ, O., KLIMEŠ, M., MIHULA, P., KOZÁ-KOVÁ, A., JEDELSKÁ, R., 2003: Impacts of the sampling of milk and the basic milk treatment on its freezing point and other compositional pa-rameters. Výzkum v chovu skotu / Cattle Research, 4, 10–17. (In Czech)
HANUŠ, O., SKYVA, J., HOFBAUER, J., KLOP-ČIČ, M., GENČUROVÁ, V., JEDELSKÁ, R., 2001:
Reliability of analytical methods applicable at milk urea determination. Acta univ. agric. et silvic. Men-del. Brun., XLIX, 3, 143–154. (In Czech)
HANUŠ, O., VEGRICHT, J., FRELICH, J., MA-CEK, A., BJELKA, M., LOUDA, F., JANŮ, L., 2008 a: Analyse of raw cow milk quality according to free fatty acids contents in the Czech Republic. Czech J. Anim. Sci., 53, 1, 17–30.
HERING, P., HANUŠ, O., FRELICH, J., PYTLOUN, J., MACEK, A., JANŮ, L., KOPECKÝ, J., 2008: Rela-tionships between the results of various methods of urea analysis in native and enriched milk. Czech J. Anim. Sci., 53, 2, 64–76.
JANKOVSKÁ, R., ŠUSTOVÁ, K., 2003: Analysis of cow milk by near-infrared spectroscopy. Czech J. Food Sci., 21, 4, 123–128.
KERKHOF MOGOT, M. F., KOOPS, J., NEETER, R., SLANGEN, K. J., HEMERT VAN, H., KOOY-MAN, O., WOOLDRIK, H., 1982: Routine testing of farm tank milk with the Milko-Scan 203. 1. Ca-li bra tion procedure and small-scale experiments. Neth. Milk Dairy J., 36, 115–130.
KOOPS, J., KERKHOF MOGOT, M. F., VAN HE-MERT, H., 1989: Routine testing of farm tank milk by infra-red analysis. IV Prediction of the freezing-point depression from infra-red measurements and conductivity. Neth. Milk Dairy J., 43, 3–16. KRÁČMAR, S., JANKOVSKÁ, R., ŠUSTOVÁ, K.,
KUCHTÍK, J., ZEMAN, J., 2004: Analysis of amino acid composition of sheep colostrum by near-in-frared spectroscopy. Czech J. Anim. Sci., 49, 5, 177–182.
KUKAČKOVÁ, O., ČURDA, L., JINDŘICH, J., 2000: Multivariate calibration of raw cow milk using NIR spectroscopy. Czech J. Food Sci., 18, 1, 1–4.
SJAUNJA, L. O., 1984 a: Studies on milk analysis of individual cow milk samples. I. Infrared spectro-photometry for analysis of fat, protein and lactose in milk. Acta Agric. Scand., 34, 249–259.
SJAUNJA, L. O., 1984 b: Studies on milk analysis of individual cow milk samples. II. Factors aff ecting milk analyses by infrared technique under labora-tory conditions. Acta Agric. Scand., 34, 260–272. SJAUNJA, L. O., 1984 c: Studies on milk analysis of
individual cow milk samples. III. The eff ect of dif-ferent treatments on infrared analyses. Acta Agric. Scand., 34, 273–285.
SJAUNJA, L. O., PHILIPSSON, J., LUNDSTRÖM, K., SWENSSON, C., 1984: Studies on milk analysis of individual cow milk samples. IV. Factors aff ecting milk analyses in a routine system by automated apparatuses. Acta Agric. Scand., 34, 286–299. SJAUNJA, L. O., ANDERSSON, I., 1985: Laboratory
experiments with a new infrared (IR) milk ana-lyzer, the Milko-Scan 605. Acta Agric. Scand., 35, 345–352.
ŠUSTOVÁ, K., RŮŽIČKOVÁ, J., KUCHTÍK, J., 2007: Application of FT near spectroscopy for determi-nation of true protein and casein in milk. Czech J. Anim. Sci., 52, 9, 284–291.
TSENKOVA, R., ATANASSOVA, S., ITOH, K., OZAKI, Y., TOYODA, K., 2000: Near infrared spec-troscopy for biomonitoring: Cow milk composi-tion measurement in a spectral region from 1,100 to 2,400 nanometers. J. Anim. Sci., 78, 515–522.
WALSTRA, P., JENNESS, R., 1984: Dairy Chemistry and Physics, New York – Chichester – Brisbane – Toronto – Singapore, 344.
WIEDEMANN, M., BUCHBERGER, J., KLOSTER-MEYER, H., 1993: Ursachen für anomale Gefrier-punkte der Rohmilch. Dtsch. Milchwirtsch. Zeit., 1 und 2. Mitteilung, 114, 22, 634–644, 114, 23, 656–663.
Address