_________
*Corresponding author’s e-mail: [email protected]
Study on Characteristic of Bed Material and
Bed Load Discharge in Sungai Jemberau, Tasik
Chini
Nadiatul Adilah A A Ghani1,2,N Syamimi Namim1, Norashikin A Kamal2, Duratul Ain
Tholibon3 and Junaidah Ariffin2
1Faculty of Civil Engineering and Earth Resources, Universiti Malaysia Pahang, Kuantan,
Pahang, Malaysia.
2Faculty of Civil Engineering, Universiti Teknologi Mara, Shah Alam, Selangor, Malaysia.
3Faculty of Civil Engineering, Universiti Teknologi MARA (UiTM), Jengka, Pahang,
Malaysia.
Tasik Chini is located in the state of Pahang about 100 km from Kuantan, the capital of the state of Pahang. Most of the lowland within the study area has been converted into agricultural and including rubber and oil palm plantations and mixed crops. This logging and mining activities gave impact to sediment characteristics and discharge. The purpose of this study was to identify the bed material characteristics and to determine the bed load discharge in Sungai Jemberau at Tasik Chini. Bed material sample was collect at Sungai Jemberau in 24 November 2016, 1 December 2016 and 5 March 2017. Bedload discharge also measured between these date. The bed load discharges also estimate by using Duboys and Schoklitsch equation to identify the suitable predicted method for this area. From the analysis of the results, Duboys Equation was more suitable to predict and estimate the bed load discharges for Sungai Jemberau at Tasik Chini because the predicted value closer to measured value.
Keywords: Bed Load, Characteristic, Discharge, Sungai Jemberau, Tasik Chini
I. INTRODUCTION
Sediment is the nonpoint source pollutants coming from a number of sources and washed into our waterways by surface runoff. When land disturbing activities occur, soil particles are transported by surface water movement. Soil particles transported by surface water movement are often deposited to streams, lakes, and wetlands, resulting to cross section and morphology changes, as well as bed load increase. The process of sediment deposition is also dependent on river discharge and speed of river flow. Thus, faster water velocity would
result in higher amount of sediment deposited. Human interference is one of the effects of sediment transport process that gives impacts on sediment load and bed load pattern. Vegetation removal from agricultural and logging activities is the main factor that will increase the erosion and sediment loads of rivers (Gasim et al., 2006).
Sediment transport is very sensitive to flow conditions and increases dramatically during floods, mining activities (Bettes, 2008).
Sediment can be transported by a flow of water. Sediment transport can be in the form of bed-load and suspended load, which are depending on the size of the bed material particles and the flow conditions. Factors which influence the sediment transport are flow conditions, sediment size and sediment density. Sediment transport not only depends on the characteristics of the flow but also depends on the properties of the sediment. According to Haddadchi (2013), the most important property of the sediment particle or grain is its size. Bed load is the stony material, such as gravel and cobbles that moves by rolling along the bed of a river because it is too heavy to be lifted into suspension by the current of the river. The measurement of bed load is extremely difficult. Most bed load movement occurs during periods of high discharge on steep gradients when the water level is high, and the flow is extremely turbulent.
The aim of this study is to identify the bed material characteristic and the bed load discharge in Sungai Jemberau at Tasik Chini. The characteristic of bed material was determined according to the size by using Udden Wentworth scale. Based on the results of bed material characteristics, Duboys and Schoklitsch equation was used to determine the most accurate predicted results compare to measured bed load discharge.
II. STUDY AREA
Tasik Chini recently has undergone devastating situation as a lake environment since 1984 or earlier due to development activities in the surrounding areas such as oil palm plantations and residential developments (Gasim et al., 2009). The conditions of Tasik Chini become worst when a small dam was built in 1995 to retain water in the lake for tourism purposes (Idris and Kutty, 2005).
Figure 1. Location of Sungai Jemberau in Tasik Chini
location of Sungai Jemberau which is one of the rivers that connect to Tasik Chini.
Figure 2 shows the view of logging and mining activities in the surrounding area of Sungai Jemberau which these could bring to the increment of sediment loadings in Sungai Jemberau. The activity in the surrounding areas of river will influence the sedimentation loading.
Figure 2. Land clearing and logging activities closed to Sungai Jemberau
III. MATERIALS AND METHODS
Sample of the bed material had been collected at the field site to be further testing in the soil laboratory. The test that had been conducted was sieve analysis to obtain the grain size for the bed material.
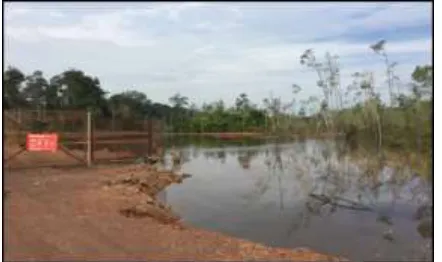
Other than that, flow velocity, and river depth also be measured during the sampling of bed material. The data collection for bed material sampling was done on 24th November 2016, 1st December 2016 and 5 March 2017. In January 2017 and February 2017, sample could not be collected as the site has been flooded start from end of December until end of February. Figure 3 show the view at Sungai Jemberau during flooding. The picture was taken on 2 February 2017.
Figure 3. Flooding and overflow at Sungai Jemberau on 2 February 2017
The grain size of bed material is analysed through the sieve analysis test in the soil laboratory. Grain size can be defined as the size of the bed material that is transported. The grain size of the sediments was determined using the standard dry and wet sieving techniques. Samples which consist of more than 90% sand were analyses using the dry sieving method. The sample was sieved using 5.000, 3.350, 2.000, 0.600, 0.212, 0.063 mm sieves sizes.
Unigranular materials (𝐷50 ):
Gs =86.7
√𝐷 𝑆
3
2 (𝑄 − 𝑇𝑊𝑞𝑜) (1)
Where;
Gs = Bed load discharge, lb/s
D = 𝐷0 (mean grain diameter), inches
S = The energy gradient, ft/ft
Q = The discharge ft3/𝑠
𝑇𝑊 = The width in ft
𝑄𝐶
=
The critical discharge, ft3/𝑠 per ft of width𝑞0
=
0.00532d/S43Duboys is one of the first successful developments of sediment discharge formula. Although the model of sediment transport was incomplete, the proposed relationship for bed load transport rate has been proven to be in good agreement with a large amount of experimental measurements.
The Duboys can be expressed as follows:
Gs = 𝐾𝜏0(𝜏0− 𝜏𝐶) (Eq. 2) Where;
𝐾 = Parameter dependent on the
thickness of the moving bed layer
𝜏𝐶
=
Critical shear stress
(𝜏0
−
𝜏𝐶)=Excess shear stressThe model is based on the assumptions that the bed material moves in layers of uniform thickness and the mean velocity of the layers increases linearly toward the bed surface.
IV. RESULTS AND DISCUSSIONS
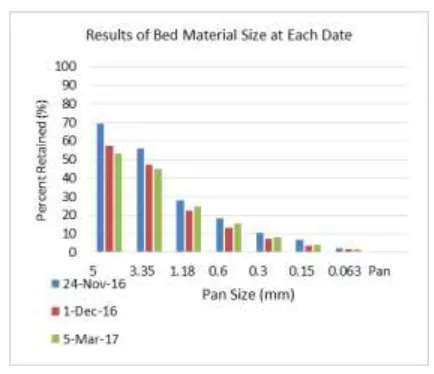
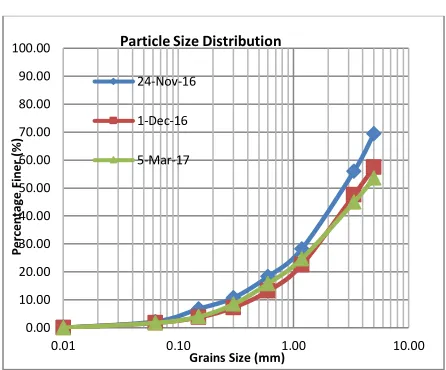
The particle size distribution was obtained for each different date. The particle size distribution is one of the important factors that affects the sediment transport in river (refer Figure 4).
According to Figure 5, by using Udden Wentworth scale, soil distribution was most retained at 5.00mm at the sieve pan. Most of the distributions of sample soil at each date were dominated by Fine Gravel which is the average of sediment particles is 4-8mm. The average of
particles size, (𝑑50)recorded between 2.75mm
and 4.20mm.
Figure 4. Bed material size on bed material sampling date
From the analysis in Figure 5, the median
value (𝑑50) of bed material size is 2.75 mm at
Sediment transport function was characterized by the median bed material size median or
particles size (𝑑50). Based on sieve analysis, the
medium grain size (𝑑50) has passing between
(1.18mm-3.35mm).
Figure 5. Particle Size Distribution
From the analysis, the median value (𝑑50) of bed material size size is 3.75mm at 1st December
2016. According to sieve analysis result, bed material sample was most retained at phi value (1-0) which is about 42.63%. Based on Wentworth scale, phi value (1-0) at sieve 0.600mm, it can be concluded that the bed material is Fine Gravel type. Sediment transport function was characterized by the median of bed material size or particles size (𝑑50). Based on
sieve analysis, the medium grain size (𝑑50) for this date has passing between (3.35mm-5.00mm).
From the analysis, the median value of bed material size (𝑑50) is 4.20mm at 5th March 2017. According to sieve analysis result, bed material sample most retained at phi value (1-0) which is about 37.95%. Based on Wentworth scale, phi value (-2 to -1) at sieve 0.600mm, it can be
concluded that the bed material is Fine Gravel type. Sediment transport function was characterized by the median size of bed material or particles size (𝑑50). Based on the sieve
analysis, the medium grain size (𝑑50) for this sample has passing between (3.35mm-5.00mm).
To determine the bed load prediction results, there were two different bed load equations used to evaluate bed load transport which were Schoklitsch and Duboys equation. Table 1 shows the particle size range and explanation for Duboys and Schoklitsch equation. Both of bed load equations are not suitable for sand bed type.
Table 1. Description of bed load equations used in this study
Name Size
(mm) Comments
Duboys 0.01-4.0
The formula is not applicable for sand-bed
streams that carry suspended load
Schoklitsch
0.30-5.0 that should not applied It is a bed load formula to sand-bed streams that carry considerable
bed sediments in suspension
Table 2 shows results of bed load discharge using Duboys and Schoklitsch equation. For Duboys equation, the highest and lowest discharges are 1.0435lb/sec and 0.0132lb/sec respectively. Meanwhile for Schoklitsch equation, the highest and lowest discharges are 5.5723lb/sec and 0.9090lb/sec respectively. The highest and lowest bed load discharge from both Duboys and Schoklitch are representing the same sample which Sample 3 on 5th March
0.00 10.00 20.00 30.00 40.00 50.00 60.00 70.00 80.00 90.00 100.00
0.01 0.10 1.00 10.00
Pe rc e n ta ge F in er (% )
Grains Size (mm) Particle Size Distribution
24-Nov-16
1-Dec-16
2018 (Rainy) and Sample 1 on 24th September
2016 (Sunny) respectively.
Table 2. Results of Bedload Discharge using DuBoys and Schoklitsch equation
Date Weather Duboys
(lb/sec) Schoklitsch (lb/sec)
24thSept
1st Dec
5th
March
Sunny Sunny Rainy
0.0132 0.4350 1.0435
0.9090 1.9835 5.5723
Table 3. Comparison between Measured and Predicted Bedload Discharge in Sungai Jemberau
Date Duboys
(lb/sec) Measured Bedload
(lb/sec) 24th Sept
1st Dec
5th March
0.0132 0.4350 1.0435
N/A N/A 1.08×10⁻⁵
From Table 3, the DuBoys gives better prediction of bed load discharge in Sungai Jemberau which the equation is applicable for gravel type sediment and the prediction result are more closely to the measured result. The Duboys equations are developed from abroad and considered river from there. Consequently, the result over predicted from measured data.
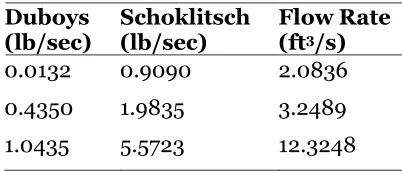
Table 4. Flow Rate versus Predicted Bedload Discharge in Sungai Jemberau Duboys
(lb/sec) Schoklitsch (lb/sec) Flow Rate (ft3/s)
0.0132 0.4350 1.0435
0.9090 1.9835 5.5723
2.0836 3.2489 12.3248
IV. SUMMARY
In conclusion, the size and types of bed material were identified at Sungai Jemberau, Tasik Chini. The bed load discharge was evaluated using two different formulas which were Schoklitsch and Duboys equations. From the analysis of the results of each of the formula, Duboys can be used to predict bed load transport for Sungai Jemberau as it is suitable for uniform sediments with specific gravity that are varying from 1.25 to 4. The particle size range for the Duboys is between 0.01 – 4.0mm. This result also shows that Duboys gives a better and reliable prediction for bed load discharge and concentration at Sungai Jemberau. The bed load results predicted by Duboys equation shows that there were increasing value of bed load discharge happen in Sungai Jemberau after that area had facing a flooding situation. The size of bed material also increases from 2.75mm in 24 November 2016 to 4.2mm in 5 March 2017. After flood, Sungai Jemberau also becomes wider due to the erosion and riverbank failure at that area.
V. ACKNOWLEDGMENT
[1] Bettes, R. (2008). Sediment Transport &Alluvial Resistances in rivers. Environment Agency
[2] Gasim, M.B., Toriman, E., Rahim, S.A., Islam, M.S., Chek, T.C. &Juahir, H. (2006).
“Hydrology, Water Quality and Land Used Assessment of TasikChini’s Feeder Rivers”,
Pahang, Malaysia, Malaysian Journal of Society and Space
[3] Gasim, M.B., Toriman, M.E., Rahman, Z.A.,
Islam, M.S. &Chek, T.C. (2009). “Flow
Characteristics of The TasikChini’s Feeder
Rivers, Pahang, Malaysia”, Bulletin of the
Geological Society of Malaysia 55.
[4] Haddadch, A. (2013). “Bedload Equation
Analysis Using Bed Load-Material Grain Size”,
Journal of Hydromech, vol. 2, pp. 241-249.
[5] Idris, M. &Kutty, A.A. (2005). “Trends of Physicochemical Water Quality in TasikChini”,