R E S E A R C H
Open Access
Managing large distributed dynamic
graphs for smart city network applications
Nadav Voloch
1,2*†, Noa Voloch - Bloch
2†and Yair Zadok
2*Correspondence:
†Nadav Voloch and Noa V. Bloch
contributed equally to this work. 1Department of Computer Science, Ben Gurion University of the Negev, 84105 Beer Sheva, Israel
2Dan School of High-Tech Studies, The Center of Academic Studies, Hayotsrim 2, 6021816 Or Yehuda, Israel
Abstract
Smart cities and traffic applications can be modelled by dynamic graphs for which vertices or edges can be added, removed or change their properties. In the smart city or trafficmonitoring problem, we wish to detect if a city dynamic graph maintains a certain local or global property. Monitoring city large dynamic graphs, is even more complicated. To treat the monitoring problem efficiently we divide a large city graph into sub-graphs. In thedistributed monitoring problemwe would like to define some local conditions for which the global city graph G maintains a certain property. Furthermore, we would like to detect if a local city change in a sub-graph affect a global graph property. Here we show that turning the graph into a non-trivial one by handling directed graphs, weighted graphs, graphs with nodes that contain different attributes or combinations of these aspects, can be integrated in known urban environment applications. These implementations are demonstrated here in two types of network applications: traffic network application and on-line social network smart city applications. We exemplify these two problems, show their experimental results and characterize efficient monitoring algorithms that can handle them.
Keywords: Graph theory, Distributed and parallel computing, Large dynamic graphs, Geographic graph applications, Fastest path problem, On-line social networks
Introduction
Using graphs for smart city network applications has a long history for improving our lives, as reviewed in Helbing et al. (2014), where the authors discussed different models of crowd disasters, and different useful approached to system behaviour that help handling those cases. Another aspect of improving human lives is also by devising smart coopera-tion strategies, as reviewed in Perc et al. (2017), where the authors review the advances in the understanding of human cooperation, focusing on spatial pattern formation and on the spatio-temporal dynamics of observed solutions. A key aspect of these applications are also the information cascades, as reviewed in Jalili and Perc (2017), where the authors review models that describe information cascades, that are dynamical processes in com-plex networks. These describe the spreading dynamics of campaigns, diseases, rumors, etc., which initially start from a node or a set of nodes in the network. A special emphasis is given to the role and consequences of node centrality. Different smart city applications, with the combination of social benefits are a topic of contemporary research in many papers over the last couple of years such as (Barzilai et al.2018), that handles social prior-ities in a smart junction with an algorithm that takes into consideration these priorprior-ities.
In the last decade the topic of large dynamic graphs became popular since it lies at the core of many modern smart city network applications. Managing these graphs in a dis-tributed manner is an efficient heuristic dealt with in many papers such as the ones of (Mondal and Deshpande2012; Yang et al.2012; Wang et al.2014; Gao et al.2014; Gon-zalez et al.2014). Large distributed dynamic (LDD) graphs creates a problem known as thedistributed monitoring problem, presented by Cormode et al. (2006), and dealt with by Babcock and Olston (2003), in which we wish to find if an LDD graph holds a certain global property, while its distributed sub-graphs are constantly changing, and might or might not hold this property locally. We denote a certain graph byG=(V,E), for which
v ∈ V ande ∈ E are the graphs’ vertices (having different entities), and graph connec-tions respectively. We denote a global graph property byT, which can set as a certain threshold. We denote the local graph properties (thresholds) byTiwherei≤kand k is
the number of sub-graphsGis distributed to. These sub-graphs are denoted by data-sets
D1,D2, ...Dk.
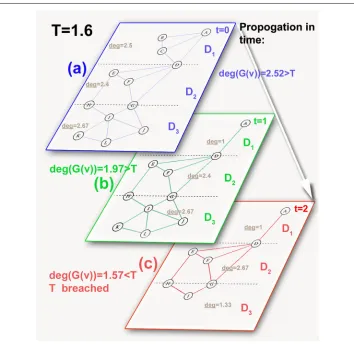
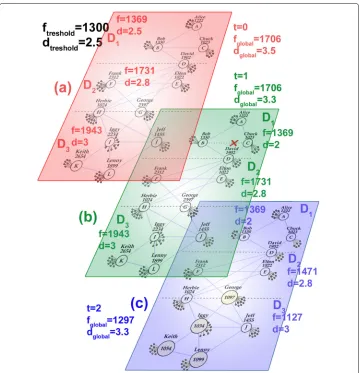
An example (described in Fig.1), shows an attribute which can be handled in a cer-tain graphGwhich isdeg(G(V))– the vertices average degree (number of edges incident to a vertex). At some starting point t = 0 Fig. 1 panel (a) deg(D1(V))|t=0 = 2.5,
deg(D2(V))|t=0=2.4 anddeg(D3(V))|t=0=2.67, givingdeg(G(V))|t=0=2.52, which is greater than some global thresholdT arbitrary set to be≥1.6.
If a change occurslocallyatt= 1minFig.1panel (b) for whichdeg(D1(V))|t=1 =1, meaning several edges in D1 (B, C) were removed, and the local threshold T1 was breached, but not the global T, since still deg(G(V))|t=1 = 1.97 > 1.6. If a breach of T3 could have also occurred at t = 2, for which deg(D3(V))|t=2 = 1.33, mean-ing several edges (J, K, L) inD3were removed. Now, the global T would breach since
deg(G(V))|t=2=1.57<1.6.
A recent progress in the area of distributed monitoring problem (Yehuda et al.2017) deals with classification between local sub-graphs breaches, trying to identify the ones that eventually lead to a global breach of the graph threshold T. This works established conventional graph analysis tools (e.g. non-linear properties of the regular LDD graphs, the number of triangles and the spectral gap) for detecting when T breaches. Moreover, several ways to handle non-trivial graphs have been suggested such as directed graphs, These non-trivial graphs include weighted graphs, graphs with nodes that contain differ-ent attributes, and combinations of these aspects (Lovász1993; Hoory et al.2006; Pavan et al.2013).
Here, we suggest that the aforementioned tools should be combined in managing traffic and on-line social smart city network (OSN) applications. We demonstrate: a) Finding when T breaches is actually a new way do detect the fastest route from a source vertex to a target vertex in a geographic dynamic graph, b) Finding when T breaches is a way to define communities in smart city OSN’s. The details, description, examples and solving algorithms of these applications are presented in the following parts of this paper.
Related work
Fig. 1A schematic global smart city graph breaching caused by a local breach. The attribute which is handled in a graphGisdeg(G(V))– the vertices average degree (number of edges incident to a vertex).aAt some starting pointt=0deg(D1(V))|t=0=2.5,deg(D2(V))|t=0=2.4 anddeg(D3(V))|t=0=2.67, giving
deg(G(V))|t=0=2.52, which is greater than the global graph thresholdTpreliminary set to be≥1.6.bA
change occurslocallyatt= 1minfor whichdeg(D1(V))|t=1=1, meaning several edges inD1(B, C) were
removed and the local thresholdT1was breached, however not the global T, since still
deg(G(V))|t=1=1.97>1.6.cA breach ofT3occurred att=2, in whichdeg(D3(V))|t=2=1.33, i.e., several
edges (J, K, L) inD3were removed. In this case the global T breaches sincedeg(G(V))|t=2=1.57<1.6
Traud et al. (2011); Fortunato (2009); Newman and Park (2003) and more specifically on Facebook in the research of (Ugander et al.2011).
Using LDD graphs for detecting the fastest path in a dynamic traffic graph Applying the fastest path problem to a traffic real-time application (such as Waze), involves configuring a much more diversified graph than the trivial one that has just ver-tices and edges. First of all, the graph has to be a directed one (traffic lane direction), and a weighted one, as the weight itself can be observed in two different aspects: physical distance or travel time. The vertices are different interest points- such as a gas station, a street, or any other place that has geographic coordinates.
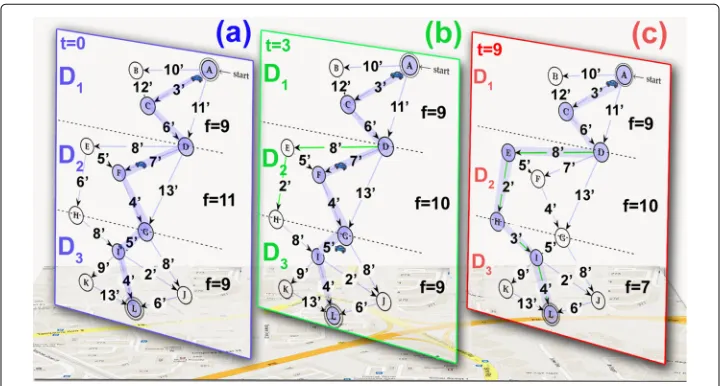
The main problem with this graph is that it is highly dynamic, i.e., its edges are con-stantly changing in time. The edges weights (considered as travel time) can increase (traffic load, accident) or decrease (traffic unload, road clearance). This creates a huge overhead for the calculations of the optimal real-time travel path. Distributing these graphs to LDD graphs is shown in Fig.2a, b, c. Each of these graphs include three sub-graph datasets (denoted byD1,D2andD3) which are the parts of a road map. The graph is directed (i.e the edges are all north-to-south), and the thresholdTis defined as to fastest route from source (vertex A) to target (vertex L). The fastest path is denoted by the path between the filled blue circles. The green paths indicate a change in the local fastest path. Notice here thatTcan be also dynamic, andTcan change as time goes by, and so does the source vertex (the car is constantly moving) although we ignore this in our analysis. The local Ti’s are also the fastest routes. At some starting point t=0, the global attribute, i.e., the fastest path isT =29min(the blue route), were the local thresholds areT1=9min,
T2=11min,T3=9min.
Fig. 2A local breach affect in a real-time traffic application. When a global graph property is breached, the fastest path changes correspondingly. The fastest path is emphasized by the solid blue line.aAtt=0 the global attribute, i.e. the fastest path isT=29minand the local thresholds areT1=9min,T2=11min,
T3=9min.bAt (t=3min) a local breach occurs and the edgeE−Hreduces its weight from 6minto 2min
changing the local thresholdT2from 11minto 10min(denoted by the green path). This local breach did not
affect the global graphT, since the total path time fromAtoLtroughE(A-C-D-E-H-I-L) 31minis still slower than the original path time 29min.cA local breach leading to a global graph breach and a path change. At t=9minthe edge H-I reduces its weight from 8minto 3min, changing the local thresholdT3from 9minto
The change in the graph after some time (att = 3min) is depicted in Fig.2b. A local change occurs, and the edgeE−Hreduces its weight from 6minto 2min, changing the local thresholdT2from 11minto 10min(denoted by the green path). This local breach didn’t break the global graphT, since the path time fromAtoLtroughE (A-C-D-E-H-I-L) will take 31minwhich is still slower than the original path time 29min. So when does a local change,Tichanges the globalT? Let’s examine an additional change described in
Fig.2c, that describesDiatt=9min. A change occurred att=9minand the edge H-I
reduces its weight from 8minto 3min, changing the local thresholdT3from 9minto 7min (green path). This breach also broke the globalT since the total path time is now faster, (26minis faster than 29min), thus the local path changes to the green one and global path is also updated from (A-C-D-E-H-I-L) to (A-C-D-F-G-I-L). It is important to state here that the distribution of the internal graphs (Gm’s) is done beforehand and is not part of the optimization process. The division must be equal in size for the generality of use-case and for no computational overheads of prediction evaluations of the networks big-data, keeping the algorithm complexity viable. This important feature of complexity simplicity also justifies the choice of linear dependency between local and global property. In cases of complex dynamic networks, some properties may be not linear, thus more complex to manifest in distributed algorithms such as the ones described above.
Algorithm for finding the fastest route in LDD graphs
Finding the fastest path in an LDD graph is quite complex since at each point we must consider all possible paths between the source and target vertice for eachDi(t). Based on
The algorithm efficiency is with agreement to PTT(G) algorithm which isO(EV + V2log2V). It is important to notice in the algorithm that the important variable of cur-rentPath holds the most efficient path in every time point, changing it according to the new paths iterated by the algorithm and compared to the current efficient one that it contains.
Algorithm explanation and complexity analysis
In stage 1 we find a new optional path time, by adding the time of the path from the cur-rent source to the source point ofDm, where the localTmwas breached, toTmand to the
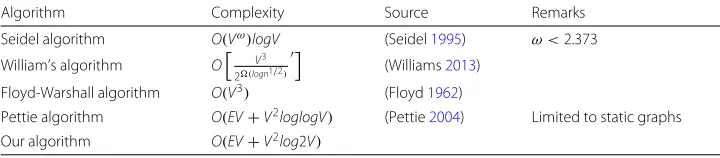
time of the path from the target point ofDmto the target point ofG. In this stage we run PTTtwice, achieving a running time ofO(EV+V2log2V). In stage 2 we create this new path described in stage 1, and in stage 3 we check if the new path is actually faster, mean-ing we check if the global T was breached. If so, we update both the current path and the global T. In stages 2 and 3 we have anO(1)complexity since the path is already set in stage 1. At the 4th and last stage we return the current path, whether it was changed or not, this stage is also ofO(1)complexity, setting the algorithm’s total time atO(EV +V2log2V). This performance is a good improvement to current algorithm for finding fastest path with these dynamic conditions. Table1shows a benchmark comparison of state-of-the-art current algorithm that handle the similar problem, we can see that our algorithm holds a better complexity from the existing ones, and resembles (Pettie2004), but ours gives the advantage of a dynamic one while the Pettie algorithm refers to static ones.
Algorithm completeness and correctness-Initialization
Fori=1, the invariant is respected: in the first iteration we check localTmsince it is the
only one that could have changed.
MaintenanceFori=m, given 1≤m≤n−1, without the loss of generality we takeDm
as the dataset currently handled. There are two possible cases for thismthiteration:
• newPathTime<f(D(k)), meaningT was breached and the current path is no longer the shortest one, but in that case we perform stages 1 and 2 in the algorithm and update the current path andT.
• newPathTime>f(D(k)), meaningT was not breached and the current path is still the shortest one, thus the invariant is preserved.
Algorithm completeness and correctness-Termination
At the last iteration, giveni=n, the two options mentioned above are similar forDn, and
respectivelyt(n), meaning in each of the options we get the minimal time for the current path, thus T remains the fastest path. Hence, the algorithm gives us the fastest route from the source point to the target.
Table 1A benchmark comparison for the algorithms’ performance
Algorithm Complexity Source Remarks
Seidel algorithm O(Vω)logV (Seidel1995) ω <2.373
William’s algorithm O V3
2(logn1/2)
(Williams2013)
Floyd-Warshall algorithm O(V3) (Floyd1962)
Pettie algorithm O(EV+V2loglogV) (Pettie2004) Limited to static graphs
More results of the algorithm
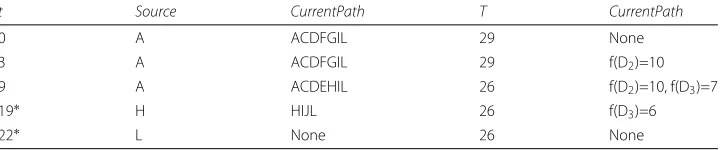
More results are shown in Table2, in which we see the better performance time of the algorithm in juxtaposition to the singular fastest path calculation (the beginning T). The results are organized by different time-stamps, and are a continuance of the case-study shown in Fig.2.
Implementation of LDD graphs to the problem of defining communities in smart cities online social networks
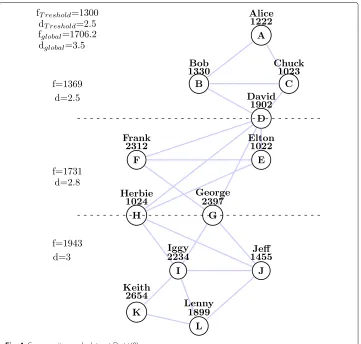
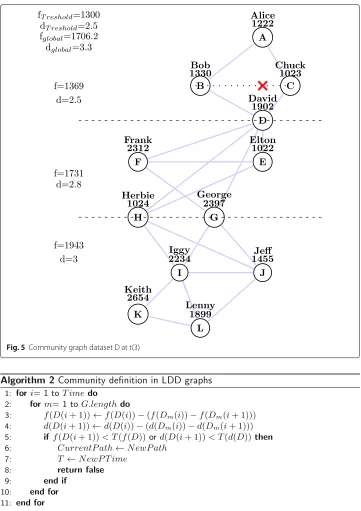
Monitoring the changes in a community graph Fig.3can be both private (for each user), and both global (for all users). Local changes can be the number of followers, work place, the number of friends. The global changes, can be the average number of relationships or other graph attributes. Distributing the community graph can help us monitoring thresh-old demand we wish to define on the graph. For example we can see in Fig. 4 “The influential rock-stars city events”, where we have three graph datasets (denoted byD1,D2 andD3) which are the parts of the community. The graphs edges are mutual city events participators (enhanced by geographical proximity), we focus on the numeric attribute of average number of followers for every user, as well as the users average number of inner-community friendships (the vertices degrees). We define entry-level conditions of 1000 followers per user, and at least 2 inner-community friendships. The global thresholdTis defined as an average of 1300 followers per user and an average of 2.5 inner-community friendships. The change in the graph after time goes by can be seen in Fig. 5, That describes D att=3min. A change occurred in this time space(0−3), and Bob partici-pators un-friended Chuck participartici-pators, changing the local average degree in D1from 2.5 to 2 which broke the local threshold of 2.5.
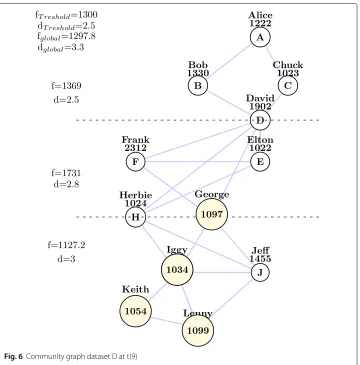
This change did not break T since the total average degree is still bigger than 2.5 (it changed from 3.5 to 3.33), thus the global community-defining conditions remains valid. When does a local change changesT? That we can see in Fig.6, that describes D at
t = 9min. Several changes occurred in this time space (3-9), and the number of avant participators of the Rock Stars inD3was reduces by 4900, changing the local average of followers from 1943.8 to 1127.2. This change broke T since the total average of followers is now smaller than 1300 (it is 1297.8), thus the community broke its defining conditions.
Algorithm and results for the problem of defining communities in an Online Social Network in LDD graphs
The main idea of the algorithm is to find if the global threshold T was breached. In this case we have two aspects of breaching: average number of followers, and average vertex
Table 2Dynamic community definition for an LDD graph, a better performance time of the algorithm in juxtaposition to the singular fastest path calculation (the beginning T)
t Source CurrentPath T CurrentPath
0 A ACDFGIL 29 None
3 A ACDFGIL 29 f(D2)=10
9 A ACDEHIL 26 f(D2)=10, f(D3)=7
19∗ H HIJL 26 f(D3)=6
22∗ L None 26 None
Fig. 3A local breach affect in a real-time smart city OSN application. The graph reviews real- time influential rock-stars events, distributed to three graph datasets (geographic regions) denoted byD1,D2andD3. The
graphs edges are friendships among events participators, and we focus on the numeric attribute of average number of participators of each event, as well as the users average number of inner-community friendships (the vertices degrees).aWe define entry-level conditions of 1000 followers per user, and at least 2
inner-community friendships. The global thresholdTis defined by the average of 1300 followers per user and an average of 2.5 inner-community friendships. The change in the graph after time goes by as can be seen in (b,c).bdescribes D att=1min. A change occurred in this time space(0−1), and Bob un-friended Chuck, changing the local average degree inD1from 2.5 to 2 which broke the local threshold of 2.5. This change did
not break T since the total average degree is still bigger than 2.5 (it changed from 3.5 to 3.33), thus the global community-defining conditions remained valid.cdescribes D att=2min. Several changes occurred in this time space (1-2), and the number of followers of the rock stars inD3was reduces by 4900, changing the local
average of followers from 1943.8 to 1127.2. This change broke T since the total average of followers is less than 1300 (1297.8), thus the community broke its defining conditions
degree, denoted before asf(D(k))andd(D(k))respectively. Notice that the i presented in the algorithm is that of the time-stamp iterations, andmis the dataset in which there is a local breach ofTm. The algorithm is as follows:
Fig. 4Community graph dataset D at t(0)
Algorithm explanation and complexity analysis
We can see that in stage 1, we update the globalf(D(i+1))with the local breach ofDmby
subtracting the change inf(Dm(i+1)), where the localTmwas breached. In stage 2 we do
the exact same thing, only withd(D(i+1)). Both of these stages have anO(V)complexity since every vertex is being checked. In stage 3 we check both of the aspectsf(D(i+1)) andd(D(i+1))and compare them to the globalT(f(D))andT(d(f(D))), to see if they were breached. If so, we return false, since the definition of community was breached. If not we return true in stage 4, meaning the community definition remains. Both of these stages are ofO(1)complexity (an atomic action of comparison), setting the algorithm’s total time atO(V).
Algorithm explanation and complexity analysis Initialization
Fori = 1, the invariant is respected: in the first iteration, we check thef(D(i))and
d(D(i)). Since we assume that in t(0) the community definition holds, we can move on to the other iterations.
Maintenance
Fori = k, given 1 ≤ k ≤ n−1, without the loss of generality we take Dm as the
dataset currently handled. There are four possible cases for thiskthiteration that we can
Fig. 5Community graph dataset D at t(3)
• f(D(k))−(f(Dm(k))−f(Dm(k+1))) <T(f(D))or
d(D(k))−(d(Dm(k))−d(Dm(k+1))) <T(d(D))meaning T was breached and the
definition of a community no longer holds, which cause in returning false. • f(D(k))−(f(Dm(k))−f(Dm(k+1)))≥T(f(D))and
d(D(k))−(d(Dm(k))−d(Dm(k+1)))≥T(d(D))meaning T was not breached and
the definition of a community holds, which cause in returning true. Thus the invariant is preserved.
Fig. 6Community graph dataset D at t(9)
At the last iteration, given i=n, the two options above are the same forDn, meaning in
each of the two options we get the answer whether T was breached or not, giving us a definitive result about the definition of a community.
More results of the algorithm
More results are shown in Table3, in which we see see at every point the change effect-ing or not effecteffect-ing T. The results are organized by different time-stamps, and are a continuance of the case-study shown in Figs.4,5and6.
Conclusions and future work
In this paper we presented a new approach for managing real-life applications using the methods presented inmonitoring LDD graphs problems. The first one is the geographic applications, for which the problem being monitored is the fastest path from a source
Table 3Dynamic community definition for an LDD graph
t f(D)/d(D)) Community T(f)/T(d) f(D)/d(D)
0 1706.2/3.5 True 1300/2.5 None/ None
1 1706.2/3.33 True 1300/2.5 None/ d(D1) = 2
2 1297.8/3.33 False 1300/2.5 f(D3)=1127.2/None
vertex to a target vertex. The second application is the smart city OSNs, in which the problem being monitored is the definition of a community established by a certain crite-ria of graph attributes. The different meanings of the threshold T for the aforementioned application were studied, and their interesting experimental results were shown, along with efficient monitoring algorithms that can handle them. The algorithms correctness and completeness were proven, and their complexities were analyzed. An interesting jux-taposition can be done with our model and a proposed approach applied to a real-case big network of Wang et al. (2018), that applies a deep learning perspective to a connected traf-fic flow prediction. While the traftraf-fic flow prediction smartly intertwines eftraf-ficient learning algorithms, the un-distributed network still has a high latency and overhead in com-parison with our distributed network model, that needs less data to discover important features and breaches of them in the network. Delving more into the problem of Monitor-ing Large Dynamic graphscan yield even more interesting results, or even more possible applications especially the ones that involve handling non-trivial graphs such as directed graphs, weighted graphs, graphs with nodes that contain different attributes, and com-binations of these aspects. A particularly interesting geographic application that we are currently developing is an algorithm for finding the fastest path in a distributed graph, that takes into consideration the future locations of traffic in the path, by using the graph multi-coloring method for scheduled connections shown in Bampas et al. (2015). OSN’s have even much more possible applications required in this field, such as security and access issues, communal popularity assessments, and fluid user networks. In this smart city OSN field we are currently developing access-control and information flow-control models, that use the distributed graph application presented in this paper. All of these subjects are currently being progressed.
Abbreviations
OSN: Online social network, examples facebook twitter; LDD: Large distributed dynamic graphs; PTT(G): Petit algorithm
Acknowledgements
The authors would like to thank Prof. Daniel Keren from Haifa University and Prof. Assaf Schuster from the Technion-Israel Institute of Technology for introducing him with the subject of monitoring attributes of Large Dynamic Distributed graphs.
Authors’ contributions
NB, NV and YZ analysed studied the subject, NB, NV wrote the paper. All authors read and approved the final manuscript.
Authors’ information Nadav Voloch
Is a Ph.D student and instructor in the computer science department in Ben- Gurion university, and a lecturer in the Dan school for high-tech studies, the center of academic studies, Or-Yehuda, Israel. His M.Sc in computer science is from the Open University in Israel. His research interests are graph algorithms, knapsack type problems, cryptography and control models for Online Social Networks.
Noa Voloch Bloch
Of High-Tech Studies, the Center for Academic Studies in Or-Yehuda, Israel. She received Ph.D and M.Sc from Tel Aviv university, Electrical Engineering Israel. She was a post doc researcher at the Hebrew University at the field of quantum optics. Her research interests include quantum optics and quantum computing, computational physics, wave propagation dynamics, accelerating beams.
Yair Zadok
Dr. Yair Zadok is the Dean of the Faculty of High-Tech Studies, Center for Academic Studies in Or-Yehuda, Israel. His Ph.D. is from the Babes-Bolyai University Cluj-Napuca, Romania, where his dissertation was on a Model of Guidance for the Instruction of Robotics by the Project-Based Learning Method. He is a senior researcher and lecturer in Web design programming methods, and is involved in different researches in Technological assimilation in Academic Environments. His Technological Education M.Sc in from the Ben-Guryon University of the Negev, and B.Sc in Mechanical Engineering from The Holon Institute of technology in Israel.
Funding
No funding.
Availability of data and materials
Competing interests
The authors declare that they have no competing interests.
Received: 17 April 2019 Accepted: 18 October 2019
References
Babcock B, Olston C (2003) Distributed top-k monitoring. In: Proceedings of the 2003 ACM SIGMOD International Conference on Management of Data, San Diego, California, USA, June 9-12, 2003. pp 28–39.https://doi.org/10.1145/ 872757.872764
Bampas E, Karousatou C, Pagourtzis A, Potika K (2015) Scheduling connections via path and edge multicoloring. In: Ad-hoc, Mobile, and Wireless Networks - 14th International Conference, ADHOC-NOW 2015, Athens, Greece, June 29 - July 1, 2015, Proceedings. pp 33–47.https://doi.org/10.1007/978-3-319-19662-6_3
Barzilai O, Voloch N, Hasgall A, Lavi Steiner O, Ahituv N (2018) Traffic control in a smart intersection by an algorithm with social priorities. Contemp Eng Sci 11:1499–1511.https://doi.org/10.12988/ces.2018.83126
Dijkstra EW (1959) A note on two problems in connexion with graphs. Numer Math 1(1):269–271.https://doi.org/10. 1007/BF01386390
Floyd RW (1962) Algorithm 97: Shortest path. Commun ACM 5(6):345.http://doi.acm.org/10.1145/367766.368168
Fortunato S (2009) Community detection in graphs. CoRR abs/0906:0612.http://arxiv.org/abs/0906.0612
Gao J, Zhou C, Zhou J, Yu JX (2014) Continuous pattern detection over billion-edge graph using distributed framework. In: 2014 IEEE 30th International Conference on Data Engineering. pp 556–567.https://doi.org/10.1109/icde.2014. 6816681
Gonzalez JE, Xin RS, Dave A, Crankshaw D, Franklin MJ, Stoica I (2014) Graphx: Graph processing in a distributed dataflow framework. In: 11th USENIX Symposium on Operating Systems Design and Implementation (OSDI), vol. 14. Broomfield, Berkeley. pp 599–613
Helbing D, Brockmann D, Chadefaux T, Donnay K, Blanke U, Woolley Meza O, Moussaïd M, Johansson A, Krause J, Schutte S, Perc M (2014) Saving human lives: What complexity science and information systems can contribute. J Stat Phys 158.https://doi.org/10.1007/s10955-014-1024-9
Hoory S, Linial N, Wigderson A (2006) Expander graphs and their applications. Bull Amer Math Soc:439–561
Jalili M, Perc M (2017) Information cascades in complex networks. J Complex Netw 5:665–693.https://doi.org/10.1093/ comnet/cnx019
Kadry S, Al-Taie MZ (2014) Social network analysis: An introduction with an extensive implementation to a large-scale online network using pajek. Bentham Science Publishers.https://doi.org/10.2174/97816080581811140101
Kenneth L, Cooke EH (1966) The shortest route through a network with time-dependent internodal transit times. J Math Anal Appl 14(3):493–498
Lauther U (2004) An extremely fast, exact algorithm for finding shortest paths in static networks with geographical background. Geoinformation und Mobilität-von der Forschung zur praktischen Anwendung 22:219–230 Lovász L (1993) Random walks on graphs: A survey. Combinatorics, Paul erdos is eighty 2(1):1–46
Mondal J, Deshpande A (2012) Managing large dynamic graphs efficiently.https://doi.org/10.1145/2213836.2213854
Newman MEJ, Park J (2003) Why social networks are different from other types of networks. Phys Rev E 68:036,122 de Nooy W (2012) Social Network Analysis, Graph Theoretical Approaches to. Springer New York, New York Pavan A, Tangwongsan K, Tirthapura S, Wu K (2013) Counting and sampling triangles from a graph stream. PVLDB
6(14):1870–1881.http://www.vldb.org/pvldb/vol6/p1870-aduri.pdf
Perc M, Jordan JJ, Rand DG, Wang Z, Boccaletti S, Szolnoki A (2017) Statistical physics of human cooperation. Phys Rep 687:1–51.https://doi.org/10.1016/j.physrep.2017.05.004.http://www.sciencedirect.com/science/article/pii/ S0370157317301424
Pettie S (2004) A new approach to all-pairs shortest paths on real-weighted graphs. Theor Comput Sci 312(1):47–74 Cormode G, Keralapura R, Ramamirtham J (2006) Communication-efficient distributed monitoring of thresholded counts,
Chicago.https://doi.org/10.1145/1142473.1142507
Seidel R (1995) On the all-pairs-shortest-path problem in unweighted undirected graphs. J Comput Syst Sci 51(3):400–403.https://doi.org/10.1006/jcss.1995.1078
Traud AL, Kelsic ED, Mucha PJ, Porter MA (2011) Comparing community structure to characteristics in online collegiate social networks. SIAM Rev 53(3):526–543
Ugander J, Karrer B, Backstrom L, Marlow C (2011) The anatomy of the facebook social graph. CoRR abs/1111 abs/1111.4503:4503
Wang L, Xiao Y, Shao B, Wang H (2014) How to partition a billion-node graph. In: IEEE 30th International Conference on Data Engineering, Chicago. pp 568–579.https://doi.org/10.1109/icde.2014.6816682
Wang W, Bai Y, Yu C, Gu Y, Feng P, Wang X, Wang R (2018) A network traffic flow prediction with deep learning approach for large-scale metropolitan area network. In: NOMS 2018 - 2018 IEEE/IFIP Network Operations and Management Symposium. pp 1–9.https://doi.org/10.1109/NOMS.2018.8406252
Williams R (2013) Faster all-pairs shortest paths via circuit complexity. CoRR abs/1312:6680.http://arxiv.org/abs/1312.6680
Yang S, Yan X, Zong B, Khan A (2012) Towards effective partition management for large graphs. In: Proceedings of the ACM SIGMOD International Conference on Management of Data, USA. pp 517–528.https://doi.org/10.1145/2213836. 2213895
Yehuda G, Keren D, Akaria I (2017) Monitoring properties of large, distributed, dynamic graphs. In: 2017 IEEE International Parallel and Distributed Processing Symposium, IPDPS USA. pp 2–11.https://doi.org/10.1109/ipdps.2017.123
Ziliaskopoulos A, Mahmassani H (1993) A time-dependent shortest path algorithm for real-time intelligent vehicle/highway system. Transp Res Rec J Transp Res Board 1408:94–100
Publisher’s Note