DOI:10.21276/ijprhs.2018.01.36
S Subramanian and Venkatesh CODEN (USA)-IJPRUR, e-ISSN: 2348-6465
Original Article
Formulation Development and Characterization of
Dasatinib Nanocrystals and Optimization using
Response Surface Methodology
Venkatesh Kyavars
1, Selvamuthukumar Subramanian
2,* 1Research Scholar, Department of Pharmacy, Faculty of Engineering and Technology, Annamalai University, Annamalai Nagar–608 002, Tamilnadu, India
2
Assistant Professor, Department of Pharmacy, Faculty of Engineering and Technology, Annamalai University, Annamalai Nagar–608 002, Tamilnadu, India
A R T I C L E I N F O A B S T R A C T
______
1. INTRODUCTION
Formulation of low soluble drugs is virtually arduous and intriguing tasks.1,2 Because of their high molecular weight and high lipophilicity normally more than 40% of them are poorly soluble in water.3 This insolubility of drugs limits their therapeutic outcome. To figure out this difficulty several attempts were made4 by using liposomes5, co-solvents6, solid dispersions7,8, micelles9, emulsions10 and inclusion complexes.11 On the other hand, these methods
International Journal of Pharma Research and Health Sciences
Available online at
www.pharmahealthsciences.net
Received: 19 Feb 2018 Accepted: 17 Mar 2018
Objective:Dasatinib (DST) is a Biopharmaceutical Classification System (BSC) Class II anti-cancer drug having very low solubility that limits the bioavailability. The purpose of study is to step-up bioavailability of DST. Methodology: Response surface methodology and Box– Behnken design were used for the optimization and the process parameters includes power of sonication (A), time of sonication (B) and temperature of sonication (C). Practical yield and particle size, two dependent variables were measured as responses. Results and Discussion: The optimization model forecasted a yield of 96.1366 % and particle size of about 150.039 nm with A, B and C levels of 252.55, 13.45 and 28.96 respectively. The practical responses of the optimized process were nearby to the forecasted values. DST nanocrystals under the optimized conditions gave rise to the mean diameter of 151 nm and zeta potential value of -24 mV. Irregular shape of nanocrystals with a size of 151 nm is confirmed by TEM image. The decreased crystallinity of nanocrystals was confirmed by X-ray diffraction (XRD) and differential scanning calorimetry (DSC).Conclusion: The results ofin vitro study shows that the dissolution rate and bioavailability of DST nanocrystals were enhanced compared with crude DST with the decrease in particle size.
Keywords: Dasatinib, Sonoprecipitation, Nanocrystals, Box-Behnken design, Crystallinity, in-vitro characterization.
Corresponding author * Selvamuthukumar Subramanian
Department of Pharmacy, Faculty of Engineering and Technology, Annamalai University, Annamalai Nagar–608 002, Tamilnadu, India
Int J Pharma Res Health Sci. 2018; 6 (1): 2295-02
have some limitations which restrict their application in solubilization studies for example for inclusion complexes a special molecular weight is required and for emulsions, oilphase is required. So to enhance the bioavailability there is a need to step-up dissolution rate and nanocrystals is one of such effective tool.
Nanoparticles which are crystalline in nature are called Nanocrystals and composed of pure drug and stabilizer. To avoid aggregation and to stabilize the Nanocrystals a stabilizer is added in the present research work.1,2
Dasatinib (N-(2-chloro-6-methylphenyl)-2-[[6-[4-(2-
hydroxyethyl)-1-piperazinyl]-2-methyl-4-pyrimidinyl]amino]-5-thiazole carboxamide monohydrate) (Figure 1) is an oral tyrosine kinase inhibitor (TKI) approved for the treatment of chronic myelogenous leukemia (CML) and Philadelphia chromosome-positive acute lymphoblastic leukemia.12Bioavailability of DST is 14 to 34%.1,2,13 In this study, DST nanocrystals were prepared using sonoprecipitation method to step-up dissolution rate and also to optimize the reaction conditions in order to maximize the yield and also to reduce the reaction time. Response surface methodology and Box–Behnken design is used for the optimization of the process parameters. Physical properties of pure DST and DST nanocrystals were characterized using several techniques such as scanning electronic microscopy (SEM), fourier transform-infrared spectroscopy (FTIR), DSC and XRD studies. The in vitro dissolution of DST and DST nanocrystals was compared.
2. MATERIALS AND METHODS
Chemicals and reagents
Dasatinib was provided as a gift sample by Hetero Pharma, Hyderabad, India. Tween 80 and Poloxamer 407 was supplied by Sigma–Aldrich, Bangalore, India. Isopropyl alcohol was supplied by S D Fine Chem Ltd., Mumbai, India as a gift sample. Purified water used for all experiments was MilliQ Plus, Millipore.
Preparation of nanocrystals
Sonoprecipitation was used to produce the DST nanocrystals. Probe Sonicator(Johnson Plastosonic Private limited, Pune) (Figure 2) consisting of a probe and sonifier was employed to provide the source of the ultrasound for precipitation process. A glass vessel containing 5 ml of aqueous solution (5 mg of Poloxamer 407) in an ice bath into which briefly, 5 ml of organic solution containing 100 mg of DST drug dissolved in 5 ml of isopropyl alcohol was rapidly injected into aqueous phase through a syringe under ultrasonic conditions. The reaction conditions were maintained as mentioned in Table 2. After the time had elapsed the solution was removed and subjected to lyophilization to obtain nanocrystals. For each batch practical yield and particle size were determined. The optimised formulation is taken and made into nanosuspension by adding 10mg of tween 80. Nanocrystals were dispersed in tween 80 to form pre-suspension which
was homogenized at low and high pressures and went for sonication to obtain nanosuspension.
Experimental design
To find out the main factors and the proper ranges in which the optima lie, preliminary experiments were performed initially. The effects of the three factors (Power of sonication, Time of sonication and Temperature of sonication) on the practical yield and particle size were tested. Power of sonication, Time of sonication and Temperature of sonication were identified as the most significant variables within the range of 100-300 W, 5-15 min and 10-300c respectively based on preliminary screening. To study the effect of each independent variable on dependent variables (practical yield and mean particle size) a 3-factor, 3-level Box–Behnken design was employed on the basis of the preliminary trials. The independent and dependent variables in the design are listed in Table 1 and responses for the dependent variables are given in Table 2. With Stat-Ease Design Expert_ software V7.1.6, response surfaces of the variables inside the experimental domain were analyzed. To verify the robustness of the statistical experimental strategies three more confirmation experiments were conducted.
Characterisation FT-IR spectroscopy
Perkin Elmer system 2000 spectrophotometer is used to evaluate the molecular structure of crude drug and drug nanocrystals by crushing them with KBr pellet. The IR spectra were scanned from 4000 to 400 cm-1.
Differential scanning calorimetry
For Differential scanning calorimetry (DSC) analyses, Perkin–Elmer DSC-7 is used. To calibrate the enthalpy scale and DSC temperature, Indium/Zinc standards were used. Under nitrogen purge, samples were heated over a range of 50–300°C which were sealed in aluminum pans and for DSC runs nitrogen flow rate of 20ml/min is used. DSC scans of pure DST, poloxamer 407 and DST nanocrystals were recorded. The change in enthalpy is given by DSC.
X-ray diffraction (XRD) studies
XRD diffractometer (MiniFlex, Rigaku Inc., USA) is used for XRD studies which are operated at a voltage of 39.90 kV and a current of 29.90 mA with the Cu-Ka line as the source of radiation. Between 0 to 5002θ angle range all samples were scanned with a scan rate of 2°/min at step size of 0.020. XRD patterns of DST, poloxamer 407 and DST nanocrystals were obtained.
Determination of Saturation Solubility
spectrophotometer (Systronices 2202 Model UV-1601PC,
Japan) at 318 nm using linearity curve developed in acetate buffer pH 4 with 1 % triton X-100.14, 15
In-vitro release study
Using USP 24 dissolution apparatus type II (paddle method) (Electrolab, TDT-08L) at 100 rpm, the in vitro release studies were carried out. Release studies were done by using dialysis membrane. The donor phase consisted of 2 mL of formulation in acetate buffer pH 4 with 1 % triton X-100. The receiving phase also consisted of 1000 ml of acetate buffer pH 4 with 1 % triton X-100 as dissolution medium at 37± 0.50c. At regular intervals 5 ml of sample was withdrawn and replaced with the same volume of acetate buffer solution. The samples were withdrawn and the amount of DST released was analyzed based on the standard curve using a UV Spectrophotometer. The cumulative amount of drug released into the media at each time point was evaluated as the percentage of total drug release to the initial amount of the drug.16,17, 18
Particle size, polydispersity index and zeta potential measurement
Using dynamic light scattering and laser Doppler anemometry (Zetasizer Nano ZS; Malvern Instruments, Malvern, UK) mean particle size, polydispersity indices and zeta potential of DST nanocrystals were determined. In 1 mL of deionized water 500 μg of DST nanocrystals were
suspended. To observe the electrophoretic velocity of the particles an electric field of 150 mV was applied.
Scanning electron microscopy (SEM)
Samples were allowed to air dry by dropping onto aluminium stubs. Then it is observed under SEM(JEOL JSM-6360A) by coating the air dried particles with gold in vacuum using a Fiscon Instrument SC 502 sputter coater which is operated at a voltage of 15 kV.
Transmission electron microscopy (TEM)
Formvar resin grid method is used for preparing sample and the sample is taken for observation by spraying on a form var resin-coated TEM grid which is air-dried for 10 min. NIH image software(Joel, JEM 2200FS TEM) is used for particle measurement and contrast enhancement.
3. RESULTS AND DISCUSSION
Optimization of process variables for the synthesis of dasatinib nanocrystals
Here we report the synthesis of nanocrystals by sonoprecipitation method. Through preliminary experiments power of sonication, time of sonication and temperature of sonication were recognized as the most significant variables that influence the practical yield and particle size.
To produce elated product yield with identical particle size distribution, Design of experiments (DOE) has been hired as a powerful approach. Here Box–Behnken design is used to optimize and evaluate main effects, interaction effects and quadratic effects of the dependent variables. For exploring quadratic response surfaces and constructing second order
polynomial models Box–Behnken design is appropriate. This design consists of replicated center points and the set of points lying at the midpoint of each edge of the multidimensional cube. These designs are rotatable (or near rotatable) and require three levels of each factor.19, 20Based on the Box–Behnken design, for response surface methodology seventeen experiments are essential.
The different responses yielded as per factor combinations are shown in Table 2. These results incurred from all the 17 batches evidently displays that dependent variables are strongly dependent on the particular independent variables. To obtain analysis of variance (ANOVA), regression coefficients, regression equation and to analyze the data Stat-Ease Design Expert_ software V 7.1.6 is used. For the mentioned variables by using multiple linear regression analysis Mathematical relationships were generated as shown in Table 3. These equations denote the quantitative effect of power of sonication, time of sonication and temperature of sonication and their interaction on practical yield (Y1) and particle size (Y2). The values of the coefficients of A, B and C are related to the effect of these variables on the responses Y1 and Y2. Coefficients with more than one factor term and those with higher order terms represent interaction terms and quadratic relationship respectively. A positive sign denotes synergistic effect, while a negative sign denote antagonistic effect. A backward elimination method was followed to fit the data to the quadratic model. Both the polynomial equations were found to be statistically significant (P\0.01), as ascertained using ANOVA (Table 4, 5), as per the requirements of Design Expert software.
Int J Pharma Res Health Sci. 2018; 6 (1): 2295-02
As shown in Table 2, nanocrystals particle sizes was found to be in the range of 150–342 nm. A good correlation coefficient (1.000) was exhibited for particle size which is represented by factorial equation and the model is significant which is indicated by a Model F-value of 3250.58. As shown in Table 5 in this case A, B, C and the quadratic term of AB, BC, CA, A2, B2and C2are significant model terms. Effect of C (temperature of sonication) is more significant than A and B which is indicated by the equation. All the three variables are inversely proportional to the response since it has negative effect on the particle size. With the perturbation and 3D response surface plots the impact of the core and interactive effects of independent variables on the practical yield was further explained. In Figure 5 the individual core effects of A, B and C on particle size are shown and it was found that for response Y2 all the variables are having interactive effects.
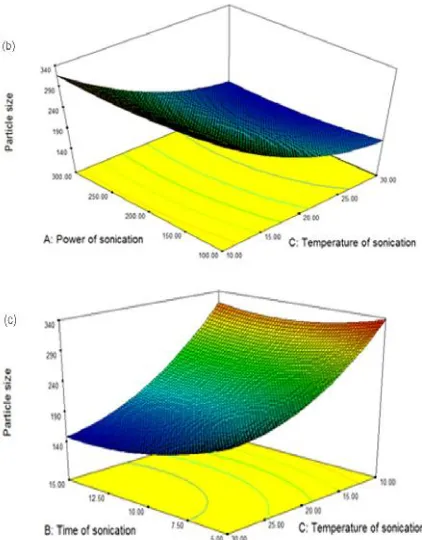
In Figure 6, 3D response surfaces and the 2D contour plots of the response Y2 are shown to represent the interactive effects of independent variables on response Y2 by keeping two variables in certain range and one variable was kept constant. The nature and degree of the interaction among various factors was revealed by shapes of response surfaces and contour plots. In Figure 6a at a fixed level of C the interaction between A and B on particle size is shown.Y2 reduced from 269 to 218 nm, at low levels of A. SimilarlyY2 reduced from 239 to 205 nm at high levels of A. In Figure 6b at a fixed level of B the interaction between A and C on particle size is shown. Y2 reduced from 338 to 183 nm at low levels of A. Similarly Y2 reduced from 314 to 163 nm at high levels of A. In Figure 6c at a constant level of A the interaction within B and C on particle size is shown. Y2 reduced from 347 to 210 nm at low levels of B. Similarly Y2 reduced from 321 to 150 nm at elated levels of B.
The process was optimized for the responses, after generating the polynomial equations relating the dependent and independent variables. To locate the optimal settings of the process variables to obtain the desired responses Numerical optimization technique using the desirability approach was used. By setting constraints on the dependent and independent variables, optimized conditions were incurred. To attain the levels of A–C which maximize Y1 and minimize Y2, optimization was made. The optimized levels and forecasted values of Y1 and Y2 are shown in Table 6.
FT-IR Study
FT-IR spectroscopy was carried out to study drug-polymer interaction. There are some characteristic peaks of the drug (DST) like 3421 cm-1 (secondary amine N-H stretch), 3070 cm-1 (=C-H aromatic ring), 2923 cm-1 (C-H stretch), 2345 cm-1 (C-N stretch), 1577 cm-1 (N-H bending), 1289 cm-1 (O-H bending), 1017 cm-1 (C=O stretch) and 669 cm-1 (C-Cl stretch) identified by IR. For poloxamer 407, one broad peak is observed at 1111. The FTIR spectrum of lyophilized DST nanocrystals is almost superimposable upon that of
DST as shown in Figure 7 From below spectras, it was found that there is no significant change in plain drug spectra and drug nanocrystal. Hence there is no drug excipient interaction.
DSC analysis
To investigate the properties of the crystals DSC measurements were carried out and in Figure 8 DSC thermograms were shown. Crude DST showed single endothermic peak at 287.4°C ascribed to drug melting and poloxamer 407 based DST nanocrystals has retained the intrinsic crystalline nature which is indicated by melting point of 284.7°C. Due to presence of poloxamer 407, loss of crystallinity and reduction in crystal size melting peak slightly shifted to lower temperature. Hence DST nanocrystals showed increase in solubility, dissolution and bioavailability because of decreased crystallinity which is confirmed by results of XRD and DSC studies.14
XRD analysis
Crude DST showed diffraction peaks at 2θvalues of 12.4, 13.3, 13.7, 16.6, 19.2, 23.2, & 28.0due to the crystalline nature of crude DST as shown in Figure 9. DST nanocrystals prepared with poloxamer 407 showed almost similar 2θ
values showing no change in crystallinity. However slight decrease in 2θvalues of DST nanocrystals 12.3, 13.1, 13.6, 16.6, 19.1, 23.1 & 28.0 compared to DST might be due to loss of crystallinity (because of poloxamer 407 absorption on nanocrystal surface), which results in increased dissolution due to decrease in particle size from µ m of pure DST to nm size of nanocrystals.21, 22, 23
Saturation solubility test
It was observed that saturation solubility of nanocrystals was enhanced with poloxamer 407 as stabilizer. The saturation solubility of DST and DST nanocrystals at 37°C was 0.54±0.04μg/ml and 1.21±0.06μg/ml, respectively.
The in vitro release study of optimized dasatinib nanocrystals
The dissolution profile of the crude DST and optimized formulation is shown in Figure 10. After the sonoprecipitation process, the dissolution rate was drastically increased due to reduced particle size. The results of in vitro study demonstrated that the dissolution rate of DST nanocrystals were enhanced compared with crude DST. The cumulative % drug release of the formulation was found to be 98.12% in 15 minutes while pure drug was found to be 71.12% in 45 minutes respectively. To enhance dissolution rate increased saturation solubility, decreased crystallinity and reduced diffusion layer are also responsible.24
Particle size, polydispersity index and zeta potential measurement
Scanning electron microscopy
The optimized DST nanocrystals are irregular in shape and is shown in Figure 11.
Transmission electron microscopy
TEM was used to provide information on the morphology and size of the DST nanocrystals, as shown in Figure12. The nanocrystals are irregular in shape with a size of 151 nm.
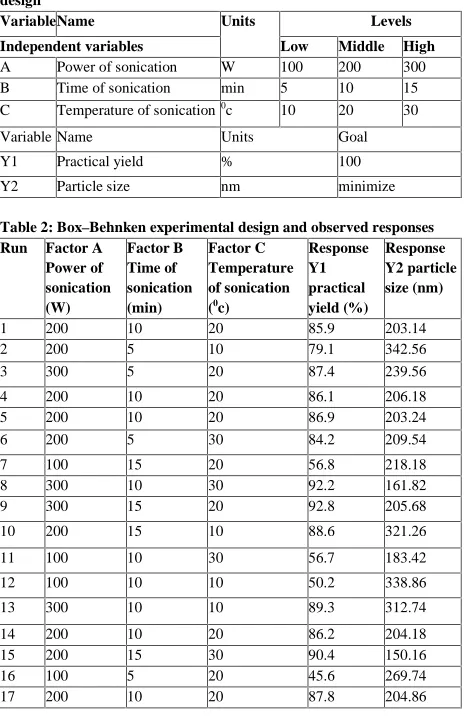
Table 1: List of dependent and independent variables in Box–Behnken design
VariableName Units Levels
Independent variables Low Middle High
A Power of sonication W 100 200 300
B Time of sonication min 5 10 15
C Temperature of sonication0
c 10 20 30
Variable Name Units Goal
Y1 Practical yield % 100
Y2 Particle size nm minimize
Table 2: Box–Behnken experimental design and observed responses
Run Factor A
Power of sonication (W) Factor B Time of sonication (min) Factor C Temperature of sonication (0 c) Response Y1 practical yield (%) Response Y2 particle size (nm)
1 200 10 20 85.9 203.14
2 200 5 10 79.1 342.56
3 300 5 20 87.4 239.56
4 200 10 20 86.1 206.18
5 200 10 20 86.9 203.24
6 200 5 30 84.2 209.54
7 100 15 20 56.8 218.18
8 300 10 30 92.2 161.82
9 300 15 20 92.8 205.68
10 200 15 10 88.6 321.26
11 100 10 30 56.7 183.42
12 100 10 10 50.2 338.86
13 300 10 10 89.3 312.74
14 200 10 20 86.2 204.18
15 200 15 30 90.4 150.16
16 100 5 20 45.6 269.74
17 200 10 20 87.8 204.86
Table 3: Regression equations for the responses—practical yield and particle size
Response Regression equation
Y1 86.67+19.05A+4.04B+2.04C-1.45AB-14.69A2
-1.22B2
Y2 204.32-11.30A-20.77B-76.31C+4.42AB-9.52BC+11.15A2
+17.82B2
+33.74C2
Table 4: The ANOVA results of the quadratic model for the response practical yield (Y1)
Source of variations Sum of Squares Degree of freedom Mean squares
F-value P value prob>F
R2
Model 4003.98 6 667.33 620.11 <0.0001 0.9988 A-Power of
Sonication
2903.22 1 2903.22 2697.80 <0.0001
B- Time of Sonication
130.41 1 130.41 121.18 <0.0001
C-Temperature of Sonication
33.21 1 33.21 30.86 0.0002
AB 8.41 1 8.41 7.81 0.0189
A2
911.24 1 911.24 846.76 <0.0001 B2
6.24 1 6.24 5.80 0.0368
Residual 10.76 10 1.08
Lack of fit 8.33 6 1.39 2.29 0.2213
Table 5: The ANOVA results of the quadratic model for the response particle size (Y2)
Source of
variations Sum of Squares Degree of freedom Mean squares
F-value P value prob>F
R2
Model 58743.75 8 7342.97 3250.58 <0.0001 0.9997 A-Power of
Sonication
1021.52 1 1021.52 452.21 <0.0001
B- Time of Sonication
3449.48 1 3449.48 1527.01 <0.0001
C Temperature of Sonication
46585.73 1 46585.73 20622.51 <0.0001
AB 78.15 1 78.15 34.59 0.0004
BC 362.52 1 362.52 160.48 <0.0001 A2
523.46 1 523.46 231.73 <0.0001 B2
1337.06 1 1337.06 591.89 <0.0001 C2
4793.21 1 4793.21 2121.85 <0.0001
Residual 18.07 8 2.26
Lack of fit 11.74 4 2.94 1.86 0.2821
Table 6: Optimized values obtained by the constraints applies on Y1 and Y2 Independent Variable Nominal Values Response Forecasted Values Observed Values A-Power of Sonication
252.55 Y1 96.1366 95.53
B- Time of Sonication
13.45 Y2 150.039 151
C- Temperature of Sonication 28.96 N S N Cl O H NH N N N N OH
Fig 1: Chemical structure of dasatinib
Int J Pharma Res Health Sci. 2018; 6 (1): 2295-02
Fig 3: The perturbation plot showing the main effects of power of sonication (A), time of sonication(B) and temperature of sonication (C) on the practical yield (Y1).
Fig 4: Response surface plot presenting the interactions between the power of sonication and time of sonication affecting the practical yield at constant temperature of sonication.
Fig 5: The perturbation plot showing the main effects of power of sonication (A), time of sonication(B) and temperature of sonication (C) on the particlesize (Y2).
Fig 6: Response surface plots presenting the interactions between the variables affecting the particle size (a) interaction between the power of sonication and time of sonication at constant temperature of sonication (b) interaction between the power of sonication and temperature of sonication at constant time of sonication (c) interaction between the time of sonication and temperature of sonication at constant power of sonication.
Fig 8: DSC curves of (a) crude dasatinib, (b) dastinib nanocrystals and (c) poloxamer 407.
Fig 9: XRD curves of (a) crude dasatinib, (b) dastinib nanocrystals and (c) poloxamer 407.
Fig 10: Cumulative % drug release of dasatinib nanocrystals and dasatinib as pure drug in pH 4 acetate buffer
Fig 11: Scanning electron microscopy image of dasatinib nanocrystals
Fig 12: Transmission electron microscopy image of dasatinib nanocrystals
4. CONCLUSION
In the present study, a poorly aqueous-soluble drug DST was used to prepare the nanocrystals by using sonoprecipitation method. According to the optimized levels three batches of nanocrystals were prepared and the practical responses were nearer to the forecasted values. The prepared nanocrystals exhibited nanometer range irregular shaped crystals. The saturation solubility, dissolution rate and bioavailability of DST were significantly improved after crude DST was made into nanocrystals by the sonoprecipitation process. Nanocrystals showed remarkable melioration in the solubility when compared with pure drug which leads to promote the bioavailability and lessen the dose needed for therapeutic action. This leads to fewer side effects and overall decrease in the cost of therapy. Thus it can be concluded that nanocrystals are appropriate carriers for solubility enhancement.
5. ACKNOWLEDGEMENTS
Int J Pharma Res Health Sci. 2018; 6 (1): 2295-02 6. REFERENCES
1. Danhier F, Ansorena E, Silva JM, Coco R, Le Breton A, Préat V. PLGA-based nanoparticles: an overview of biomedical applications. Journal of controlled release 2012; 161(2): 505-522.
2. Keck CM, Müller RH. Drug nanocrystals of poorly soluble drugs produced by high pressure homogenisation. European Journal of Pharmaceutics and Biopharmaceutics 2006; 62(1): 3-16.
3. Merisko-Liversidge E, Liversidge G G, Cooper E R. Nanosizing: a formulation approach for poorly-water-soluble compounds. European Journal of Pharmaceutical Sciences 2003; 18(2): 113-120.
4. Khadka P, Ro J, Kim H, Kim I, Kim J T, Kim H, Lee J. Pharmaceutical particle technologies: An approach to improve drug solubility, dissolution and bioavailability. Asian journal of pharmaceutical sciences 2014; 9(6): 304-316.
5. VemuriS, Rhodes C T. Preparation and characterization of liposomes as therapeutic delivery systems: a review. Pharmaceutica Acta Helvetiae 1995; 70(2): 95-111.
6. Seedher N, Kanojia M. Co-solvent solubilization of some poorly-soluble antidiabetic drugs. Pharmaceutical development and technology 2009; 14(2): 185-192. 7. ChiouWL, Riegelman S. Pharmaceutical applications
of solid dispersion systems. Journal of pharmaceutical sciences 1971; 60(9): 1281-1302.
8. Serajuddin A. Solid dispersion of poorly water‐soluble drugs: Early promises, subsequent problems, and recent breakthroughs. Journal of pharmaceutical sciences 1999; 88(10): 1058-1066.
9. Jones MC, Leroux JC. Polymeric micelles–a new generation of colloidal drug carriers. European journal of pharmaceutics and biopharmaceutics 1999; 48(2): 101-111.
10. Anton N, Vandamme TF. Nano-emulsions and micro-emulsions: clarifications of the critical differences. Pharmaceutical research 2011; 28(5): 978-985.
11. Stella VJ, Rajewski RA. Cyclodextrins: their future in drug formulation and delivery. Pharmaceutical research 1997; 14(5): 556-567.
12. Suresh M, Kavya R, Naveen R, karthik M. Drug profile of dasatinib. BiochemMolBiol Lett 2017; 3(1): 110. 13. Kamath AV, Wang J, Lee FY, Marathe PH. Preclinical
pharmacokinetics and in vitro metabolism of dasatinib (BMS-354825): a potent oral multi-targeted kinase inhibitor against SRC and BCR-ABL. Cancer chemotherapy and pharmacology 2008; 61(3): 365-376. 14. Jiang T, Han N, Zhao B, XieY, Wang S. Enhanced
dissolution rate and oral bioavailability of simvastatin nanocrystal prepared by sonoprecipitation. Drug development and industrial pharmacy 2012; 38(10): 1230-1239.
15. Shah SR, Parikh RH, Chavda JR, Sheth NR. Glibenclamide nanocrystals for bioavailability enhancement: formulation design, process optimization, and pharmacodynamic evaluation. Journal of Pharmaceutical Innovation 2014; 9(3): 227-237. 16. Basak SC, Reddy BJ, Mani KL. Formulation and release
behaviour of sustained release ambroxol hydrochloride HPMC matrix tablet. Indian Journal of Pharmaceutical Sciences 2006; 68(5): 594-598.
17. Velmurugan R, Selvamuthukumar S. Development and optimization of ifosfamide nanostructured lipid carriers for oral delivery using response surface methodology. Applied Nanoscience 2016; 6(2): 159-173.
18. Sahoo CK, Sudhakar M, Bhanja S, PanigrahyUP, Panda KC. Development and evaluation of immediate release tablets of dasatinib using sodium starch glycolate as super disintegrants. Innoriginal: International Journal Of Sciences 2017; 4(1): 4-7. 19. Zhang Q, Tian X, Du G, Pan Q, Wang Y, Zhang X. J
Chem. 2013; 505460: 1
20. Hamam AM. J. Appl. Sci. Res 2009; 5: 1772.
21. Lee J, Lee SJ, Choi JY, YooJY, Ahn CH. Amphiphilic amino acid copolymers as stabilizers for the preparation of nanocrystal dispersion. European Journal of Pharmaceutical Sciences 2005; 24(5): 441-449.
22. Raghavan SL, Trividic A, Davis AF, Hadgraft J. Crystallization of hydrocortisone acetate: influence of polymers. International journal of pharmaceutics 2001; 212(2): 213-221.
23. Zimmermann A, Millqvist-Fureby A, Elema MR, Hansen T, MüllertzA, Hovgaard L. Adsorption of pharmaceutical excipients onto microcrystals of siramesine hydrochloride: effects on physicochemical properties. European Journal of Pharmaceutics and Biopharmaceutics 2009; 71(1): 109-116.
24. Xia D, Quan P, Piao H, Piao H, Sun S, Yin Y, Cui F. Preparation of stable nitrendipine nanosuspensions using the precipitation–ultrasonication method for enhancement of dissolution and oral bioavailability. European Journal of Pharmaceutical Sciences 2010; 40(4): 325-334.
Conflict of Interest: None