Page 211 www.ijiras.com | Email: [email protected]
Influence Of Interactive Multimedia In Enhancing E-Learning In
The Selected Universities In Kenya
Lilian Jemutai Kemboi
Student, Jomo Kenyatta University of Agriculture and Technology, Kenya
Dr. Susan Were
Lecturer, Jomo Kenyatta University of Agriculture and Technology, Kenya
Dr. Wilson Cheruiyot
Director, Jomo Kenyatta University of Agriculture and Technology, Kenya
I. INTRODUCTION
This chapter gives the background to the study, statement of the problem, study objectives, research questions and significance of the study. It also highlights the scope of the study, and limitations of the study.
A. BACKGROUND TO THE STUDY
The Kenyan government drafted an ICT policy in 2006, with a vision of creating an electronic driven and knowledge based society by the year 2015. The policy majorly aimed at Improving the social welfare of the population, improving the quality of teaching and learning, improving health care and empowering women, youth, rural Abstract: The central problem in this study was that despite the government efforts to have the ICT policy in place that requires all institution of higher learning to embrace E-learning with interactive multimedia in their education, little has been done by the universities especially in the area of interactive multimedia, E-Learners do not have control over learning content and process to meet their individual academic needs. On the literature review it explained the related theoretical review, conceptual framework which entails the relationship between the dependent variable (E-learning with interactive multimedia) and independent variables (ICT infrastructure, training, technical support and ICT policy), empirical data, summary, critique of the literature review and research gaps. The study adopted a descriptive research design. The targeted population was five Kenyan universities both private and public with a total sample of 100 respondents (15 ICT lectures, 10 administrators and 75 post graduate students). The population consisted of ICT lecturers, post graduate students and administrators serving as a sampling frame. Using simple random sampling, 100 were selected representing 10% of the total population. Questionnaires and observation schedules were used as research instruments to collect data. Data was then arranged and coded for analysis. Percentages, frequency distributions and means were used to analyze the collected data with the aid of the Microsoft Excel and Statistical Package of Social Sciences. Data was presented in tables, histograms and pie charts. Study findings indicated that universities had inadequate ICT infrastructure and university ICT policy was not fully implemented. Technical support staff was not enough thus need to employ more staff. Overall, the findings showed that universities were not fully utilizing interactive multimedia in their E-learning. It was recommended that ICT infrastructure be increased, lecturers be trained on developing E-learning content and Technical support staff be employed in order to provide the needed support on the use of interactive multimedia with E-learning in institution of higher learning.
Page 212 www.ijiras.com | Email: [email protected] communities and the illiterate and disadvantaged groups
Improve the efficiency and quality of public service delivery, provide adequate infrastructure and facilitate the development of sectorial ICT policies and strategies (Republic of Kenya, 2006).
KESSP comprises of 23 investment programs on education sector. The use of technology in education will help attain the one of the education goals in the Country’s vision 2030, which is to provide globally competitive education, training and research for development. This is to be achieved through reducing illiteracy rates, increasing access to education and raising the quality of education. Most of the Kenyan universities have begun embracing use of e-learning as strategy to enhance access to education, offer low cost education and adapt to the changing trends to university education in the world. To implement use of ICT in institutions, the MoE laid down a National ICT strategy for Education and Training that gives a blueprint of harnessing ICT use in Education (Republic of Kenya, 2004).
B. STATEMENT OF THE PROBLEM
Despite the strong emphasis given to E-learning education in Kenya, there is little research that has been done to incorporate interactive multimedia in the e-learning system in most of the institution of higher learning. In the selected Universities, they have an e-learning system in place but there is no interactivity in their e-learning content. It is in this view that this study seeks to find out how to enhance e-learning with the use of Interactive Multimedia in Institutions of Higher Learning in Kenya-case study of selected private and public university in Nairobi. The purpose of this research is to analyze current practices in the e-learning industry regarding the use of interactive multimedia as a learning tool and recommend ways in which E-learning can be enhanced with the use of interactive multimedia.
C. PURPOSE OF THE STUDY
The purpose of this study was to establish the Influence of Interactive Multimedia in Enhancing E-Learning in the selected universities in Kenya.
D. STUDY OBJECTIVES
To determine the effect of ICT infrastructure on the enhancement of e-learning with the use interactive multimedia in institution of higher education in Kenya. To establish the effect of training on the enhancement of
e-learning with the use of Interactive multimedia in institutions of higher learning in Kenya.
To find out the effect of technical support on the enhancement of e-learning with the use of interactive multimedia in institutions of higher learning in Kenya. To establish the effect of university ICT policy on the
enhancement of e-learning with the use of interactive multimedia in institutions of higher learning in Kenya.
E. RESEARCH QUESTIONS
How does ICT infrastructure affect the enhancement of e-learning with the use of interactive multimedia in institutions of higher learning in Kenya?
What effect does training has on the enhancement of e-learning with the use of interactive multimedia in institutions of higher learning in Kenya?
How does technical support affect the enhancement of e-learning with the use of interactive multimedia in institutions of higher learning in Kenya?
What is the effect of ICT policy on the enhancement of e-learning with the use of interactive multimedia in institutions of higher learning in Kenya?
F. SIGNIFICANCE OF THE STUDY
a. MINISTRY OF EDUCATION DEPARTMENT OF HIGHER EDUCATION
The study will help the Ministry of Education Department of Higher Education to make policies and guidelines on enhancement of interactive multimedia in the institution of learning. This will also enable the government and other regulatory agencies in making informed and wise decisions with regards to e-learning with interactive multimedia.
b. THE MANAGEMENT OF INSTITUTIONS OF HIGHER LEARNING IN KENYA
The study will help the management of institutions of higher learning in Kenya to see the need of introducing interactive multimedia in their institution of learning. To the management of institutions of higher learning in Kenya, the study will help them to identify both administrative and technical bottlenecks and measures of dealing with them in prompting E-learning with interactive multimedia implementation among their staff.
c. RESEARCHERS AND SCHOLARS
Theoretically, the study will also prompt more researchers and scholars in the area having contributed to literature review for future studies and will contribute to the body of knowledge. Knowledge gained from this research study will be useful to trainers and ICT policy makers for instance; National Council for Higher Education (NCHE) in making wise decision in relation to their ICT investment. This would trigger more efforts in the way institutions of higher learning adopt E-learning implementation in offering quality education and easening the access of information and general education. G. SCOPE OF THE STUDY
Page 213 www.ijiras.com | Email: [email protected] support, and ICT policy and dependent variable enhancement
of e-learning with the use of interactive multimedia. The focus was therefore based on the lectures, students and ICT administrators; the sample of the study was drawn from the 760 students, 150 lectures and 100 ICT administrators of the selected 5 private and public universities in Nairobi. A sample was drawn and the questionnaire administered. The Lecturers, students and ICT administrators were considered the respondents in this study.
H. LIMITATIONS OF THE STUDY
E-learning and interactive multimedia is a very broad area of study. This study was only limited to the selected 5 private and public university within Nairobi. The nature of the study calls for confidential information related to the respondents and as a result respondents may feel intruded when requested to complete a questionnaire which requires them to disclose such information. In order to mitigate this short coming the respondents were assured of confidentiality and ethical handling of the information; and that information collected was to be used for academic purposes only.
II. LITERATURE REVIEW A. INTRODUCTION
The chapter comprises of the theoretical review which named the relevant theories and models related to this study and later discussed them, the empirical review which summarizes the information from other researchers who have carried out research in the same or related field of study, this formed the basis of comparison of the results found in the area studied in the past and that which has been studied. This literature forms the background upon which body of knowledge can be derived. The literature was reviewed from three dimensions; first relevant theories were reviewed, second past/empirical studies on determinants of e-learning with interactive multimedia were also examined and third a critique on both theories and past studies was done. The reviews were aimed at establishing the link between the variables affecting e-learning with interactive multimedia.
a. CRITIQUE OF THE EXISTING LITERATURE
Different researchers have identified important aspects that on e-learning implementation in developing country contexts over the past years; this section presents some of them. The study explored and reviewed articles related to e-learning with interactive multimedia in developing countries between 2009 and 2014. The aim was to identify how different factors impact implementation of e-learning development. The review mainly focused on studies relating to integration of e-learning in a blended e-learning approach in a university set up. This was motivated by the fact that major implementations of e-learning are supposedly designed to enhance the traditional face-to-face learning environment, especially in a university setting.
Bhuasiri et al. (2012) carried out a study in four Asian developing countries with the aim of identifying factors that influence the integration of e-learning. The study derived six dimensions (learner characteristics, instructor characteristics, institution and service quality, infrastructure and systems quality, course and information quality, extrinsic motivation) with over 20 critical success factors for e-learning implementation.
b. SUMMARY OF THE STUDY
The specific search terms utilized were of e-learning in developing countries, factors affecting e-learning with interactive multimedia in developing countries, and benefits and challenges to enhancement of e-learning in institutions of higher learning in developing countries. The articles selected were peer reviewed journal articles with representations of various developing countries across the world. (Andersson & Grönlund, 2010).
Mahmud (2010) carried out an explorative study that illustrated technological, psychological, socio-cultural and economic as the factors limiting successful implementation and integration of e-learning for higher education in developing countries. Unwillingness to change the learning atmosphere, poor level of competence in English, lack of funds and technical resources in universities, lack of confidence to practice computer applications and absence of infrastructures such as electricity and telephone lines are some of the factors that were identified as affecting e-learning with interactive multimedia implementation in developing countries.
According to the literature review, it is easy to point out that; all the institutions in Kenya would wish as much as possible to integrate e-learning with interactive multi-media due to the advantages attached to it. It also worth noting that; of challenges that there are a number of challenges that face the entire process of implementing and integrating E-learning with interactive multi-media ranging but not limited to; cost of the accessories, lack of sufficient knowledge and skills, poor administrative policies on resource allocation for e-learning etc. This research study will be made to explore the influence of e-learning, the training and development of university staff in readiness of e-learning integration with interactive multimedia, administrative and technical support for integration of e-learning and ICT policy and legal framework.
c. RESEARCH GAPS
Page 214 www.ijiras.com | Email: [email protected] been done on interactive multimedia on E-learning in Kenya
and it is in this view that the study ought to research on the influence on interactive multimedia on E-learning in Kenya. B. CONCEPTUAL FRAMEWORK
According to Rose (2010), conceptual framework acts like a map that gives coherence to empirical inquiry and is used to outline possible causes of action or present preferred approach to an idea; hence it is a structure of assumptions and principles that hold together the ideas comprising a broad concept, she further points out that conceptual framework synthesize ideas for the purpose of organized thinking and providing study direction, and comprise the independent and dependent variables and an examination into their relationship.
Independent variables
Dependent Variable
Figure 1
III. RESEARCH METHODOLOGY
A. INTRODUCTION
This section outlines the methodology that was used in carrying out the study. It comprises of research design, population, sample size and sampling procedure, data collection method and data analysis and presentation
B. STUDY DESIGN
The study therefore adopted a descriptive research design which according to Bryman (2011) is a scientific method which involves observing and describing the behavior of a subject without influencing it in any way and is designed to gain more information about variables within a particular field of study. A quantitative approach was also used to obtain quantifiable data (Mugenda & Mugenda, 2003) on the variables in the study. Pearson Moment Coefficient of Correlation and tests of significance was computed and used
to analyse the strength of linear relationship between the dependent and independent variables
This descriptive research design was adopted because the study was seeking to describe a one variable (use of interactive multimedia) and its influence by other variables such as ICT infrastructure, training, Technical support and ICT policy among the Administrators, teaching staff and students of the selected universities. The descriptive research design was fond to be appropriate for this study because it allowed the use of research instruments like questionnaires (Kothari, 2010).
C. POPULATION OF THE STUDY
The target population in the study constituted of 150 ICT teaching staff, 100 administrators and 760 post graduate students of the 5 selected private and public universities in Nairobi which include Nairobi university, Kenyatta university, Mount Kenya university, Multimedia University and Daystar university and was done using simple random sampling; a sample was selected from this population with the view to investigate the research questions.
The universities were purposively chosen because of their success in using current technology and also the students were chosen because they are the one using E-learning portal and Administrators are the ones responsible for providing technical support and funding towards E-learning. Since money was a challenge to gather information from everyone in a population, the goal used was to find the representative sample of the population (Jagger, 2009).
D. SAMPLING TECHNIQUE AND SAMPLE SIZE
According to Kombo and Tromp (2010), an effective sample should possess diversity, representativeness, reliability, accessibility and knowledge. This process was applied in this study because the study population is large (1010 lecturers, administrators and students). Mugenda & Mugenda (2003) advises that a sample size of between 10% and above is a good representation of the target population and hence 10% is adequate for this study analysis. Thus, a sample of 100(post graduate students, ICT lectures’ and administrators), representing 10% of the population, were used which satisfied the above conditions In this study, 10% of the target population were selected from the selected Kenyan universities which gave a total of 100, who were the respondents in this study.
Sample size = 10% of the target population Sample size (Xi=10/100*X) Xi
Sample size = 10/100 *1000 Sample size = 100
Sampling means selecting a given number of subjects from a defined population as a representative of that population, any statement that were made about the sample was considered to be true of the population (Warentho, 2009). Non-probability sampling is any sampling method where some elements of the population have no chance of selection; it involves selection based on assumptions regarding the population of interest which forms the criteria for selection (Fowler, 2009).In probability samples, each member of the ICT Infrastructure
Reliable computers, projectors Internet connectivity Supportive software’s
Technical Support
ICT Personnel
Technical skills on Interactive Multimedia
Knowledge on e-content development
Training
E-learning and ICT skills E-content development Knowledge on use of multimedia Seminars and workshops
ICT policy
University ICT policy ICT management vision Funding
ICT Leadership
Enhancement of E-learning in higher institution of learning
Uploaded materials
Page 215 www.ijiras.com | Email: [email protected] population has a known non-zero probability of being
selected. Probability methods include random sampling, systematic sampling, and stratified sampling. The sampling technique used was the simple random sampling technique of probability sampling (Bryman, 2008). Simple random sampling is a commonly used probability method that is superior to Stratified sampling because it often improves the representativeness of the sample by reducing sampling error. It can produce a weighted mean that has less variability than the arithmetic mean of a Stratified sampling sample of the population.
E. RESEARCH INSTRUMENTS
a. QUESTIONNAIRE
The study used a structured questionnaire which was researcher-administered (administered face to face with the respondent) to cushion the inability of the respondents to easily interpret some specialized questions (Mugenda and Mugenda, 2003). The questionnaires used consisted of majority closed and a few open-ended questions. Interviews were used to obtain information on specific ICT resources including bandwidth, number of computers and printers and ICT budgetary allocations to complement the questionnaires in the research.
F. PILOT TESTING
A pilot study is a small scale preliminary study conducted before the main research in order to measure the validity and reliability of the data collection instrument (Burns & Grove, 2007). Orodho (2005) observes that, piloting helps to detect deficiencies in research instruments. The questionnaires for the study were pretested towards its improvement (Mugenda and Mugenda, 2003). A total of 15 questionnaires were administered for the pretest.
a. VALIDITY OF THE INSTRUMENTS
Validity is defined as the accuracy and meaningfulness of inferences which are based on research design.it is the degree to which the results obtained from the analysis of the data actually represent the phenomenon under study (Mugenda and Mugenda, 2009). The study ensured content validity of the questionnaire’s by ensuring that questions in it conformed to the study’s research objectives and conceptual framework. Research experts were used to evaluate the relevance, wording and clarity of questions in the instrument. The research experts independently judged the validity of the items in the questionnaire in relation to research objectives. The questionnaires was also piloted and tested with a sample of 4 lecturers and 10 students from Catholic university.
b. RELIABILITY OF THE INSTRUMENTS
Mugenda and Mugenda (2003) define reliability as a measure of the degree to which the research yields consistent results or data after repeated trials. Reliability of the four set of SAQs on all variables (ICT infrastructure, training,
technical support and ICT policy was tested using the Cronbach Alpha Moment Co-efficient provided by SPSS
c. DATA ANALYSIS AND PRESENTATION
The data was collected from 100 respondents (i.e. 75 students, 15 lecturers and 10 administrators) and was prepared or processed for analysis and then later actually analyzed. The data was collected using questionnaires, interviews and was edited, categorized or coded and entered into the computer using the Statistical Package for Social Sciences (SPSS) for generation of summary frequency tables and graphics (Tabachnick and fidell, 2011). Descriptive tools were used to analyze the data collected. This included frequency distribution tables, measures of central tendency including the mean, median and percentiles as well as percentages (Mugenda& Mugenda, 2009)
At bivariate level, E-Learning with interactive multimedia implementation correlated with the respective training problems using Pearson’s Linear Co-relation co-efficient, to help rate their significances in influencing E-learning with interactive multimedia implementation in selected institutions of higher learning in Kenya. T-test and ANOVA analysis was used to establish Enhancement of E-learning with use of interactive multimedia varied with background variables. Using the Statistical Package for Social Sciences (SPSS) version 20 to test the relationship between the independent variables and dependent variable, Pearson’s co- relation was considered the most appropriate to verify the objectives of the study. Inferential statistics was done, the tools used were Pearson Coefficient to establish the relationship between the four independent variables and use of interactive multimedia, the T-test was also used to determine the importance of a particular variable affecting use of interactive multimedia (Cox Snell, 2010). The output was later presented in tables, bar charts, graphs and scatter plots (Kothari, 2008).
Y=β0 + β1X1+ β2X2+ β3X3+ β4X4+e: Where: Y=β0 β2X2 +e
Y= E-learning with interactive multimedia B0= Constant
X1= ICT infrastructure X2= Training
X3=Technical support X4=ICT policy
e= uncontrolled factors.
IV. DATA FINDINGS, ANALYSIS AND DISCUSSION A. INTRODUCTION
Page 216 www.ijiras.com | Email: [email protected] measures such as frequencies, standard deviation, graphs and
charts to explore the nature of the results of the variables under study. Further, it also applies regression analysis to determine the relationship between the study variables and the extend of the relationship between and among the variables.
B. QUESTIONNAIRE RETURN RATE AND
RESPONDENTS’ CHARACTERISTICS
a. RESPONSE RATE
The study had targeted 100 respondents out of which 70 respondents filled and returned their questionnaire constituting 70.0% response rate. From the data collected, out of 100 questionnaires administered, 70 questionnaires were fully filled and returned from the university respondents making a response rate of 70% (70/100) whereas 30% (30/100) were unsuccessful. This percentage concurs with Mugenda and Mugenda (2003) who argues that for generalization a response rate of 50% is adequate for analysis and reporting, 60 % is good and a response rate of 70% and over is excellent, thus 70% was adequate for analysis. This high response rate can be attributed to the data collection procedures, where the researcher pre-notified the potential participants and applied the drop and pick method where questionnaires were picked at a later date to allow the respondents ample time to fill the questionnaires. The response rate was therefore adequate for the study to make the relevant conclusions basing on the respondents.
Response Rate Frequency Percentage
Successful 70 70.0%
Unsuccessful 30 30.0%
Total 100 100.0%
Table 1: Response Rate
b. RELIABILITY OF THE RESULTS
In this study, Cronbach alpha which is a reliability coefficient was used to indicate how well the items in the set correlated to each other. The Cronbach alpha was computed in terms of the average inter-correlations among the items measuring the concepts.The findings indicated that ICT Policy had a coefficient of 0.801, training had a coefficient of 0.773, ICT infrastructure of 0.898 and technical support of 0.710.The recommendations for Cronbach alpha is that the closer the alpha to 1 the higher the reliability (Sekaran, 2008). A value of atleast 0.7 is recommended. All constructs depicted that the value of Cronbach’s Alpha are above the suggested value of 0.7 thus the study was reliable (Nunnally & Bernstein, 1994; Nunnally, 1974). On the basis of reliability test it was supposed that the scales used in this study is reliable to capture the constructs. The obtained alpha score is above 0.7. This indicates an acceptable level of reliability of the data used. This indicates that the scale has high internal consistency (reliability). The Cronbach’s alpha results were ranging from 0.710 and 0.801 and therefore the construct were acceptable as shown in the table below
Variable Cronbach’s Alpha
No. of Items
Comments
ICT Infrastructure
0.725 8 Accepted
Training 0.773 7 Accepted
Technical Support
0.710 8 Accepted
ICT Policy 0.801 8 Accepted
E-learning with Interactive multimedia
0.758 8 Accepted
Table 2: Reliability Test
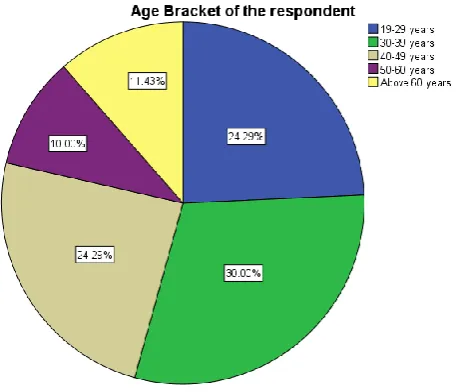
c. AGE BRACKET OF THE RESPONDENTS
The respondents were asked to state the age Bracket they were in. 34 (30%) of the respondents were between 30-39 years of age, 17 (24.3%) of the respondents were between 19-29 years of age, 17 (24.3%) of the respondents were between 40-49 years of age, 8 (11.4%) of them were above 60 years of age, while only 7 (2.6%) of the respondents were between 50-60 years of age. From the findings shown in figure 4.3, most of the respondents were between 30-39 years of age (30.0%) while 50-60 years age group had the least number of respondents (10.0%). Three was a tie between respondents of age brackets 19-29 years and 40-49 years at 24.3% each. Respondents in age bracket Above 60 years constituted 11.4% of the population.
Figure 1: Age bracket of the respondents
d. ICT INFRASTRUCTURE
Page 217 www.ijiras.com | Email: [email protected]
Supportive Software’s For E-Learning With
Interactive Multimedia
The study sought to determine the availability of the required supportive software’s for enhancing E-learning with interactive multimedia.From table 3, 1.4% of the respondents strongly disagree that the required supportive software’s for E-learning with interactive multimedia is available, 11.4% of the respondents disagree that the required supportive software’s for E-learning with interactive multimedia is available, 35.7% of the respondents were neutral ,35.7% of the respondents agree that the required supportive software’s for E-learning with interactive multimedia is available and 15.7% of the respondents strongly agree that the required supportive software’s for E-learning with interactive multimedia is available.
As shown in table 3, the findings reveals that the required supportive software’s for E-learning with interactive multimedia is available as indicated by the frequency of 25. This indicates that 35.7% of the total population agrees that the required supportive software’s for E-learning with interactive multimedia is available but the university need to do more to increase the required software so as to allow usage of interactive multimedia in the university.
The findings relate with that of Nasr (2005) who carried out a research to study the “Effectiveness of the use of multimedia computer technology on teaching who found that the supportive software is an essential element of interactive multimedia. The findings show that supportive software for interactive multimedia is an important factor in the enhancement of E-learning with interactive multimedia.
Frequency Valid Percent
Cumulative Percent
Valid
Strongly
disagree 1 1.4 1.4
Disagree 8 11.4 12.9
Neutral 25 35.7 48.6
Agree 25 35.7 84.3
Strongly
Agree 11 15.7 100.0
Total 70 100.0
Table 3: The required supportive software’s for E-learning with interactive multimedia is available
Internet Bandwidth And Internet Connectivity
The study sought to find out whether the available internet bandwidth is adequate for the enhancement of E-learning with interactive multimedia. The findings of the study indicated that 1.4% of the respondents are not sure whether internet connectivity is available in the university, 1.4% of the respondents indicate that the Internet connectivity is fair, 10% of the respondents agree that internet connectivity in the university is adequate, 41.4% of the respondents indicated that Internet connectivity is good and 45.7% of the respondents indicated that the Internet connectivity is excellent.
As shown in table 4, the findings reveal that adequate internet connectivity is available within the university premise as indicated by the frequency of 32 denoting 45.7% of the total population though majority of the students recommended
that the university management need to increase the bandwidth since the internet connectivity is a bit slow sometimes thus unable to view video based documents.
The findings collaborate with those of E-Readiness Survey of Kenyan Universities (2013) Report who observed that the current price of $160 per Mb/s was still a high price in comparison to developed countries thus the cost of Internet bandwidth is still high, hence currently universities cannot afford to procure adequate internet bandwidths. According to Kashorda & Waema (2014), on average, Kenyan universities were spending only 0.5% of their total recurrent expenditures on Internet bandwidth. Faster internet connectivity is critical to an institution using e-learning to support teaching and learning hence management should ensure that there is adequate bandwidth for internet connectivity so as to allow students and lecturers use interactive multimedia in their E-learning
Frequency Valid Percent
Cumulative Percent
Valid
None 1 1.4 1.4
Poor 1 1.4 2.9
Adequate 7 10.0 12.9
Good 29 41.4 54.3
Excellent 32 45.7 100.0
Total 70 100.0
Table 4: Internet connectivity is available
e. ICT POLICY
The study sought to evaluate the extent ICT Policy influence the enhancement of E-learning with interactive multimedia in the institutions of higher learning in Kenya. Specifically, the study focused on open, distance and E-learning Policy, University leadership and governance structure, policies and regulations and funding of E-learning.
Open, Distance And E-Learning Policy
The study sought to find out whether open, distance and e-learning policy is in place and has been approved by the university senate. The findings of the study indicated that 14.3% of the respondents strongly disagree that Open, distance and e-learning policy is in place and has been approved by the university senate, 2.9% of the respondents were neutral ,24.3% of the respondents agree that Open, distance and e-learning policy is in place and has been approved by the university senate and 58.6% of the respondents strongly agree that the Open, distance and e-learning policy is in place and has been approved by the university senate.
Page 218 www.ijiras.com | Email: [email protected] policies due to budgetary constraints and lack of the necessary
e-learning infrastructure.
The findings of this study concurs with that of Awidi (2008) who pointed out that the universities must have clearly defined strategic plans that spell out e-learning policies and implementation strategies thus the university management should ensure that the available E-learning policy need to be operational since a policy framework on e-learning is critical to the enhancement of e-learning with interactive multimedia in any given institution. In developing the appropriate e-learning policies, the core business of the university must take the center stage so as to ensure that e-learning puts the university on a competitive edge
Frequency Valid Percent
Cumulative Percent
Valid
Strongly
disagree 10 14.3 14.3
Neutral 2 2.9 17.1
Agree 17 24.3 41.4
Strongly
Agree 41 58.6 100.0
Total 70 100.0
Table 5: Open, distance and e-learning policy is in place and has been approved by the university senate
f. TECHNICAL SUPPORT
The study sought to find out whether technical support influences the enhancement of E-learning with interactive multimedia. Specifically, the study focused on university computer laboratory technician, technical support and knowledge on E-content development.
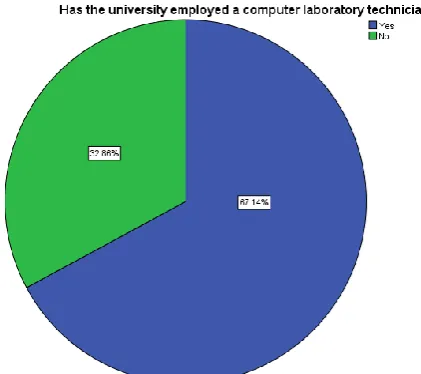
University Computer Laboratory Technician
The study sought to establish whether the university has employed computer laboratory technician. From figure 4.5, 67.1% of the respondents indicated that the university has employed computer laboratory technician whereas 32.9% of the respondents indicated that the university has not employed computer laboratory technician. The findings revealed that technical support has been implemented in universities as indicated by the frequency of 47 denoting 67.1% of all respondents that agree that universities have employed laboratory technicians though some students 32.9% felt that there is need to have more technicians.
The findings relate with those of Wyer &Mason (1999) who found that lack of technical support is a much obstacle to developing a working E-learning environment thus the university management need to employ more technicians so as to provide adequate support to both lecturers and students. Lack of enough technical support team hinders the enhancement of E-learning with interactive multimedia.
Figure 2: Has the university employed a computer laboratory technician?
g. TRAINING
The study sought to investigate the influence of training on the enhancement of E-learning with interactive multimedia. Specifically, the study focused on knowledge on use of multimedia tools, workshops and seminars organized for lecturers and the amount of time required developing E-content by lecturer
Seminars And Workshops Are Organized Regularly On The Multimedia
The study sought to find out if seminars and workshops are organized regularly on the use of multimedia in the university. The findings of the study in table 4.18 indicates that 2.9% of the respondents strongly disagree that seminars and workshops are organized regularly on the multimedia, 1.4% of the respondents disagree that seminars and workshops are organized regularly on the multimedia, 2.9% of the respondents were neutral , 45.7% of the respondents agree that the seminars and workshops are organized regularly on the multimedia and 47.1% of the respondents strongly agree that seminars and workshops are organized regularly on the multimedia.
Table 6: Seminars and workshops are organized regularly on the multimedia
Frequency Valid Percent
Cumulative Percent
Valid
Strongly
disagree 2 2.9 2.9
Disagree 1 1.4 4.3
Neutral 2 2.9 7.1
Agree 32 45.7 52.9
Strongly
Agree 33 47.1 100.0
Page 219 www.ijiras.com | Email: [email protected]
h. ENHANCEMENT OF E-LEARNING IN HIGHER INSTITUTION OF LEARNING
The study sought to investigate the influence of training on the enhancement of E-learning with interactive multimedia. Specifically, the study focused on use of images, sounds, contrast colours and animation in the uploaded documents attracts students’ attention and multimedia increases student’s motivation to learn
Use Of Images, Sounds, Contrast Colours And
Animation In The Uploaded Documents Attracts Students’ Attention
The study sought to investigate the influence of use of sounds and images in uploaded documents in enhancing E-learning. The findings of the study in table 7 indicates that 2.9% of the respondents strongly disagree that use of images, sounds, contrast colours and animation in the uploaded documents attracts students’ attention, 1.4% of the respondents disagree that use of images, sounds, contrast colours and animation in the uploaded documents attracts students’ attention, 12.9% of the respondents were neutral , 57.1% of the respondents agree that use of images, sounds, contrast colours and animation in the uploaded documents attracts students’ attention and 25.7% of the respondents strongly agree that use of images, sounds, contrast colours and animation in the uploaded documents attracts students’ attention. The results reveals that use of images, sounds, contrast colours and animation in the uploaded documents attracts students’ attention as indicated by the frequency of 40 indicating that 57.1% of all respondents hold this as true.
The findings of this study relate to that of (Aloraini, 2005, p. 73) who said that using different presentations like video clips along with maps or other kinds of presentations help to get the information closer to reality. Adding music makes the idea clearer and it attracts the attention of the learners thus need for lecturers to include more images and animations in the uploaded E-learning materials so as to attract student attention. According to the findings use of images, sounds, contrast colours and animation in the uploaded documents are of great essence in the enhancement of E-learning.
Frequency Valid Percent
Cumulative Percent
Valid
Strongly
disagree 2 2.9 2.9
Disagree 1 1.4 4.3
Neutral 9 12.9 17.1
Agree 40 57.1 74.3
Strongly Agree 18 25.7 100.0
Total 70 100.0
Table 7: Use of images, sounds, contrast colours and animation in the uploaded documents attracts students’
attention
i. REGRESSION ANALYSIS
The linear regression analysis models the linear relationship between the dependent variable which is enhancement of E-learning with interactive multimedia and
independent variables which are ICT policy, training, ICT infrastructure and technical support. According to the model summary table 8, R is the correlation coefficient which shows the relationship between the dependent variable and independent variables. It is notable that there exists strong positive relationship between the independent variables and dependent variable as shown by R value of (0.636).
The coefficient of determination (R2) explains the extent to which changes in the dependent variable can be explained by the change in the independent variables .58.7% change in the dependent variable causes a change in the independent varaible ,this therefore means that other variables not studied in this research contributed 32.3% of the enhancement of E-learning with interactive multimedia. The adjusted R squared indicates the percentage of variation explained by only the independent variables that actually affect the dependent variable. From the findings as indicted in the table 8, the value of adjusted R squared was 0.544, an indication that there was a clear variation of 54.4 % on enhancement of E-learning with interactive multimedia due to changes in ICT Policy, training, ICT infrastructure, technical support respectively.
Model R R Square Adjusted R
Square
Std. Error of the Estimate
1 .636a .587 .544 3.205
Table 8: Model Summary of Dependent and Factor variables
Predictors: (Constant), ICT Policy, Training, ICT Infrastructure, Technical Support
j. ANALYSIS OF VARIANCE
From the Anova statistics shown in table 9 it is evident that the processed data, which is the population parameter, indicated a significance level of 0.000, which is less than 0.05 thus the model is statistically significance in predicting how ICT Policy, Training, ICT Infrastructure, Technical Support affect the enhancement of E-learning with interactive multimedia thereby showing that the data is ideal for making a conclusion on the population. The F critical at 5% level of significance was 4.25. Since F calculated (value = 36.55), is greater than the F critical (value = 4.25), shows that there was model goodness of fit between interactive multimedia and ICT Policy, Training, ICT Infrastructure, Technical Support respectively and that the overall model was significant.
Model Source Sum of
Squares
df Mean
Square
F Sig.
1
Regression 269.267 4 67.317 36.555 .000b Residual 667.533 65 10.270
Total 936.800 69
Table 9: ANOVA
V. SUMMARY CONCLUSIONS AND
RECOMMENDATION A. INTRODUCTION
Page 220 www.ijiras.com | Email: [email protected] institution of higher learning in Kenya. In assessing the
challenges, the study focused on how to select factors (ICT infrastructure, Training, Technical support and ICT policy) influenced enhanced of E-learning with interactive multimedia in institutions of higher learning in Kenya. This chapter captures the summary of findings, from which conclusions were drawn and recommendations made.
B. SUMMARY OF THE FINDINGS
The general objective of the study was to examine the influence of interactive multimedia in enhancing e-learning in institution of higher learning in Kenya. The study established that ICT infrastructure and well implemented in universities, technical support has been well implemented in universities, training has been well implemented in universities, and use of interactive media as a mode of training in universities has been employed.
C. CONCLUSIONS
a. ICT INFRASTRUCTURE
The study sought to establish whether ICT Infrastructure influence the enhancement of E-learning with interactive multimedia in institutions of higher learning in Kenya. From the regression analysis, the study results revealed that ICT infrastructure is a significant influencer hence a predictor of enhancement of e-learning with interactive multimedia in institutions of higher learning in Kenya as revealed by significant beta of .038 (P<.05). This is also illustrated in the insignificant relationship between ICT infrastructure and Interactive media, R.=.024, (P<.05). As the infrastructure is currently any increase in the level of its current performance would lead to an increase of (26%) in interactive media which is significant. This shows that ICT infrastructure should be improved in all Kenyan institutions of higher education.
b. TRAINING
The study also sought to establish how training affects the enhancement of e-learning with the use of interactive multimedia in institutions of higher learning in Kenya. The study results reveal that training is a significant influencer of enhancement of e-learning with interactive multimedia in institutions of higher learning in Kenya.
c. TECHNICAL SUPPORT
The study also sought to establish how technical supports affect the enhancement of e-learning with the use of interactive multimedia in institutions of higher learning in Kenya. The study results reveal that technical support is a significant influencer of enhancement of e-learning with interactive multimedia in institutions of higher learning in Kenya.
d. ICT POLICY
The study sought to establish the effect of ICT policy on the enhancement of e-learning with the use of interactive multimedia in institutions of higher learning in Kenya. From the descriptive analysis, the study results revealed that majority of the respondents indicated that ICT policy as it is, is not an influencer of e-learning with the use of interactive multimedia in institutions of higher learning in Kenya. This is as revealed that ICT policy does not significantly impact e-learning with the use of interactive multimedia in institutions of higher learning in Kenya as indicated by beta of -.070 (p>.05). This is also revealed by the correlation between ICT policy and interactive media of R=-.042 which is insignificant.
e. ENHANCEMENT OF E-LEARNING IN HIGHER
INSTITUTION OF LEARNING
The study sought to establish how well e-learning with the use of interactive multimedia in institutions of higher learning in Kenya is implemented. It was found that, more needs to be done in the enhancement of the model more so in the ICT infrastructure and ICT policies in place within the universities. This is as established that, of the four variables used as factor variables (ICT Policy, Training, ICT Infrastructure, Technical Support), only training, technical support and ICT Infrastructure are significant predictors of e-learning with the use of interactive multimedia in institutions of higher learning in Kenya.
D. RECOMMENDATIONS
The study revealed that farther recommendations are needed to better e-learning in Kenyan institutions of higher learning. Concerning the ICT infrastructure, universities should improve on ICT infrastructure to make it adequate to meet the current and identified future ICT needs, and should avail more the required supportive software’s for E-learning with interactive multimedia. They should also improve on internet connectivity availability within universities, and avail more and quality electronic learning equipment such as computers, projectors.
Concerning ICT policy, institutions should have policies to promote or support ICT-based innovations by lecturers. They should also gear the ICT policies to fully support use of interactive media within institutions of higher learning. The need for this ought to be communicated clearly to the institutions’ administration so that it can be supported fully.
Page 221 www.ijiras.com | Email: [email protected] REFERENCES
[1] Agnew, P. W., Kellerman, A. S. & Meyer, J. (2008). Multimedia in the Classroom, Boston: Allyn and Bacon. [2] Agaba, D. (2010). Utilization of Makerere University
library information resources by academic Staff: Challenges and the way forward. Unpublished Masters Dissertation, Makerere University, Kampala, Uganda. [3] Albirini, A. (2006). Lecturers‟ attitudes toward
information and communication technologies. Journal of Computer and Education, 47, 373-398
[4] Amin, M. E. (2008). Social science research: conception, methodology and analysis. Kampala: Makerere University Printery.
[5] Aryatuha, H. (2009). Relationship between computerization and organizational effectiveness in day today running of business at MOH Headquarters in Kampala. Unpublished Masters Dissertation, Makerere University, Kampala, Uganda.
[6] Auerswald, M. and Magambo, J. (2009). Fostering ICT use in teacher education in Africa.
[7] Bagchi, K. and Godwin, U. (2010). Factors that affect the adoption of information and communication technology in Africa and OECD set of nations. University of Texas, 3 [8] Bauer, J. and Kenton, J. (2009). Towards technology integration in the schools: why it isn‟t happening. Journal of Technology and Teacher Education. 13 (4), 519-546. [9] Beebwa, E. (2009). Selection of secondary school
lecturers and students‟ academic performance in Mukono town council. Unpublished Masters Dissertation, Makerere University, Kampala, Uganda.
[10]Braak, J. V. (2011). Individual characteristics influencing lecturers‟ class use of computers Journal of Educational computing research, 25(2), 141-157.
[11]Brock, C. J. (2010). Surviving Change: A Survey of Educational Change Models, Syracuse, NY: ERIC Clearing House on Information and Technology.
[12]Busch, T. (2009). Gender group composition and self-efficacy in computer studies. Journal of Educational Computing Research, 15 (2), 125-135.
[13]Cameron K. S., and Ulrich, D. O. (2009). Transformational leadership in colleges and universities. Higher education: Handbook of Theory and Research. New York: Agathon
[14]Davis, D. W. (2009). Computers in the schools: A diffusion/adoption perspective. Educational Technology, 29 (11), 20-27.
[15]Ensafi, R., Zamiri, A., and Kahani, M. (2009). ICT challenges in education. Reflections from a developing country: Iran, with reference to the statistics from computer science students. The 2nd International
Conference on Virtual Learning, Ferdowsi University, Mashhad, Iran.
[16]Ensminger, D. C., Surry, D. W., Porter, B. E., and Wright, D. (2009). Factors contributing to the successful implementation of technology innovations. Educational Technology and Society, 7(3), 61-72.
[17]Farrell, G. and Shafika, I. (2010). Survey of ICT and education in Africa: A summary report based on 53 country surveys. Washington, DC: info/Dev/World Bank. http://www.infodev.org/org/en/publication.353.html 16/10/2010
[18]Farrell, G. (2010). Survey of ICT and education in Africa: Uganda country report. http://www.infodev.org 5/11/2009 [19]Free Online Dictionary (2nd Edition).
http://www.thefreedictionary.com/training.
[20]Hawkins, J. R. (2012). Ten lessons for ICT and education in the developing world. World link for development. [21]Hornby, A. S. (2010). Oxford Advanced Learner‟s
Dictionary.(7th Ed). India, Oxford University press [22]Hsin-Kai, W., Ying-Shao, H. and Fu-Kwun, H. (2009).
Factors affecting lecturers‟ adoption of technology in classrooms: Does school size matter? International Journal of Science and Mathematics Education, 6: 63-85 [23]Kariuki, M. (2009). Factors influencing pre-service
lecturers‟ use of laptops for teaching/learning purposes during practicum. European Journal of Social Sciences 7,(1) (2009)
[24]Katundu, D. (2010). The use and sustainability of Information Technology (IT) in academic and research libraries in Tanzania. Unpublished Ph.D. Thesis. Pietermaritzburg, University of Natal.
[25]Katushabe, A. and Kisambira, E. (2012). E-learning face with daunting challenges in Uganda.
http: // www.iconnect online.org. Retrieved on 25/3/2015 [26]Kasozi, A.B.K (2008). Univeristy education in Uganda. Challenges and opportunities for reform. Kampala, Fountain.
[27]Keeves, J. (2008). Education research methodology and measurement; An international handbook, New York: Pergamon press oxford.
[28]Kim, E. G. (2009). Towards a holistic model for the diffusion of education technologies in USA. Educational Technology and Society, 2 (4)
[29]Magambo, J. (2007). Use of Information and Communications Technologies (ICTs) in teacher education in Sub-Saharan Africa: Case studies of selected African universities. http://deposit.ddb.de/cgi-bin.pdf. Retrieved on 13/3/2009