A New Intelligent Model for Structural
Reliability Identification Based on Optimal
Machine Learning
Yi Wan
College of Physics and Electronic Information Engineering, Wenzhou University, Wenzhou, 325035, China Email: [email protected]
ChengWen Wu
College of Physics and Electronic Information Engineering, Wenzhou University, Wenzhou, 325035, China Email: [email protected]
Abstract—It is very difficult to built reliability design model of structural parts working in a complex and uncertain environment because of their dynamic time-dependent characteristic, an intelligent method of reliability analysis based on compound algorithm is presented in this paper, support vector machine and finite element analysis combined with Monte Carlo numerical simulation is integrated to improve simulation computing precision. This method is applied to reliability analysis of catenary system, mathematic model of reliability calculation on catenary system based on compound algorithm is built, and reliability of location supporting seat and location pipe are calculated by the method, location supporting seat and location pipe are critical force-bearing parts of catenary system in the high-speed electrified railway, and fault rate is very high, their reliability analysis is important research subject in railway system. In this paper, analysis method of location installation based on support vector machine and finite element combined with monte carlo is used, and the influence of outside parameter on location installation is analyzed by the model.
Index Terms—Support Vector Machine Theory, Reliability analysis and design, Monte Carlo, Finite Element Analysis, Catenary
I. INTRODUCTION
The catenary in the high-speed electrified railway is erected directly and no alternately, various size and structure are in motion and change under natural environment and complex loads, so frequent trip, electricity supply failure and frequent faults of pantograph and OCS become one of the most equipment faults affecting transportation safety.
Improving catenary system stability and reliability
plays an important role to improve operation efficiency and decrease operation faults of the high-speed electrified railway, particularly for some location parts, such as location supporting seat and location pipe, they are critical force-bearing parts of catenary system in the high-speed electrified railway and work in a complex and uncertain environment and are in dynamic changing because of all kinds of complex loads such as pantograph, wind and natural climate, so fault rate is very high, their reliability analysis and design are important research subject in railway system[1].
In reliability design model, stress-intention distribution model reveals clearly fault cause and the essence of reliability design, but it is difficult to establish stress and intention distribution and joint probability density function in dynamic time-dependent environment. In this paper, an intelligent method of reliability analysis based on compound algorithm is presented, support vector machine and analysis of finite element combined with Monte Carlo numerical simulation is integrated to improve simulation computing precision. Mathematic model of reliability calculation on catenary system and compound algorithm model are built, reliability of location supporting seat and location pipe are calculated by the method, and the outside parameter influence on location installation is analyzed by the model. It provides a new way for the design and research of reliability in complex railway system.
II. STRESS-INTENTION INTERFERENCE MODEL
Every components of mechanism part maybe invalid because all kinds of complex static loads and dynamic loads lead to internal stress exceed material intensity limit, the failure probability can be obtain by (1) according to stress-intention interference theory[2, 3].
ds d s f S
P P
D S
f = (δ− ≤0)=
∫∫
δ (δ, ) δ (1)Where
δ
=δ
(Xδ1,Xδ2,Xδ3....,Xδi) ,Manuscript received Nov. 1, 2010; revised Jan. 5, 2011; accepted Jan. 12, 2011.
)
,...,
,
,
(
X
S1X
S2X
S3X
SjS
S
=
.f
δS(
δ
,
s
)
is stress and intention joint probability density of every components, Xδi is structural intention, Xsj is stress. If T n X X XX =( 1, 2...., ) is random parameters
vector, then state function is Expressed as:
g(X)=δ(X)−S(X) (2) The components will invalidate if g(X)≤0 according to (2) and probability and statistics theory, failure probability and reliability can be calculated in a certain amount of random numbers
δ
and S. Intensity interference model of structural reliability analysis is shown in Fig.1.Figure1. Intensity interference model of structural reliability analysis
III. COMPOUND ALGORITHM MATHEMATIC MODEL OF RELIABILITY ANALYSIS
It is difficult to build reliability model of location supporting seat and location pipe because they work in a complex and uncertain environment. In this paper, reliability analysis method of location supporting seat and location pipe based on SVM and finite element combined with Monte Carlo is presented, integration algorithm course is as follows[3]:
1. Critical factors that influence the reliability of location supporting seat and location pipe are established, they are pre-tighten force P, contact wire tension T and wind speed W and ice-covering thickness d.
2. N groups of random data are generated according to statistical distribution for selected parameters, maximum stress in dangerous section for each group of parameters are calculated by the finite element[4]. After selecting the fragment structure unit, characteristic analysis of typical unit is necessary, relationship of any point displacement is derived by nodal displacements.
) ( } ]{ [ } { e u N
w = (3) Where {w} is column vector of any point
displacement in the unit, { }(e)
u is column vector of nodal displacement, [N] is shape function matrix. The
relationship of unit strain and unit stress and unit balance equation are obtained by (3).
) ( } ]{ [ } { e u B =
ε (4)
) ( } ]{ ][ [ } { e u B D =
σ (5)
) ( ) ( ) ( [ ] { } }
{ E e e
u k
P = (6) Where{ε}is strain column vector of any point in the unit, [B]is unit strain matrix, [D]is elasticity matrix,
dxdydz B D B
k]e [ ]T[ ][ ]
[ () =
∫∫∫
,{P}(e) is force column vector of unit equivalent node.Relationship between node load and displacement is built by principle of minimum potential energy, namely equilibrium equation of structure.
[ ]
K{ } { }
U = P (7)Where,
{ }
K is whole rigidity matrix;{ }
P is loadarray;
{ }
U
is displacement array.3. The N groups of data are acted as SVM training samples, input-output relation between external parameter and interior stress is built by support vector machine intelligent algorithm, optimized SVM algorithm uses different optimized objective function and replaces equation restriction by inequation restriction[5-8]. Given N trained sample:
{
,}
k=1N k k y
x ,where n
k R
x ∈ ,is input of n dimension training sample, yk ∈R is output of trained sample.
Objective optimized function of LS-SVM algorithm is:
∑
= + = n K k T e bw J w e W W e
1 2 , , 2 1 2 1 ) , (
min γ (8)
st y W xk b ek k N
T
k ( ) , 1,2, , .
. = φ + + = L
Where n nh
R
R →
⋅): (
φ
is kernel space mappingfunction; w∈Rnh is weight vector; R
ek ∈ is error variable; b is deflection variable;
γ
is adjustable parameter.Using (8), Lagrange function is obtained as
{
k k k}
T N
k
k W x b e y e
w J
L= −
∑
+ + −= ) ( ) , (
1
α
φ
(9)
Where
α
kis Lagrange multiplier.Calculating a partial derivative for (9) is obtained as ⎪ ⎪ ⎪ ⎪ ⎩ ⎪ ⎪ ⎪ ⎪ ⎨ ⎧ = − + + → = ∂ ∂ = = → = ∂ ∂ = → = ∂ ∂ = → = ∂ ∂
∑
∑
= = 0 ) ( 0 , 1 , 0 0 0 ) ( 0 1 1 k k k T K k k k N k k N k k k y e b x W L N k e e L b L x W W L φ α γ α α φ α L N⎥ ⎦ ⎤ ⎢ ⎣ ⎡ = ⎥ ⎦ ⎤ ⎢ ⎣ ⎡ ⎥ ⎥ ⎥ ⎦ ⎤ ⎢ ⎢ ⎢ ⎣ ⎡ + Ω y b I n T n 0 1 1 0
α
γ
(11)Where
[
]
TN
y
y
y
=
;1
L
;
]
,I
n=
[
;1
L
1;
]
]
T,[
α
α
N]
α
= 1;L; ,.
,
,1
,
,)
,
(
)
(
)
(
x
k Tx
lK
x
kx
lk
l
N
kl
=
=
=
L
Ω
φ
φ
Solving (11) is obtained as:
n n T n n T n I y I b 1 1 1 1 1 1 1 − − ⎥ ⎦ ⎤ ⎢ ⎣ ⎡ + Ω ⎥ ⎦ ⎤ ⎢ ⎣ ⎡ + Ω = γ γ
(
y b)
In 1n
1 1 −
⎥ ⎦ ⎤ ⎢ ⎣ ⎡ + Ω = − γ
α (12)
So function of LSSVM decision-making classification is
y k K x x b
N k k k + =
∑
= ) , ( ) ( 1α
(13)Where K(x,xk) is Gaussian Kernel Function,
{
2 2}
/ exp
) ,
(x xk x xk σ
K = − − .
Improved SVM reduces algorithmic complexity greatly by translating optimization problem into linear equation, at the same time, it establishes only two parameters
γ
,σ
by using Gaussian Kernel Function, pattern learning velocity becomes more rapid. Wherenh n R R → ⋅): (
φ
is kernel space mapping function; nhR
w∈ is weight vector;
e
k∈
R
is error variable; b is deflection variable;γ
is adjustable parameter.4. Material intensity distribution is established by testing and statistical data in document.
5. Reliability of location supporting seat and location pipe is calculated by numerical simulation-Monte Carlo, Monte Carlo method is that state function g is calculated by random sample, and g<0 is judged, the parts is considered failure if maximum stress exceeds limit state[9]. Testing total numbers N meets N ≥100/Pf , if
failure total number is L, failure probability
P
f isL/ Nand reliability
R
is 1 , calculation flow chart is shown −Pfin Fig.2.
Forty groups of basic variables are randomly generated according to the mean and variance of basic variables, then the stress S of each groups of basic variables are calculated by finite element software ANSYS[10], Thirty-five groups data are acted as training
samples, and five groups data are acted as testing data. In finite element calculating, entity model is turned into PARASOILD format, then it is lead into ANSYS software and solid92 tetrahedron unit is used, 16314 units 9200 nods are obtained by free-dividing meshes. Finite element analysis model is shown in Fig. 3 and Fig.4.
Figure2. Flow chart of reliability calculation based on SVM and Monte Carlo numerical simulation
b) Finite element model
c) Whole stress cloud imagery
d) Whole stress cloud imagery
Figure3. Finite element analysis of location supporting seat
a) Entity model
b) Finite element model
c) Whole stress cloud imagery
d) Whole stress cloud imagery
Figure4. Finite element analysis of location pipe
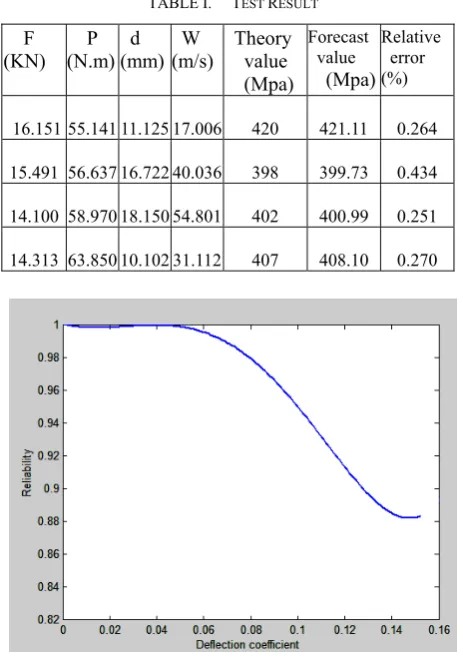
Table1 is testing result after SVM is trained, it is clear that theory values and SVM output values is very close from table1.
Location supporting seat reliability is calculated by integration algorithm mathematic model, the mean value and deflection coefficient of material intensity limit value of Location supporting seat is obtained according to according to statistics. Reliability calculating result is 0.999772, relative error is only 0.091% comparison with calculating result of JC method.
is shown in Fig.5-7. Distribution deflection coefficient of pre-tighten force P and contact wire tension T have a great influence on reliability, so reliability optimal design is necessary to reduce failures of catenary location installation[3].
TABLE I. TEST RESULT
F
(KN) (N.m) P (mm) d (m/s) W Theory value (Mpa)
Forecast value
(Mpa)
Relative error (%) 16.151 55.141 11.125 17.006 420 421.11 0.264 15.491 56.637 16.722 40.036 398 399.73 0.434 14.100 58.970 18.150 54.801 402 400.99 0.251 14.313 63.850 10.102 31.112 407 408.10 0.270
Figure5. Relation curve between deflection coefficient of wind speed W and reliability
Figure6. Relation curve between deflection coefficient of pre-tighten force P and reliability
Figure7. Relation curve between deflection coefficient of contact wire tension T and reliability
VI.CONCLUSION
Reliability statistical data is deficient because the reliability research of railway catenary system is just beginning, in addition, there are complex non-linear relation between each part internal stress of catenary system and external load, it brings great difficult to reliability research.
In this paper, an intelligent method of reliability analysis based on compound algorithm is presented in this paper, support vector machine and analysis of finite element combined with Monte Carlo numerical simulation is integrated to improve simulation computing precision. Mathematic model of reliability calculation on catenary system and compound algorithm model are built, reliability of location supporting seat and location pipe are calculated by the method, location supporting seat and location pipe are critical force-bearing parts of catenary system in the high-speed electrified railway, and fault rate is very high, their reliability analysis is important research subject in railway system, it is difficult to built reliability model of location supporting seat and location pipe because they work in a complex and uncertain environment. In this paper, analysis method of location installation based on support vector machine and finite element combined with monte carlo is used, and the outside parameter influence on location installation is analyzed by the model. It provides a new way for the design and research of reliability in complex system of railway.
ACKNOWLEDGEMENT
This work is supported by Natural Science Foundation of Zhejiang Province in China (No. Y1110302).The authors are grateful for the anonymous reviewers who
made constructive comments.
REFERENCES
[1] W. J. YU. High speed electrization railway catenary. Southwest Jiaotong University Press, Chengdu, 2002. [2] J. R. ZHANG. Structure reliability theory and application
2003.
[3] Y. Wan, “Connecting bolt reliability analysis based on finite element and machine learning theory”, IEEE computer society, 2010 second ETP/IITA World Congress in Applied Computing, Computer Science, and Computer Engineering/2010 ACC, 2010, pp323-326.
[4]S. K. YANG, “Simulation method of structure reliability based on artificial neural network. Mechanical intension”, Vol.21, No.4, 2002, pp12-16.
[5] R Xiao, J. C Wang, Z X Sun, “An approach to incremental SVM learning algorithm”, Journal of Nanjing University (Natural Sciences), Vol.38, No.2, 2002, pp152-157. [6] C. D Guo, S. Z Li, “Control - based Audio Classification
and Retrieval by Support Vector Machines”, IEEE Trans. on Neural Network , Vol.14, No.1, 2003, pp209-115. [7] Nello Cristianini, S T. John. An Introduction to Support
Vector Machines and Other Kernel-based Learning Methods. University Press, 2000.
[8] V N. Vapnik. Statistical Learning Theory. Springer-Verlag, New York, 2000.
[9] Kiyohiro. Reliability analysis of geometrically nonlinear structures with application to suspension bridges. Dissertation Abstracts International, the university of Michigan, 1999.
[10] Z.J.YANG. Intensity Analysis of Parts of the Middle Catenary Supporting. Southwest Jiaotong university, Chengdu, 2006.
Yi Wan JiangXi Province, China.
Birthdate: Feb, 1971. is Driving Technology and Intelligent System Engineering Ph.D., graduated from School of Mechanical Engineering, Southwest Jiaotong University. And research interests on intelligent control and system reliability theory.
He is an associate professor of College of Physics and Electronic Information Engineering, Wenzhou University.
ChengWen Wu Anhui Province, China.
Birthdate: Dec, 1974. is Computer Science and Technique Ph.D., graduated from Colledge of Computer Science and Technique Zhejiang University . And research interests on database techniqgue,semantic technique.