ISSN (e): 2250-3021, ISSN (p): 2278-8719
Vol. 06, Issue 01 (January. 2016), ||V4|| PP 45-51
Deriving River Bathymetry Using Space Borne Remote Sensing
Techniques In Bangladesh
Md. Shafiqul Islam Khondoker
1, Md. Zahid Hasan Siddiquee
2 1M Sc. in Engineering, Photogrammetry & Geoinformaticss, Stuttgart, Germany,Junior Specialist, Survey and Data Division, Institute of Water Modelling, Bangladesh,
2M Sc. in Engineering, Photogrammetry & Geoinformaticss, Stuttgart,Germany,
Associate Specialist, GIS Unit, ICT Division, Institute of Water Modelling, Banglades,
Abstract:- The Multispectral Remote Sensing (RS) Satellite - WorldView-2 - imagery has the ability to measure water depth up to 25m. Studies have been conducted based on the band ratio algorithm to determine water depth in the study area - the Ganges River in Bangladesh. Ratio assessment has been done for coastal-blue/blue, coastal-blue/green and coastal-blue/yellow bands. Green and NIR-2 bands are used for isolating the water area. The results of the RS investigation have been classified based on statistical analysis and graphical visualization of cross section profiles and DEM between actual depth and RS derived depth.
Keywords: -Remote Sensing, Actual Bathymetry, Relative Bathymetry, Absolute Bathymetry, Ratio algorithm, Worldview-2, Linear Regression, Atmospheric Correction, Pre-processing.
I.
INTRODUCTION
Since the launch the World View-2 (WV-2), ocean floor has become much clearer. It is a high-resolution multispectral satellite given that a coastal Blue bands (400-450 nm). The coastal blue band is enabled to see 25-30 meters depth of underwater. It has revolutionized bathymetric studies. Now, analysis can see deep into the water and distinguish features of the terrain clearly. The main objective of this study is to investigate remote sensing to estimate water depth using the multispectral satellite imagery. Study area is the Ganges River downstream of the Hardinge Bridge at Pakshi in the Kushtia district and off-take of the Gorai River (Figure 1). Institute of Water modeling provided bathymetric survey data during February 2013 for The Ganges River and Gorai River during February 2013. This bathymetry data have been used for calibration purposes against the derived bathymetry using space born remote sensing.
II.
SPACE
BORNE
REMOTE
SENSING
The World View 2 Multispectral Remote sensing image is Half-meter panchromatic and 2 meter multispectral high resolution satellite remote sensing image launched on October 2009. Eight spectral bands, 4 standard colors: Red, Blue, Green, and NIR-1 and 4 new bands: Red-Edge, Coastal Blue, Yellow and NIR-2. Worldview-2 combination of increased altitude, advanced agility, bi-directional push broom sensor detector and multiple ground station allows remarkable collection rates. Worldview-2 satellite orbit is 770 km altitude, 11-bits per pixel dynamic range and swath width of 16.4 kilometers at nadir view [8].
New bands the coastal blue (400-450nm) and yellow band (585-625 nm) of the WV-2 imagery are more potential for estimating water depth among new 4 bands. The coastal blue band is least absorbed by water and has the potential to improve atmospheric correction techniques. Therefore, it is useful in bathymetric studies. The yellow band is very important for feature classification. This band detects the “yellowness” of particular vegetation, both on land and in the water (Globe, D. 2009). The conventional blue band (450-510nm) also provides better penetration of water. (Michael, 2009) investigated that to determine the water depth using the (Stumpf et al. 2003) ratio algorithm, yellow/green and yellow/blue ratios improves the accuracy of depths compared to the green/blue ratio, particularly in shallow waters.
III.
METHODOLOGY
When light passes through water, it becomes attenuated. Shallow water areas appear bright, and deeper areas look darker on the image. Light attenuation and penetration is dependent on wavelength. Red band does not penetrate further than about 5 m in clear water, while blue band may penetrate clear water up to 25-30 m deep.
The purpose of this study is to derive water depth using World view 2 spaces born remote sensing technique. There are two methods are available to derive bathymetry from remote sensing imagery which are “linear method” and “ratio method”. The linear method is depended upon bottom type albedo. While different bottom types at the same depth would be incorrectly calculated for one of these two substrates. Hence, the Ratio method has been used in this study to overcome limitations of the linear method.
The ratio method compares the attenuation of two bands against one another. Consequently different bands attenuate at different rates at different albedo; one band will be different than the other. Therefore, the ratio between two bands will change with depth and difference of the albedo type on the mathematical equation would be accounted. The change in the type of the bottom layer on the reflectance should be similar to both of the two bands. Hench, the ratio of the reflectance of the two bands will remain unaffected with the change of albedo types over different substrates at the same depth (Stumpf et al. 2003).
To derive bathymetry from the remote sensing images (WV-2) the general processing technique details are in the following sections. There are three main steps are involved to estimate water depth using RS. Steps are shown in (Figure 2).
A. Convert the satellite digital number (DN) to radiance.
The Digital Number (DN) is the pixel value of grayness of an image that has not yet been calibrated into physically meaningful units. Convert the DN to radiance is the general steps for image analysis. This calibration steps are prerequisite for analyzing remote sensing imagery because of the multi-spectral satellite data (relative radiance) in the form of digital number (DN). Spectral radiance is the quantity of radiation which passes through or emitted from a surface within a solid angle in a specific direction. Initially we get the multispectral satellite image in the form of digital number DN Error! Reference source not found. Using the Meta data along with the image file (IMD) we can convert DN to absolute radiance of image pixels.
B. Convert radiance to reflectance
Reflectance is the light received by the satellite divided by incoming light from the sun. It is not directly measurable. Top of atmospheric radiance is subject to four factors; Earth-sun distance, solar zenith angle, topography and bi-directional reflectance distribution function. It is varies with wavelength, geometry and different object materials. Therefore, the radiance is necessary to convert to the percent of reflectance.
1) Earth-Sun Distance
The Earth-Sun distance is the astronomical units (AU). It is function of the image acquisition time and day of the year that must be accounted to calculate the Julian day(JD). Image Meta data contains the image acquisition time and date in the UTC time format. In this study calculated Earth-Sun distance is 0.9865912 AU and the image acquisition JD is 2455408.943 where Image acquisition date and time of the study area as on 2013/02/05 at 05:17: 07 hr UTC
2) Solar Zenith Angle
The sun angle change is very small over the 16.4 km image swath angle and the along-track image acquisition time. Therefore, the average solar zenith angle is sufficient for every pixel in the image (Globe, D. 2009). The average sun elevation angle is calculated for the center of the scene. Coordinate of the center of the scene is available in the .IMD files provided with the image. Using the average Sun elevation angle the solar zenith angle (θs) can be calculated using following Equation. The Sun elevation angel in this study area center is 47.7 degree. Therefore the calculated solar zenith angle is 42.3 degree (Solar zenith angle, θs = 90 − 𝑆𝑢𝑛𝐸𝑙).
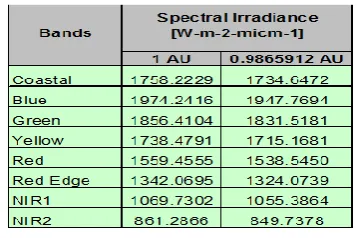
3) Solar Irradiance
Irradiance is the power of electromagnetic radiation (EMR) incidence on a surface from the sun. EsunλBand is the band average solar spectral irradiance [W−m−2 −μm−1]. WV2 Solar spectral irradiance shown in the Table 1. for each band for 1 AU as well as calculated AU of 0.9865912 for this study area according to the date and time of acquisition of the study area imagery.
C. Atmospheric correction
reflectance. For the estimation of bathymetry, visible wavelengths are used. The WorldView-2 visible wavelength range is 400-745 NM. The lower portions of the atmosphere where larger particles like water vapor, dust, pollen, salt partials are more abundant that are causes of Mie Scattering and affects the actual earth surface reflectance. Therefore, the proper atmospheric correction is necessary at the pre-processing steps to reduce the effects of atmospheric components of the electromagnetic radiation emitted or reflected from the Earth's surface. So, the appropriate atmospheric correction is required to retrieve the surface reflectance (that characterizes the surface properties) by removing the atmospheric effects especially lower atmosphere effects. The atmospheric correction significantly improves the accuracy of image classification.
D. Isolate the Water Area
In order to estimate bathymetry from the RS, isolating the water area from other non-water portion is necessary. Isolating water area is required for easily distinguish water body from the rest of the image in order to visualize more convenient way of the analysis result. The Normal Water Difference Index (NWDI) used to isolate water area. Green and NIR2 band have been used for isolating water area where Green is reflected band and NIR 2 is absorption wavelength in the water. Both are maximizes the reflectance of water compared to the land feature. Performing NWDI formula gives positive values in the water and non-water area gives negative values which are in between -1 and 1 of this ratio algorithm. Figure 4 shows isolated water area.
E. Determine relative bathymetry
The ratio algorithm has been used to determine the relative bathymetry which is the beginning steps of water depth derivation while absolute bathymetry is the next step. The ratio algorithm used the natural log transform of the ratio of the short wave length reflectance to the long wave length band reflectance value. The reflectance values are multiplied by 1000 to ensure that the logarithms remain positive for all reflectance values. According to the ratio algorithm, here Coastal blue and yellow band have been used to determine the relative bathymetry. Obtained relative bathymetry shown in Figure 5. It is found that the relative value is incasing when depth is increase. The result and analysis chapter discussed details.
F. Filtering the relative bathy
The reflectance is always contaminated by the atmospheric particles (Water vapor, dust, gases, etc.) Therefore, the effects of atmospheric components remain a noisy data is not impossible. The low pass filtering may be applied to eliminate noise data of the relative bathymetry to enhance the data quality.
G. Determine absolute bathymetry
Based on the direct surveyed bathymetric data, calibration has been made of the relative bathymetry to estimate the absolute bathymetry. The calibration factor m1 and offset m0 of the equation-1 has been obtained using an
optimized best fit curve plotted. A linear regression between relative bathy (reflectance ratio of Coastal blue & Yellow bands) and the actual depth of different transects have been plotted. Among them the one survey transect (Ganges River) has been selected based on high correlation values found in this section. The regression plot shown in the Figure 6. The obtained equation from the linear regression is 𝑦 = −110.3𝑋 + 97.96. Therefore, calibration factor, m1 = -110.3 and offset, m0 = 97.96.
The following ratio algorithm Equation-1 has been used to determine the absolute bathymetry. The component of the equation described below:
Ratio method:
𝒁 = 𝒎𝟏
𝒍𝒏 𝒏𝑹𝒘( 𝝀𝒊)
𝒍𝒏 𝒏𝑹𝒘( 𝝀𝒋) − 𝒎𝟎 (1)
Where,
m0, m1 = Offset (where Z=0) and Scale factor
n = Chosen constant e.g.1000 for overcoming negative values Rw = Reflectance of water
λi ,λj = wavelength of two different bands
Use of two bands overcomes the effect of bottom albedo
Ratio will change with depth and type of albedo
IV.
RESULT
AND
ANALYSIS
Objective of this study is to investigate multispectral remote sensing data from satellite for estimation of water depth. In this regard, sub-objectives are investigating how the maximum water depth estimation is possible in case of turbid braided river in Bangladesh. It was also intended to find the suitable band ratio for better results applying the ratio algorithm.
IWM have been conducted direct bathymetry survey of the Ganges River during November 2012 to March 2013 and on 6th February 2013 conducted bathymetry on the Gorai River while the investigated area worldview-2 remote sensing imagery was acquired on 5th February 2013. IWM provided bathymetry data including point position corresponding to the river bed elevation of the Ganges River. Therefore, based on the recorded time series water level data of the study area the water depth has been calculated for the date of 5th February 2013 on the Ganges River.
The DEM of actual water depth has been generated by the aid of ArcGIS 10.1 using IDW interpolation method shown in Figure 7a.
A. Analyzing Relative bathymetry
Different Band ratio has been used to estimating the relative bathymetry. Among three band combinations, Coastal-blue/Blue, Coastal-Blue/Green and Coastal-Blue/Yellow, the costal- blue/Yellow band ratio fount high correlation between relative bathy and actual depth. The correlation between actual depth and different band ratio shown in Figure 8 for each transect of the study area.
B. Analyzing Linear Regression Curve
The linear regression between relative bathymetry for the band ratio Coastal blue and yellow band in different transect has been plotted for both the Ganges and the Gorai River. The best fit curve has been selected among 6 linear regression plots Error! Reference source not found. the sample linear regression curve. The linear regression curve at transect ID XS-03 is optimum fit curve which R-squared value is 0.72. Therefore, the coefficient of the linear regression equation of the transect have been applied for estimation absolute bathymetry. An R-squared value varies between 45% to 72% among the all transects of the study area.
C. Absolute bathymetry analysis
The estimated absolute bathymetry Figure 7b calculated from the relative bathymetry by using the calibration factor and offset values obtained from the linear regression equation. The absolute bathymetry Equation have described in the previous section.
D. Comparison of Derived and Direct Bathymetry
It is visualized that the derived bathymetry from the Worldview-2 Remote sensing is fairly good except a particular segment of the Ganges River. The segment is flow dominating channel during the observation period. Figure 7a &7b bellow actual water depth DEM versus derived water depth DEM clearly identifiable the quality of estimated depth. Based on actual depth the estimated water depth has been classified in three classes considering the quality achieved. i) Very good; ii) Acceptable and iii) Not acceptable result. Comparison DEM along with colored transect lines shows all three result classes. Same color legends have been used for both actual and derived water depth to easily identify locations. The Ganges river flow dominating segment shows that the water depth is maximum 16 m while obtained derived water depth is 2-3 m. Nevertheless, remaining areas of the study area RS derived water depth is very good and acceptable. It is assumed that the particular channel segment found poor result is with high water velocity, contaminated by the suspended sediment which may not be suitable for penetration of the light wave during the time of image acquisition.
TABLES AND FIGURES
Relative Bathymetry Values:
Figure 2: Study area, the Ganges River, Bangladesh Figure 2: Analysis steps for determining water depth using RS
Figure 3: DN of image pixel Figure 4: Isolating water area from non-water part of the image
Figure 5: Relative bathymetry of Coastal blue and yellow band reflectance
V.
CONCLUSION
AND
RECOMMENDATIONS
Depth determination performed in two steps, relative depth and absolute depth. The linear regressions between relative depth and actual depth obtain the factor and offset to produce the predicted bathymetry. A statistical analysis has been performed in order to assess coastal blue and yellow band reflectance ratio. The correlation between ratio result and actual depth of Coastal blue and yellow is in between 0.6 and 0.8 all through the study area (Figure 8). Among all sections a single cross section has been used for ground truth (XS-03 on Ganges River) in which correlation value is 0.8 between relative depth and actual depth?
Further study can be made to improve the results such as evaluation of atmospheric correction, because in the lower portions of the atmosphere where larger particles like water vapor, dust, pollen, salt partials are more abundant which are causes of Mie Scattering and affect the actual earth surface reflectance. Hench, the proper atmospheric correction is necessary at the pre-processing steps. Furthermore, the impact of suspended sediment concentration and water velocity can be analyzed for more satisfactory results. Sun glint, Wave crest may also deviate the analysis results.
Finally, it can be concluded that WorldView-2 satellite’s coastal Blue band (0.4-0.45 micro meter) is the important band for RS bathymetry mapping. The remote sensing bathymetry can be used as the alternative
state-Figure 7: a. Survey Water Depth b) Derived Water Depth
(a) (b)
Figure 8: Correlation between relative depth and actual depth of different transect
Figure 9: Cross Section superimposed between Actual and Derived, Ganges River
Figure10: Cross Section superimposed between Actual and Derived, Gorai River
of-the-art where accuracy is not in the priority, or the navigational areas are risky or non-accessible. Clear visibility, less turbid water may be suitable for better result.
VI.
ACKNOWLEDGEMENTS
The authors express their gratitude to Institute of Water Modelling (IWM) for providing Bathymetry Data and Stuttgart University of Applied Science for providing WV2 Multispectral Remote sensing imagery in this study purpose.
REFERENCES
[1]. A. Naif, (2012). The Potential of Using Worldview-2 Imagery for Shallow Water Depth
[2]. Atmospheric Correction. Retrieved from http://www.umiacs.umd.edu/labs/GC/atmo/ Access date: 20-03-2014
[3]. Camacho, M. A., (2006). Depth analysis of Midway Atoll using Quickbird multi-spectral imaging over variable substrates. M. S. Thesis, Dept. of Space Systems Operations, the Naval Postgraduate School. [4]. D. Zhongwei, J. Minhe, Z. Zhihua (2008). Mapping Bathymetry From Multi-Source Remote Sensing
Images: A Case Study In The Beilun Estuary, Guangxi, China. The International Archives of the Photogrammetric, Remote Sensing and Spatial Information Sciences. Vol. XXXVII. Part B8. Beijing. [5]. ENVI. (August 2009). Atmospheric Correction Module: QUAC and FLAASH User’s Guide Retrieved
from http://www.exelisvis.com/portals/0/pdfs/envi/Flaash_Module.pdf Access date: 21-03-2014 [6]. Globe, D. (2009). the benefits of the 8 Spectral Bands of WorldView-2,
[7]. How remote sensing satellites work, retrieved from http://www.downtoearth.org.in/node/30386 Access date: 07-08-2014
[8]. http://www.satimagingcorp.com/media/pdf/Bathymetry_Datasheet.pdf Access date: 10-03-2014 [9]. http://en.wikipedia.org/wiki/Echo_sounding Access date: 21-03-2014
[10]. Institute of water Modeling. Retrieved from http://www.iwmbd.org Access date: 10-03-2014
[11]. J, Michael. J, Loomis. (2009). Depth derivation from the worldview-2 satellite using hyperspectral imagery. M.S. Thesis, Naval Postgraduate School, Monterey, California. Mapping. Thesis, Department Of Geomatics Engineering Calgary, Alberta