BUILDING PERFORMANCE SIMULATION:
A TOOL FOR POLICYMAKING
Drury Browne Crawley, IV, B. Arch.
A thesis submitted for the
Degree of Doctor of Philosophy
Energy Systems Research Unit
Department of Mechanical Engineering
University of Strathclyde
Glasgow, Scotland, UK
Copyright
Declaration
The copyright of this thesis belongs to the author under the terms of the United Kingdom Copyright Acts as qualified by University of Strathclyde Regulation 3.50. Due
acknowledgement must always be made of the use of any material contained in, or derived from, this thesis.
Table
of
Contents
Abstract
Dedication
Abbreviations
Figures
Tables
Chapter 1 The Power of Building Simulation as a Policy Tool
1.1 Importance of Simulation ... 1-1 1.2 What is Simulation? ... 1-2 1.3 Modelling Buildings ... 1-3 1.4 Energy Use in Buildings ... 1-4 1.5 Building Performance Simulation ... 1-5 1.6 Simulation as a Tool for Building Policy ... 1-8 1.7 References... 1-9
Chapter 2 Building Performance Simulation in Policymaking
2.1 Introduction... 2-1 2.2 Evaluation of Building Energy Standards ... 2-2 2.3 Building Model, Building Stock, and Utility Incentives ... 2-4 2.4 Climate Data in Building Performance Modeling ... 2-8 2.5 Modeling Climate Change and Urban Heat Islands ... 2-9 2.6 Data Issues in Multi-Building Studies ... 2-11 2.7 Summary ... 2-13 2.8 References... 2-15
Chapter 3 Defining Models and Processes to Support Policy Analysis
3.1 Introduction... 3-1
3.2 Developing Models to Support Thermal Envelope Analysis in a
Building Energy Code... 3-5
3.2.1 Background ... 3-5 3.2.2 Review of Standard 90.1 Envelope Load Correlations ... 3-6 3.2.3 Concerns about Using 90.1 Envelope Correlations for NECB ... 3-6 3.2.4 Predicted Heating and Cooling Loads from Envelope Correlations ... 3-7 3.2.5 New Prototypical Building Model for Envelope Correlations ... 3-8 3.2.6 Predicted Heating and Cooling Loads using New Prototypical
Building Model ... 3-9 3.2.7 Design of Parametric Analyses for Envelope Correlations ... 3-14 3.2.8 Development of Parametric Simulation Routines ... 3-19
3.3 Evaluating Performance Levels for Envelope Incentives in a New
Building Construction Program ... 3-19
3.3.1 Definition of Baseline Building Model ... 3-21 3.3.2 Design of the Analysis for the Envelope Incentives ... 3-21 3.4 Developing Models and Data Sets to Support Development of a
National Voluntary Program for Existing Building Retrofits ... 3-24
3.4.1 Parametric Energy Simulation of ESB Staged Implementation Approach ... 3-26 3.4.2 Creating Energy Simulation Databases for Envelope Upgrades
and Chiller Upgrades ... 3-33 3.4.3 Which Weather Data to Use? ... 3-37 3.5 Developing Building Models and Climate Data to Support Impact
Analysis of Climate Change and Urban Heat Islands ... 3-38
3.5.1 What are the Potential Impacts on the Built Environment? ... 3-40 3.5.2 A Bottom-Up Model for Evaluating Impacts of Climate Change ... 3-41 3.5.3 Selecting Weather Sources, Climate Regions, and Locations ... 3-42 3.5.4 Representing the Climate Change Scenarios ... 3-49 3.5.5 Representing the Urban Heat Island ... 3-53 3.5.6 Representing Building Stock ... 3-55 3.5.7 Design of the Simulation Study ... 3-58 3.6 References... 3-69
Chapter 4 Using Building Simulation to Define and Evaluate
Building Energy Standards
4.1 Introduction... 4-1 4.2 Defining Equivalent Performance Relationships for Building Envelopes in
an Energy Code ... 4-1
4.2.1 Envelope Performance Data Set ... 4-2 4.2.2 Creating Envelope Performance Correlations from the Data Set ... 4-3 4.2.3 Conclusions ... 4-6 4.3 Defining Envelope Incentives for An Electric Utility ... 4-7
4.3.1 Energy Performance of Envelope Options ... 4-7 4.3.2 Economic Performance of Envelope Options ... 4-8 4.3.3 Conclusions from the Evaluation of Potential Envelope Incentives ... 4-8 4.4 Energy and Economic Evaluation of Existing Building Retrofits ... 4-9
4.4.1 Results of Parametric Energy Simulation of ESB Staged Implementation
Approach ... 4-9 4.4.2 Simulation Results for Detailed Envelope Upgrades ... 4-27 4.4.3 Chiller Upgrade Results ... 4-36 4.4.4 Weather Data Comparison Results ... 4-36 4.4.5 Conclusions from ESB Analyses ... 4-46 4.5 Summary ... 4-47 4.6 References... 4-47
Chapter 5 Evaluating Climate Change and Heat Islands Impacts
on Buildings
5.1 Introduction... 5-1 5.2 Annual Energy Performance Results ... 5-2 5.3 Monthly End-Use Energy Performance Results ... 5-4 5.4 Variation in Energy Performance Results Due to Different Weather Years ... 5-8 5.5 Potential Energy Performance Impacts of Heat Islands and Climate Change
5.6 Summary ... 5-20 5.7 References... 5-22
Chapter 6 Summary and Conclusions
6.1 Research Summary ... 6-1 6.2 Policy Implications of the Simulation Studies ... 6-3 6.3 Conclusions ... 6-5 6.4 Future Work ... 6-11
Appendix A Weather Data and Data Sets for Envelope
Correlations ... A-1
Appendix B Prescriptive Envelope Requirements and
Results of Evaluation of Utility Incentives ... B-1
Appendix C Simulation Results for the Energy Star Buildings
Analyses ... C-1
Appendix D Simulation Results for the Evaluation of Potential
Abstract
Building energy and environmental performance simulation programs have the capability to evaluate a wide range of responses to external stimulus. Typically, these software tools are used by practitioners evaluating individual building design or retrofits. Other uses for building simulation include overheating prediction, heating and cooling equipment design, evaluation of alternate technologies (energy efficiency and renewable energy), regulatory compliance or, more recently, integrated views of multiple simulation results.
The most powerful use for simulation, however, lies in the ability to look beyond individual buildings to support policy decision making, including mandatory rule makings such as standards and codes, voluntary financial incentive programs such as those used by utilities to incentivize reduced power demand, evaluating and identifying opportunities for voluntary building energy efficiency programs, or to look at potential impacts related to broader policy levels such as heat island and climate change. Simulation, when coupled with building models that represent a range of building types and locations, can represent a portion of or the entire building stock.
This thesis researches how building energy simulation can be used to guide, define, determine, and support decisions by policy makers. Four research studies demonstrate how building performance simulation informs and defines building-related policy for standards, utility incentive programs, energy-efficiency programs, and the determination of climatic influence and sensitivity on building operating performance. These studies show how decision-makers have used building performance simulation to craft voluntary and
mandatory programs for building energy efficiency. From these four studies, a generalized framework of building-related policy research is derived with three major categories: research and policy focus, building model, and analysis structure and output data.
Dedication
To my wife, Anne, with thanks for the support, love, belief that it could and would be finally done, and patience for all the long days and nights when I was ‘working on my PhD’.
To Becca and Alex, for sort of understanding that Dad would one day be finished and have more time for them. (And for bringing joy into our lives.)
To my parents for a lifetime of support and belief in me.
To all my colleagues (and friends) at the Energy Systems Research Unit for the
encouragement and friendship all these years—stimulating conversations, hill walks, sailing, and outings to the pub. Special thanks to Professor Joe Clarke, advisor extraordinaire and friend; to Jon Hand for unceasing hospitality and a willing ear for half-baked ideas; and to Paul Strachan for insightful review which helped point out clear paths forward. And finally, thanks to Professor Jon Wright of Loughborough University, for careful, perceptive review which significantly improved the final thesis.
Abbreviations
AEDG Advanced Energy Design Guide
Ag glazing area
Aw wall area
AIA American Institute of Architects
ASHRAE American Society of Heating, Refrigerating, and Air-conditioning Engineers BERR UK Department for Business Enterprise & Regulatory Reform
BEPS Building Energy Performance Standards BIM building information model
BOMA Building Owners and Managers Association International CAD computer-aided design
CBECS Commercial Building Energy Consumption Survey CEC California Energy Commission
CFC chlorofluorocarbon CFM cubic feet per minute
CGCM2 Canadian General Circulation Model 2
CICES Commercial and Institutional Consumption of Energy Survey CO2 carbon dioxide
COP coefficient of performance
CSIRO2 Commonwealth Scientific and Industrial Research Organization CSIRO2 GCM
CSV comma-separated value CTZ2 California Thermal Zone 2
CV constant volume
CWEC Canadian Weather for Energy Calculations
DB dry bulb
DP dew point
DTI UK Department of Trade and Industry EDEM ESRU Domestic Energy Model EFLH equivalent full-load hours
EIA Energy Information Administration ESB Energy Star Buildings
FWR fenestration-to-wall ratio GCM general circulation model HadCM3 Hadley Circulation Model 3
HVAC heating, ventilating, and air-conditioning
IESNA Illuminating Engineering Society of North America IPCC Intergovernmental Panel on Climate Change IRR internal rate of return
IWEC International Weather for Energy Calculations LBL Lawrence Berkeley National Laboratory LCC life-cycle cost
NBECS Nonresidential Building Energy Consumption Survey NCDC National Climatic Data Center
NECB National Energy Code for Buildings NOx nitrous oxide
NRC National Research Council of Canada NRCan Natural Resources Canada
NREL National Renewable Energy Laboratory NSRDB National Solar Radiation Data Base
PCM National Center for Atmospheric Research GCM PSZ packaged single-zone
QA quality assurance RH relative humidity
SAMSON Solar and Meteorological Surface Observation Network SBEM Simplified Building Energy Model
SC shading coefficient SO2 sulfur dioxide
SP41 ASHRAE Special Project 41
SSPC Standing Standard Project Committee TMY Typical Meteorological Year
TMY2 Typical Meteorological Year 2 TRY Typical Reference Year UA U-value times area Ug U-value of glazing
US DOE U. S. Department of Energy
US EPA U. S. Environmental Protection Agency USGBC U. S. Green Building Council
Uw U-value of wall
VAV variable air volume VSD variable speed drive
WC water column
WYEC Weather Year for Energy Calculations WYEC2 Weather Year for Energy Calculations 2 WWR window-to-wall ratio
Figures
Figure 1-1. Percentage Energy Use by Sector for the World and Selected Countries ... 1-5 Figure 2-1. Annual Average Outdoor Temperature and Predicted Indoor Mean Air and
Radiant Temperature, °C, by Zone in Chicago, Illinois, USA ... 2-10 Figure 3-1. Coil Loads for East Orientation ... 3-10 Figure 3-2. Coil Loads for the North Orientation ... 3-11 Figure 3-3. Coil Loads for the South Orientation ... 3-12 Figure 3-4. Coil Loads for the West Orientation ... 3-13 Figure 3-5. Diagram of Four-Zone DOE-2 Building Model ... 3-14 Figure 3-6. DOE-2.1E Results, Ottawa, South Orientation, 21.5 W/m2 ... 3-15 Figure 3-7. Global Annual Average Temperature Change Predicted by Four Major Global
Climate Models ... 3-39 Figure 3-8. Commercial Building Energy End-Uses in the United States (EIA 2002) and
Europe (EC 2000) ... 3-42 Figure 3-9. Washington, D. C., Summed Heating and Cooling Degree Days Ranked from
Highest to Lowest ... 3-47 Figure 3-10. Washington, DC, Energy End-Use Consumption for 550 m2
Office Building ... 3-47 Figure 3-11. Resolute, Nunavut, Canada, Energy End-Use Consumption for 550 m2 Office
Building ... 3-48 Figure 3-12. San Juan, Puerto Rico, Energy End-Use Consumption for 550 m2 Office
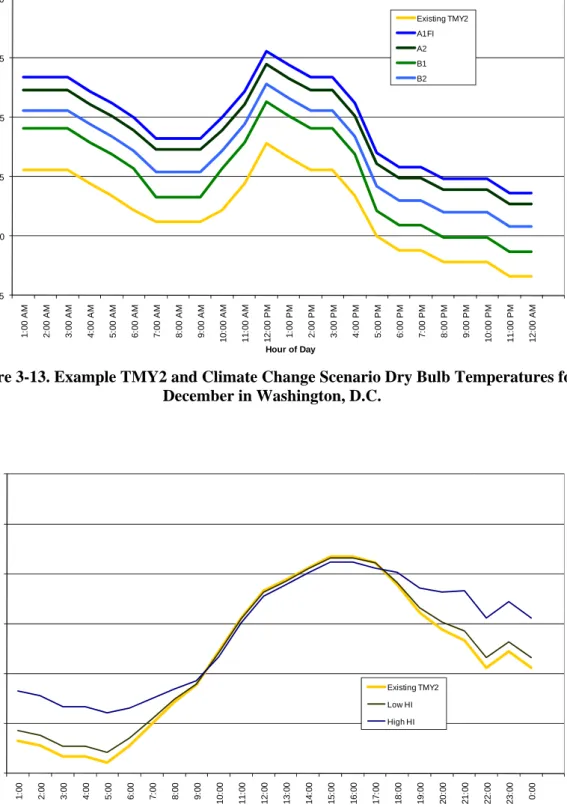
Building ... 3-48 Figure 3-13. Example TMY2 and Climate Change Scenario Dry Bulb Temperatures for
December in Washington, DC ... 3-56 Figure 3-14. Example TMY2 and Heat Island Dry Bulb Temperatures for April in
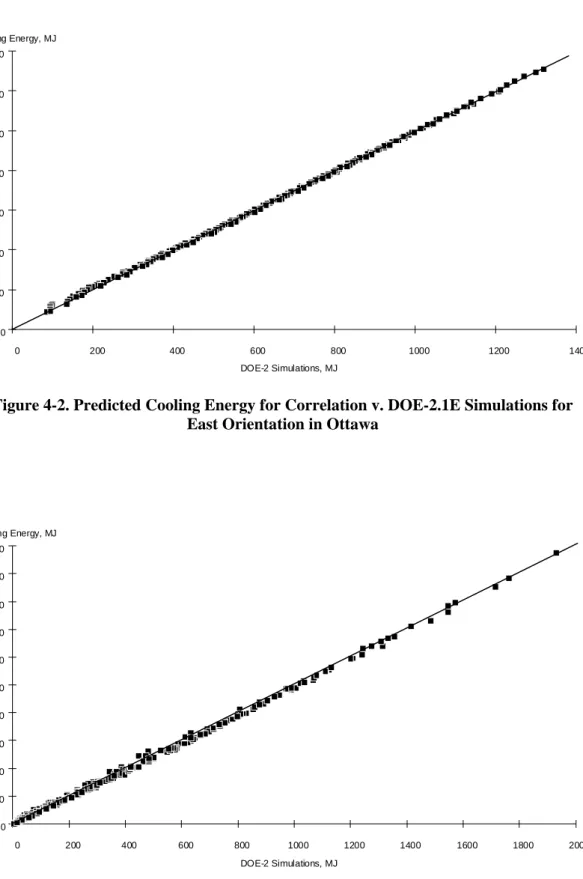
Washington, DC ... 3-56 Figure 3-15. Schematic of Small Office Building ... 3-64 Figure 3-16. Schematic of Low-Energy Building ... 3-64 Figure 4-1. DOE-2.1E Results, Ottawa, Ontario, Canada, South Orientation, 21.5 W/ft2 ... 4-4 Figure 4-2. Predicted Cooling Energy for Correlation v. DOE-2.1E Simulations for East
Orientation in Ottawa ... 4-5 Figure 4-3. Predicted Heating Energy for Correlation v. DOE-2.1E Simulations for East
Orientation in Ottawa ... 4-5 Figure 4-4. Energy End-Use by Stage for Mid-Rise Office Building with Gas Heat in
Washington, D.C. ... 4-19 Figure 4-5. Comparison of Energy End-Uses for Existing Buildings and Energy Star
Buildings Upgrade for the Three Office Building Sizes in Washington, D.C. ... 4-19 Figure 4-6. Comparison of Existing Buildings and Energy Star Building Upgrades for
Eight Locations ... 4-20 Figure 4-7. Annual Energy Cost Savings for Adding 13 mm Roof Insulation with Constant
Volume Reheat and High Lighting (24.75 W/m2) in Four Locations ... 4-30 Figure 4-8. Annual Energy Cost Savings for Adding 13 mm Roof Insulation
in Washington, D.C. ... 4-31 Figure 4-9. Cost-Effectiveness Results for Roof Insulation Upgrades with CV Reheat
System and High Lighting in Washington, D.C. ... 4-31 Figure 4-10. Cost-Effectiveness Results for Roof Insulation Upgrades with CV Reheat
Figure 4-11. Cost-Effectiveness Results for Roof Insulation Upgrades with VAV Reheat System and High Lighting in Washington, D.C. ... 4-32 Figure 4-12. Cost-Effective Results for Roof Insulation Upgrades with VAV Reheat
System and Low Lighting in Washington, D.C. ... 4-33 Figure 4-13. Effect of Roof Color and System Type on Roof Insulation Upgrade
Cost-Effectiveness for Washington, D.C... 4-33 Figure 4-14. Effect of Internal Loads (Lighting) and System Type on Roof Insulation
Upgrade Cost-Effectiveness for Washington, D.C. ... 4-35 Figure 4-15. Effect of Fan Motor Pulley Change-out and System Type on Roof
Insulation Upgrade Cost-Effectiveness for Washington, D.C. ... 4-35 Figure 4-16. Chiller Upgrade Simulation Results for All-Electric Mid-Rise Office
Building in Washington, D.C. ... 4-37 Figure 4-17. Annual End-Use Energy Consumption for a Gas-Heated Low-Rise Office
Building in Washington, D.C. ... 4-39 Figure 4-18. Annual Energy Costs by Year for a Gas-Heated Office Building in
Washington, D.C. ... 4-39 Figure 4-19. Comparison of Annual Energy Consumption for Weather File Types and
SAMSON Weather Data in Washington, D.C. ... 4-42 Figure 4-20. Comparison of Annual Energy Costs for Weather File Types and SAMSON
Weather Data in Washington, D.C. ... 4-42 Figure 4-21. Comparison of Annual Peak Loads in Washington, D.C. ... 4-43 Figure 5-1. Annual Site Energy End-Use Consumption, in MJ/m2, in Washington, DC, USA
for Standard, Developing, and Low-Energy Buildings Using Typical Year, Climate Change Scenarios, and Heat Island Cases Using Typical Weather Data ... 5-3 Figure 5-2. Annual Source Energy End-Use Consumption, in MJ/m2, in Washington, DC,
USA for Standard Building and Four Climate Change Scenarios Using Typical Weather ... 5-3 Figure 5-3. Annual Source Energy End-Use Consumption, in MJ/m2, in Washington, DC,
USA for Standard Building and High and Low Heat Island Cases Using Typical Weather ... 5-4 Figure 5-4. Monthly Source Energy End-Use Consumption, in MJ/m2, in Washington, DC,
USA for Standard Building and Four Climate Change Scenarios Using Typical Weather ... 5-6 Figure 5-5. Monthly Source Energy End-Use Consumption, in MJ/m2, in Washington, DC,
USA for Developing Building and Four Climate Change Scenarios Using Typical Weather ... 5-6 Figure 5-6. Monthly Source Energy End-Use Consumption, in MJ/m2, in Washington, DC,
USA for Standard Building and High and Low Heat Island Cases Using Typical Weather ... 5-7 Figure 5-7. Monthly Source Energy End-Use Consumption, in MJ/m2, in Washington, DC,
USA for Low Energy Building and High and Low Heat Island Cases Using Typical Weather ... 5-7 Figure 5-8. Monthly Source Energy End-Use Consumption, in MJ/m2, in Washington, DC,
USA for Developing Building and High and Low Heat Island Cases Using Typical Weather ... 5-8 Figure 5-9. Monthly Source Energy End-Use Consumption, in MJ/m2, in San Juan, Puerto
Rico for Standard Building and Four Climate Change Scenarios Using Typical Weather ... 5-9 Figure 5-10. Monthly Source Energy End-Use Consumption, in MJ/m2, in San Juan, Puerto
Rico for Low Energy Building and Four Climate Change Scenarios Using Typical Weather ... 5-9
Figure 5-11. Monthly Source Energy End-Use Consumption, in MJ/m2, in San Juan, Puerto Rico for Standard Building and High and Low Heat Island Cases Using Typical Weather ... 5-10 Figure 5-12. Monthly Source Energy End-Use Consumption, in MJ/m2, in San Juan, Puerto
Rico for Low Energy Building and High and Low Heat Island Cases Using Typical Weather ... 5-10 Figure 5-13. Monthly Source Energy End-Use Consumption, in MJ/m2, in Resolute,
Nunavut, Canada for Standard Building and Climate Change Scenarios Using Typical Weather ... 5-11 Figure 5-14. Monthly Source Energy End-Use Consumption, in MJ/m2, in Resolute,
Nunavut, Canada for Low Energy Building and Climate Change Scenarios Using Typical Weather ... 5-11 Figure 5-15. Monthly Source Energy End-Use Consumption, in MJ/m2, in Resolute,
Nunavut, Canada for Standard Building and Heat Island Cases Using Typical Weather ... 5-12 Figure 5-16. Monthly Source Energy End-Use Consumption, in MJ/m2, in Resolute,
Nunavut, Canada for Low Energy Building and Heat Island Cases Using Typical Weather ... 5-12 Figure 5-17. Percent Change in Annual Energy Consumption from the Typical Weather Data for Climate Change and Heat Island Cases in Washington, DC, USA ... 5-19 Figure 5-18 Percent Change in Annual Energy Consumption from the Typical Weather Data for Climate Change and Heat Island Cases in San Juan, Puerto Rico ... 5-19 Figure 5-19. Percent Change in Annual Energy Consumption from the Typical Weather Data for Climate Change and Heat Island Cases in Resolute, Nunavut, Canada ... 5-20
Tables
Table 3-1. Key Attributes of the Four Studies ... 3-4 Table 3-2. Heat Loss/Gain Parametric Cases ... 3-17 Table 3-3. Solar Gain Parametric Cases ... 3-18 Table 3-4. Internal Gain Parametric Cases ... 3-18 Table 3-5. Baseline Fenestration ... 3-22 Table 3-6. Baseline Wall and Roof Overall U-Values... 3-22 Table 3-7. Fenestration Options ... 3-22 Table 3-8. Fenestration Costs ... 3-23 Table 3-9. Wall Insulation Costs ... 3-24 Table 3-10. Roof Insulation Costs ... 3-24 Table 3-11. Office Building Stock Categories ... 3-28 Table 3-12. Office Building Stock Categories Characteristics ... 3-28 Table 3-13. Three Existing Office Building Models ... 3-29 Table 3-14 Base Case Assumptions: Building Equipment and Systems ... 3-29 Table 3-15. Stage 5 Upgrades by Building Size and Location ... 3-34 Table 3-16. Upgrade Costs by Stage ... 3-29 Table 3-17. Köppen Climate Classification System ... 3-44 Table 3-18. Selected Locations and Climate Characteristics ... 3-45 Table 3-19. Available and Selected Weather Years for the 25 Locations ... 3-50 Table 3-20. Weather File Type and Years with Highest and Lowest Energy ... 3-51 Table 3-21. Commercial Building Floor Area, Number of Buildings, Energy
Consumption and Other Characteristics by Principal Building Activity ... 3-59 Table 3-22. Office, Warehouse, and Retail Sectors Subdivisions ... 3-60 Table 3-23. Definitions of Eight Commercial Building Prototypes Based on CBECS ... 3-60 Table 3-24. Base Standard (Standard 90.1-2004) Wall, Roof, and Fenestration
Envelope Requirements ... 3-61 Table 3-25. Developing Standard Wall, Roof, and Fenestration Envelope
Assumptions ... 3-62 Table 3-26. Low-Energy Case Wall, Roof, and Fenestration Envelope Assumptions ... 3-63 Table 3-27. Low-Energy Case Photovoltaic System Tilt Angles ... 3-65 Table 3-28. Base Standard HVAC and SWH Equipment Efficiency ... 3-65 Table 3-29. Developing Standard HVAC and SWH Equipment Efficiency ... 3-65 Table 3-30. Low-Energy Building HVAC and SWH Equipment Efficiency ... 3-65 Table 4-1. Simulation Results for Wall Insulation Options in Toronto
with 21.5 W/m2 Internal Loads and 0.4 FWR ... 4-7 Table 4-2. Simulation Results for Roof Insulation Options in Toronto
with 21.5 W/m2 Internal Loads and 0.4 FWR ... 4-7 Table 4-3. Simulation Results for Fenestration Options in Toronto
with 21.5 W/m2 Internal Loads and 0.4 FWR ... 4-8 Table 4-4. Energy and Economic Results for Wall Insulation Options ... 4-10 Table 4-5. Energy and Economic Results for Roof Insulation Options ... 4-11 Table 4-6. Energy and Economic Results for Fenestration Options for Ottawa ... 4-12 Table 4-7. Energy and Economic Results for Fenestration Options for Sault Ste. Marie .. 4-13 Table 4-8. Energy and Economic Results for Fenestration Options for Schefferville ... 4-14 Table 4-9. Energy and Economic Results for Fenestration Options for Toronto ... 4-15 Table 4-10. Energy and Economic Results for Fenestration Options for Windsor ... 4-16 Table 4-11. Three Existing Office Building Models ... 4-18
Table 4-12. DOE-2.1E Simulation Results for Gas-Heated Existing Low-Rise Office
Building (4,461 m2, 3 floors) ... 4-18 Table 4-13. Energy Performance of the Five Stages for the Mid-Rise Office with
Gas Heat in Washington, D.C. ... 4-20 Table 4-14. End-Use Energy Performance of the Five Stages for the Mid-Rise
Office with Gas Heat in Washington, D.C. ... 4-20 Table 4-15. Calculated Major HVAC Equipment Sizes of the Five Stages for the
Mid-Rise Office with Gas Heat in Washington, D.C. ... 4-21 Table 4-16. Energy Savings of the Five Stages for the Mid-Rise Office with Gas
Heat in Washington, D.C. ... 4-21 Table 4-17. End-Use Energy Savings of the Five Stages for the Mid-Rise Office
with Gas Heat in Washington, D.C. ... 4-22 Table 4-18. Calculated Major HVAC Equipment Size Reductions of the Five Stages
for the Mid-Rise Office with Gas Heat in Washington, D.C. ... 4-22 Table 4-19. Economic Analysis of the Five Stages for the Mid-Rise Office with
Gas Heat in Washington, D.C. ... 4-22 Table 4-20. Atmospheric Pollution Reduction of the Five Stages for the Mid-Rise
Office with Gas Heat in Washington, D.C. ... 4-22 Table 4-21. Average Energy Savings, Economic Returns, and Load Reductions for
All Three Office Buildings and All Locations ... 4-23 Table 4-22. Average Energy Savings, Economic Returns, and Load Reductions for
the Three Office Buildings and All Locations ... 4-23 Table 4-23. Average Annual Energy Savings for All-Electric Office Buildings ... 4-26 Table 4-24. Average Annual Energy Cost Savings for All-Electric Office Buildings ... 4-26 Table 4-25. Average Annual Energy Savings for Gas-Heated Office Buildings ... 4-26 Table 4-26.Average Annual Energy Cost Savings for Gas-Heated Office Buildings ... 4-26 Table 4-27. Average Annual Energy Savings for All Office Buildings ... 4-27 Table 4-28. Average Annual Energy Cost Savings for All Office Buildings ... 4-27 Table 4-29. Example Results for Dark Roof with 25 mm Existing Roof Insulation in
Washington, D.C. ... 4-29 Table 4-30. Example Results for 25 mm Existing Wall Insulation with 0.4 FWR and
Fan Motor Pulley Change-out in Washington, D.C. ... 4-29 Table 4-31. Example Results for Single-Pane Glazing with 0.4 FWR and Fan Motor
Pulley Change-out in Washington, D.C. ... 4-30 Table 4-32. Chiller Upgrade Simulation Results for All-Electric Mid-Rise Office
Building in Washington, D.C. ... 4-37 Table 4-33. Variation in Simulated Annual Energy Consumption, Energy Costs,
Peak Electric Demand, and Peak Loads for SAMSON Weather Data ... 4-40 Table 4-34. Comparison of Simulated Annual Energy Consumption, Energy Costs,
Peak Electric Demand, and Peak Loads for Weather Data Files Types and
SAMSON Weather Data ... 4-45 Table 5-1. Ranges of Percent Change in Energy Performance for the Low and High Energy
Years in Comparison with Typical Weather Data Arranged by Köppen Climate Type (Hot Tropical to Severely Cold) ... 5-15 Table 6-1. Key Attributes of Analysis Structure and Output Data for the Four Studies ... 6-6 Table 6-2. Generalized Framework for Policy Analysis Using Building Performance
Chapter
1
The
Power
of
Building
Simulation
as
a
Policy
Tool
. . . I feel I have a great lot to learn, or unlearn. I seem to know far too much, and this knowledge obscures the really significant facts, but I am getting on.
Charles Rennie Mackintosh
1.1
Importance
of
Simulation
Simulation is one of the most important tools available in our world. To be able to construct a model and predict an outcome based on what has happened in the past or on current trends is critical to success in many fields, from micro and macro economics, aircraft manufacture, space exploration, and electronic circuit design to traffic planning, fire fighting, warfare, and the planning, design, construction, and operation of buildings.
Although today a simulation is likely to be a computer model of some physical or other predicable process, simulating or modeling systems is an ancient craft. For example, Egyptian pharaohs were buried with model boats several thousand years ago.
Why model or simulate something? First, a model allows evaluation of alternative designs, technologies, or processes without having to create the artifact being modeled. Second, some technologies require models to assess performance relative to competing options. For
example, airplane manufacturers use aerodynamic models of their proposed planes to test options and designs virtually. Building airplanes that cost hundreds of millions of dollars without relative certainty—based on simulation—that they will fly is risky at best and prohibitively expensive. Similarly, space exploration depends on models of planetary
movement to land a craft on a distant planet on arrival three, five, or more years in the future.
In short, it is cheaper to create a model of the underlying physical processes and test alternative configurations than to build a real prototype and have to change it later based on trial and error.
1.2
What
Is
Simulation?
Simulation encompasses a number of different but similar terms—modelling or models, simulation, and projection. The Oxford English Dictionary (2008) defines modelling as “a simplified mathematical description of a system or process, used to assist calculations and predictions.” WordNet (2006) defines modeling as “the act of representing something (usually on a smaller scale).” The American Heritage Dictionary (2008) takes the definition further:
model
A schematic description of a system, theory, or phenomenon that accounts for its known or inferred properties and may be used for further study of its characteristics:
a model of generative grammar; a model of an atom; an economic model.
Similarly, WordNet (2006) defines simulation as “the technique of representing the real world by a computer program; a simulation should imitate the internal processes and not merely the results of the thing being simulated.” Scott (2003) describes the broader aspects of economic models:
simulation
A mathematical exercise in which a model of a system is established, then the model’s variables are altered to determine the effects on other variables. For
example, a financial analyst might construct a model for predicting a stock’s market price and then manipulate various determinants of the price including earnings, interest rates, and the inflation rate to determine how each of these changes affects the market price.
Howe (2004) goes further and includes types of simulation and modelling, from physical to computer simulation:
simulation
Attempting to predict aspects of the behaviour of some system by creating an approximate (mathematical) model of it. This can be done by physical modelling, by writing a special-purpose computer program or using a more general simulation package, probably still aimed at a particular kind of simulation (e.g., structural
engineering, fluid flow). Typical examples are aircraft flight simulators or electronic circuit simulators.
Finally, simulation and modelling also can be used to project future behavior of a system.
Oxford English Dictionary defines projection as “an estimate or forecast based on present
trends” similar to the American Heritage Dictionary definition of “a prediction or an estimate of something in the future, based on present data or trends.” In summary, models describe how things work, simulation allows evaluation of physical and operational attributes, and project how that system will perform.
1.3
Modelling
Buildings
For thousands of years, architects and engineers have hand drawn scaled, two-dimensional models of their visions for buildings. These drawings—essentially the architect’s and the engineer’s models—are what the builder must interpret to construct the building. The
definitions of model and simulation show, however, that building modelling isn’t limited to a paper or electronic geometric description of the building. Architects also create scale
physical models to evaluate massing, shading, and daylight and to represent to clients who may not be able to visualize a building from drawings.
During the past several decades, architects and engineers have turned to computerized two-dimensional drafting or computer-aided design (CAD). Recently, CAD has begun to support three-dimensional, object-based representation of buildings, usually called BIM (building information model). Today, designers are likely to use sophisticated rendering and lighting tools to generate realistic-looking images of building designs.
For many years, building design engineers used rules of thumb or simple equations to estimate heating and cooling loads to select equipment sizes. As building systems, such as heating, cooling, water, and lighting, plug and process loads, and onsite power have
increased in complexity; designers have turned to computer-based models of the buildings to describe these complex interactions. They also may model the luminous environment of the building to design lighting systems, acoustical attributes, structural systems, or even the water and waste flows in plumbing.
1.4
Energy
Use
in
Buildings
The buildings constructed today might last 100 years or more, a period that will include numerous renovations and changes as well as regular replacement of equipment, systems, and components. Consider the 100-year-old buildings still in use today. During the life of those buildings, gas lighting was replaced by electric incandescent, then fluorescent; tomorrow, lighting will be solid-state. Those buildings’ electrical loads have skyrocketed: Manual office equipment changed to electric typewriters, photocopiers, facsimile machines, telephones, mainframe computers, distributed computing, personal computers, and printers. Coal-fired boiler radiant systems were replaced or supplemented by air heating and cooling systems. Single-pane windows became complex multilayered window systems with specialty gases. All these technological changes occurred during 100 years, with many of them
happening in the last 60 years.
Today, buildings are one of the largest sectors of energy use (see Figure 1-1). In the United States, buildings account for 40 percent of national energy use; in the United Kingdom nearly 50 percent. In both countries, industrial energy use is now 30 percent or less of total energy use. In developed countries, buildings are also the single largest user of electricity, with buildings accounting for 72 percent of electricity use in the United States and 50 percent globally. Worldwide, total carbon dioxide emissions in 2005 were estimated at 28.051 billion metric tonnes: 40.6 percent from coal use (11.378), 39.1 percent from
petroleum use (10.996), and 20.2 percent from natural gas use (5.666). Because buildings are the predominant users of electricity (coal, oil, and natural gas generation) and natural gas, they also are responsible for a large proportion of atmospheric pollution, including carbon dioxide, each year.
Recent studies in the United States have shown that improvements of 50–70 percent lower energy use beyond typical practice are easily attainable today at little or no increase in capital cost (Torcellini et al 2006). In fact, today it is cost-effective to build a net-zero energy building—one that annually produces more energy than it uses (Torcellini and Crawley 2006).
Many approaches are available for reducing the energy use in new and existing buildings. For example, building energy standards such as ASHRAE Standard 90.1-2004 (ASHRAE
0% 10% 20% 30% 40% 50% 60% 70% 80% 90% 100% Commercial Residential Transportation Industrial
Figure 1-1. Percentage Energy Use by Sector1 for the World and Selected Countries
2004a) provide guidance on cost-effective performance levels for individual components, systems, or whole buildings. Recently, ASHRAE (American Society of Heating,
Refrigerating, and Air-Conditioning Engineers), the American Institute of Architects (AIA), the Illuminating Engineering Society of North American (IESNA), the U.S. Green Building Council (USGBC), and the U.S. Department of Energy (US DOE) have created a series of Advanced Energy Design Guides (AEDG) (ASHRAE 2004b, 2006, 2008a, 2008b) that provide recommendations for achieving 30 percent energy savings over the minimum code requirements of Standard 90.1. The AEDG provide simple look-up tables of minimum insulation for walls, roofs, and floors, minimum equipment performance, and maximum lighting power by climate zone. Building type experts created these recommendations from a series of alternate packages for reducing energy use. These packages were simulated to determine the best combination that met the 30 percent energy savings target.
1.5
Building
Performance
Simulation
“Every building is a forecast. Every forecast is wrong.” (Brand 1994)
1
Every building design is based on assumptions about how the building will be used, but from its opening day, a building will be used differently than its designers assumed or planned. Over time the intended use will change too. The building designed as a warehouse suddenly has a dropped ceiling and an air-conditioning system and is now an office; two years later kitchen equipment turns it into a restaurant.
Buildings entail complex heat and moisture interactions of a physical space and the occupants. Imagine a simple single room with an occupant; the room has four walls, a window in one wall, a floor, and a ceiling. The walls, floor, and ceiling all conduct heat because the temperature on the other side of each is different. If the air is moving, convection moves heat throughout the space. The outside environment—temperature, humidity, wind speed and direction, rain and other precipitation—is changing with weather patterns. The window transfers light and heat into or out of the room. Depending on the colour and reflectance of the surfaces, light is reflected throughout the room. The sun moves across the sky in an annual, seasonal, and diurnal pattern, which varies the direction and intensity of solar radiation. Moving clouds affect the amount of direct and indirect radiation that the window and the walls receive. Active systems for lighting, heating, cooling, ventilation, humidification, dehumidification as well as occupants and their equipment increase the complexity.
For designers to understand how energy is used in a space, they must model these complex interactions of heat, light, and moisture. Thus, tools to support the design of low-energy buildings must adequately represent these complex interactions. No longer are simple rules of thumb and peak load design calculations enough. Designers must have and use building performance simulation software to address the complexity of today’s buildings. Building simulation is key to evaluating critical building performance issues, such as human comfort and productivity, energy efficiency, code compliance, and carbon reduction.
Because no utility bills or other measured data exist to indicate how a new building will perform, simulation is the only means of predicting energy performance before that building is constructed and operated. Simulation also is the most effective way of estimating
potential energy savings from retrofits in existing buildings. Energy and environmental performance simulation offers significant opportunities to support practitioners in reducing energy costs and subsequently preventing atmospheric pollution.
It is cheaper to simulate than to build a bad building.
Building performance simulation software has been available for more than 40 years (Clarke 2001), yet substantial recent advances in building simulation capabilities are providing new opportunities for integrating simulation into design practice. These advances range from fundamental improvements in simulation theory and models through software engineering, validation, user support, and systems that integrate multiple domains. During the past decade, building performance simulation programs have evolved from a strictly text-based, language-like input and output to multiple interfaces for different uses and users. Examples of robust building performance simulation programs include DOE-2.1E (Winkelmann et al 1993), EnergyPlus (US DOE 2008), ESP-r (ESRU 2008), and TRNSYS (Klein et al 2004). The robustness of the underlying simulation models and the user-friendliness of these programs have improved dramatically, gaining new users that might not have taken the time to learn the language of the underlying programs. At the same time, new users are
demanding more—online help systems, tutorials, and support systems, such as predefined databases of climate, materials, constructions, systems, and exemplars.
Crawley et al (2005) compare the technical capabilities of EnergyPlus, ESP-r, TRNSYS and 17 other building performance simulation programs. This survey includes a brief overview of each program and a series of 14 tables comparing:general modeling features; zone loads; building envelope, daylighting, and solar; infiltration, ventilation, room air, and multizone airflow; renewable energy systems; electrical systems and equipment; HVAC systems; HVAC equipment; environmental emissions; climate data availability; economic evaluation; results reporting; validation; and user interface, links to other programs, and availability.
Building energy and environmental performance simulation programs have the capability to evaluate a wide range of response to external stimulus. Practitioners evaluating individual building design or retrofits often use these software tools. Other uses for building simulation programs include overheating prediction; heating and cooling equipment design, alternate technologies (energy efficiency and renewable energy) evaluation, regulatory compliance, or more recently, integrated performance views.
1.6
Simulation
as
a
Tool
for
Building
Policy
Building performance simulation is regularly used to support decision making in the design or retrofit of individual buildings. Yet, the most powerful use lies beyond the performance of individual buildings in supporting building policy setting and decision making: to develop minimum standard regulations, assess the value of improved building performance for utilities or governments, or support high-level, public decision-making. Examples of policy targets include:
• defining a cost-effective performance level for various aspects of a new building energy efficiency standard,
• evaluating the performance of an existing or proposed building energy standard, • establishing financial incentives for improved building energy performance, i.e., the
value to the utility or political entity,
• evaluating the potential impact of and direction for voluntary programs encouraging energy-efficient new building design or existing building retrofit,
• evaluating the applicability of specific technologies or systems for the new building design or existing building retrofit markets,
• evaluating the potential for introduction of renewable energy technologies at the building, community or regional level,
• evaluating the potential impact of changes in regional, national or international policy, • evaluating requirements for existing or new energy supply at a regional or national level,
and
• evaluating the potential impact on building performance of changes relating to environment.
Coupling simulation with building models, which represent a range of building types and locations, can embody a portion of a building stock (existing or new, domestic, public, commercial, industrial, large, medium, or small) or the entire stock, which allows discrete modeling of building policy direction. Simulation provides policy decision makers a means of assessing what-if scenarios across a spectrum of buildings, ensuring that regulations and policy are set at the most financially and environmentally beneficial levels for individuals and the public.
The research documented here is not about the fundamental theory of building performance simulation or extending the capabilities of building simulation. Instead, a series of building
simulation studies demonstrates how building performance simulation informs and defines building energy policy. These studies include evaluating and setting performance levels for building energy standards, determining beyond-code utility incentives, and determining climatic influence and sensitivity on building operating performance. These four studies were selected to cover a range of policy targets where building simulation of large portions of a building sector is commonly used. Throughout the four studies, simulation is the key for evaluating the complex interactions of building thermo-physical characteristics, operation, and climate in support of the particular research goal or question. As a way to introduce building simulation as a policy tool, the examples of building simulation in use will demonstrate how they influenced decision makers crafting voluntary and mandatory programs for building energy efficiency and the policy analysis framework for using building simulation that is derived from these studies.
As Crawley et al (2005) showed, simulation tools can evaluate many aspects of building performance, such as capital and operating costs; energy performance and demand; human comfort, health and productivity; illumination; electrical flows; water and waste; acoustic design; renewable energy; and atmospheric emissions. Because the number of simulations involved was large, the research studies documented here focus on heating and cooling loads, energy use and cost, and capital cost.
THESIS: Building performance simulation is one of the most powerful tools available today for use by policy setters and decision makers looking to influence how buildings perform in terms of energy use and environmental impacts.
1.7
References
—. 2008. Compact Oxford English Dictionary of Current English, 3rd ed. Oxford: Oxford University Press. http://www.askoxford.com/
—. 2008. American Heritage Dictionary of the English Language, 4th ed. New York: Houghton Mifflin Company.
—. 2006. WordNet® 3.0. Princeton: Princeton University
http://dictionary.reference.com/browse/modeling
ASHRAE. 2004a. ANSI/ASHRAE/IESNA Standard 90.1-2004, “Energy Efficient Design of New Buildings Except Low-Rise Residential Buildings.” Atlanta: ASHRAE.
ASHRAE. 2004b. Advanced Energy Design Guide for Small Office Buildings. ASHRAE/ AIA/IESNA/USGBC/USGBC. Atlanta: ASHRAE.
ASHRAE. 2006. Advanced Energy Design Guide for Small Retail Buildings. ASHRAE/ AIA/IESNA/USGBC/USGBC. Atlanta: ASHRAE.
ASHRAE. 2008a. Advanced Energy Design Guide for K-12 School Buildings. ASHRAE/ AIA/IESNA/USGBC/USGBC. Atlanta: ASHRAE.
ASHRAE. 2008b. Advanced Energy Design Guide for Small Warehouses and Self-Storage
Buildings. ASHRAE/AIA/IESNA/USGBC/USGBC. Atlanta: ASHRAE.
Brand, Steward. 1994. How Buildings Learn: What Happens after They’re Built. New York: Viking–Penguin Group.
Clarke, J. A. 2001. Energy Simulation in Building Design, 2nd ed. Oxford: Butterworth and Heineman.
Crawley, D. B., J. W. Hand, M. Kummert, and B. T. Griffith. 2005. Contrasting the
Capabilities of Building Energy Performance Simulation Programs, July 2005.
Washington: U. S. Department of Energy.
Department of Trade and Industry. 2002. Energy Consumption in the United Kingdom. London: Department of Trade and Industry.
Department for Business Enterprise & Regulatory Reform. 2008. Energy Consumption in the
United Kingdom, 2008 Update. London: Department for Business Enterprise &
Regulatory Reform.
http://www.berr.gov.uk/whatwedo/energy/statistics/publications/ecuk/page17658.html
Energy Information Administration. 2008. International Energy Outlook 2008. September 2008, DOE/EIA-0484 (2008). Washington: Energy Information Administration.
http://www.eia.doe.gov/oiaf/ieo/
Energy Systems Research Unit. 2008. The ESP-r System for Building Energy Simulation, User Guide Version 11 Series, November 2008. Glasgow: University of Strathclyde. Howe, D. 2004. The Free On-line Dictionary of Computing
http://dictionary.reference.com/browse/simulation.
Klein., S. A., W. A. Beckman, J. W. Mitchell, J. A. Duffie, N. A. Duffie, T. L. Freeman, J. C. Mitchell, J. E. Braun, B. L. Evans, J. P. Kummer, R. E. Urban, A. Fiksel, J. W. Thornton, N. J. Blair, P. M. Williams, D. E. Bradley, T. P. McDowell, and M. Kummert. 2004. TRNSYS 16 – A TRaNsient System Simulation program, User Manual. Solar Energy Laboratory. Madison: University of Wisconsin-Madison.
Mackintosh, C. R. 1925. Letter to Frances Newbery, 28 December 1925, Collection of the National Library of Scotland.
Scott, D. L. 2003. Wall Street Words: An A to Z Guide to Investment Terms for Today's
Investor. New York: Houghton Mifflin Company.
http://dictionary.reference.com/browse/simulation
Torcellini, P. A., and D. B. Crawley. 2006. “Understanding Zero-Energy Buildings,”
ASHRAE Journal, pp. 62-69, Vol. 48, No. 9 (September).
Torcellini, P., S. Pless, M. Deru, B. Griffith, N. Long, and R. Judkoff. 2006. Lessons
Learned from Case Studies of Six High-Performance Buildings, NREL TP-550-37542.
Golden: National Renewable Energy Laboratory. US DOE. 2008. EnergyPlus. http://www.energyplus.gov
Winkelmann, F.C., B.E. Birdsall, W.F. Buhl, K.L. Ellington, A.E. Erdem, J.J. Hirsch, and S. Gates. 1993. DOE 2 Supplement, Version 2.1E, LBL 34947, November 1993. National Technical Information Service, Springfield, Virginia.
Chapter 2
Building Performance Simulation in Policymaking
We see the world piece by piece, as the sun, the moon,
the animal, the tree; but the whole, of which these
are the shining parts, is the soul.
Ralph Waldo Emerson
2.1
Introduction
In the context of building policy, performance simulation has been in wide use for more than 30 years in North America. These include evaluating the performance of new or proposed building energy standards, evaluating the value and design of energy savings programs for a utility or government entity, and evaluating the potential impact on the built environment of actions relating to climate change. Swan and Ugursal (2009) provide a comprehensive review of the various modeling techniques used for modeling residential sector energy consumption and they note:
“Two distinct approaches are identified: top-down and bottom-up. The top-down approach treats the residential sector as an energy sink and is not concerned with individual end-uses. It utilizes historic aggregate energy values and regresses the energy consumption of the housing stock as a function of top-level variables such as macroeconomic indicators (e.g. gross domestic product, unemployment, and
inflation), energy price, and general climate. The bottom-up approach extrapolates the estimated energy consumption of a representative set of individual houses to regional and national levels, and consists of two distinct methodologies: the statistical method and the engineering method. Each technique relies on different levels of input information, different calculation or simulation
techniques, and provides results with different applicability.”
Swan and Ugursal go further to say that the most appropriate use of these three approaches in modeling residential buildings corresponds to its strongest attribute:
• bottom-up statistical techniques for determining energy end-uses including behaviour based on energy bills and simple surveys, and
• bottom-up engineering techniques for explicitly calculating energy end-uses based on detailed characteristics, enabling impact of new (or alternative) technologies.
This chapter reviews related commercial building research in support of building policy where comparison of alternative technologies, systems, or climatic response is required—a bottom-up engineering approach—building energy standards, building stock models, utility incentives, and climate modeling. These areas are core to the discussion in subsequent chapters.
2.2
Evaluation
of
Building
Energy
Standards
Building energy standards are a set of definitions of minimum performance of building components and equipment. They can be as simple as a table of minimum efficiency levels for a packaged air-conditioning unit, minimum insulation levels for walls and roofs, or maximum lighting power density. Building energy standards also can be performance based, requiring that a new or existing building has energy consumption no higher than a prescribed value. Where does building performance simulation fit into building energy standards? The primary aim of performance simulation in standards has been to evaluate the energy savings associated with a proposed standard (as compared to typical building practice or existing standards).
National building energy standards date back to the 1970s. For example, ASHRAE
developed Standard 90-75 (ASHRAE 1975) to improve the efficiency of buildings in direct response to the oil embargo of the early 1970s. In the late 1970s, the US DOE proposed Building Energy Performance Standards (BEPS) (US DOE 1979) that set maximum energy performance levels for both residential and commercial buildings. A key feature of both the development and the proposed standards was the innovative use, at that time, of building performance simulation. Characteristics of typical buildings were collected throughout the United States, and baseline simulation models were constructed for more than 20 building types. Simulations were then performed and target levels established. Designers could then use building simulation models to demonstrate that their building performed at an energy level less than the maximum for that building type. Unfortunately, BEPS was too far ahead of the market and was buried under a landslide of adverse public comments.
Subsequent research by Pacific Northwest Laboratory (PNL 1983) used building simulation to propose aggressive updates to the then current Standard 90A-1980 in ASHRAE Special Project 41 (SP41) (Pacific Northwest Laboratory 1983). The SP41 proposals were based on life-cycle cost evaluation of the improved energy performance, evaluating ten buildings in six locations. This research was used as the starting point for the development of the next major update of Standard 90.1 in 1989 (ASHRAE 1989). Many of the public review drafts were tested by Pacific Northwest Laboratory for US DOE from 1985 through 1989, using five building prototypes and five locations (weather data) to evaluate energy savings levels. Interim energy simulation results were reported by Crawley and Briggs (1985a, 1985b), US DOE (1987), and Crawley and Boulin (1989), among others. A regional evaluation of state building energy codes in comparison with Standard 90.1-1989 was reported by Johnson et al (1988). The five building prototypes were developed to be typical of commercial buildings rather than representative of the entire stock of buildings. With only five building prototypes and five weather locations, the results from these studies could not extrapolated to represent the value of potential savings for the new standard across the entire commercial sector.
Carlo et al (2003) reported on an analysis of 12 prototype buildings to establish minimum requirements for a building energy-efficiency code in Brazil. While the code was based on Standard 90.1-1999, simulation allowed the researchers to customize the requirements to the climate and economic situation in Brazil. The goal was to create a multi-variable regression equation from the simulation results for calculating the annual energy consumption of a building in that location. The regression equation was tuned to that location with 10 coefficients. With 12 widely varying prototype buildings (in floor area and number of storeys), this required 1,616 combinations of envelope characteristics to be simulated. Carlo proposed to replicate this analysis for other Brazilian locations—requiring a similar number of simulations for each.
Recently, the European Union (EU) has established a Directive on the Energy Performance of Buildings (CEC 2001), which requires member states to create and deploy calculation methods for rating energy performance for buildings larger than 1,000 m2. This rating has a scale of A to H, where A is the lowest-energy and H the highest-energy buildings.
Throughout Europe, this directive is requiring the use of building performance modeling of many more buildings than in the past. In the United Kingdom, the Netherlands, and a few other countries, the building performance modeling required to rate non-domestic buildings has been implemented in a simple set of equations for predicting energy use, known as
Simplified Building Energy Model (SBEM) (BRE 2008a, 2008b). Rather than a model of energy use of a specific building, the SBEM is a comparative model for rating the relative carbon emissions of the proposed building. The SBEM uses monthly utilization factor calculations and is limited in the technologies that it can evaluate.
2.3
Building
Models,
Building
Stock,
and
Utility
Incentives
In a policy framework relating to building energy performance, the targets are individual buildings, but there is a need to establish how the proposed policy or standard will perform in a broader context—of new or existing buildings within a region or country. This requires an understanding of the building stock:
• the number and size of buildings being built and their operating and thermo-physical characteristics;
• the number and size of existing buildings and their operation schedules, energy consumption, energy costs, and thermo-physical characteristics.
Internationally, detailed data relating new or existing commercial building stocks to actual building energy performance are relatively scarce in comparison to what Swan and Ugursal found for the residential sector. Macmillan and Köhler (2004) found that national residential and commercial sector-level energy use data were generally available throughout the world. But they also found that detailed data on the building stock and its energy use was very limited—citing studies in North America and Europe. Barrett (2009) supports this in a review of recent building stock research—saying that papers “concentrate on domestic buildings in detail with less about the non-domestic buildings.” Barrett goes on to say that the non-domestic sector accounts for a large and growing proportion of energy use (as evidence in Figure 1-1) but the literature he reviewed provides few details of this growth. He asserts that this is due to the more heterogeneous nature of the commercial building stock and that empirical data is sparse.
In the United States, the Energy Information Administration has conducted quadrennial energy consumption surveys since 1979 for commercial, industrial, and residential buildings. These surveys provide a wealth of information about the numbers and consumption of the entire building stock based on a statistical representation of the sector and the
representativeness of several thousand buildings for each sector. The Commercial Building Energy Consumption Survey (CBECS) comprises survey data on more than 4,000 U.S. buildings (EIA 2007, 2002). But these data are not complete thermo-physical models of
each building. For example, there is little detail on the energy consuming systems or the thermal characteristics of the building envelope. Further, EIA masks certain data such as number of workers, number of floors and floor area in large buildings (more than 20 storeys and/or 45,000 m2) so that individual buildings cannot be identified. Griffith et al (2008) discusses the limitations of using the survey data in the context of a bottom-up research study—requiring supplementing the data with assumptions, defaults, data from other literature and probabilistic assignments.
Recently, Natural Resources Canada has published a similar commercial building survey for Canada (NRCan 2006), the Commercial and Institutional Consumption of Energy Survey (CICES). CICES includes information on 7,349 buildings, but it focuses on the floor area, building type, and the forms and amounts of energy used in the survey year. Key
information such as the number of floors or any information about the building envelope or heating and cooling systems is not collected. This limits the use of the CICES as a source of input for building simulation.
California has created a similar survey with more details on the surveyed buildings (PG&E 1999). This survey was recently updated and extended state-wide as reported by Kinney and Piette (2002). The updated survey included the collection of sufficient building
characteristics so that calibrated simulation models of each of the more than 2,800 commercial buildings could be created (Ramirez et al 2005).
The Building Owners and Managers Association (BOMA) publishes an annual report on U.S. office markets (BOMA 2007). BOMA publishes information obtained from more than 3,000 office buildings including income, expenses, energy consumption, rent, and occupancy rate. But similar to the surveys noted above, the minimum geometric and other key
information required for simulating the performance of those buildings is not collected by BOMA.
In Scotland, the Energy Systems Research Unit (ESRU) Domestic Energy Model (EDEM) (Clarke et al 2003, Clarke et al 2008, ESRU 2008) supports energy policy formulation for the residential sector. It provides representations of the entire domestic sector for Scotland, which allows policy makers to quickly apply a wide range of improvements analytically and evaluate which will provide the best energy performance or reduction in carbon. Analyses performed include national housing stock fabric upgrade strategies, local community
upgrade strategy and carbon roadmap formulation, carbon and energy performance, and energy labelling in compliance with the EU Energy Performance of Buildings Directive. But the EDEM is limited to the domestic sector. An equivalent model for the non-domestic sector is not available.
The International Energy Agency (IEA) also publishes energy use data for buildings in member countries (IEA 2008), but this is a statistically disaggregated estimate, a top-down inference based on energy production and supply data. Little information is available on the average energy performance of buildings by type or climate zone.
While survey data are extremely useful for a building stock snapshot, they usually are limited by the information collected. Only rarely are there enough data to create a building model in energy simulation software. Several projects have worked to use existing survey data to create prototypes that represent large portions or building types and regions. Briggs et al (1987, 1992) created 20 existing office building prototypes, and Crawley and Schliesing (1992) created 10 new office building prototypes for use by the Gas Research Institute in research and market assessment. The existing building models were based on the 1979 Nonresidential Buildings Energy Consumption Survey (NBECS), the first survey in the CBECS. The new building models were based on Standard 90.1. In both cases, substantially more input data were required for the models, and sources are documented in their reports. Huang et al (1991) extended the prototypes to the entire commercial sector for 20 urban markets in the United States. Huang and Franconi (1999) updated the prototypes to evaluate the contributing components of commercial building loads. In all cases, these prototypes were limited by the assumptions that the authors had to make to create complete simulation models. Often these assumptions were not well documented.
Rather than producing prototypes to represent multiple buildings, Griffith et al (2007, 2008) created building simulation models for each of the more than 4,000 buildings in the 2003 CBECS. These building models were developed first as a baseline with energy features and performance consistent with Standard 90.1-2004 (ASHRAE 2004). Then low-energy
technologies and renewable energy systems anticipated to be available by 2025 were applied to the models. The result was an assessment of the technical potential for achieving zero-energy buildings throughout the commercial building sector in the United States. The conclusion was that the zero-energy building goal could be, on average, achieved in the commercial building sector. Building types which can reach the zero-energy target easily:
offices, warehouses, schools, and retail. Restaurants, hospitals, and other energy-intensive building types will be the hardest to bring to net zero-energy. While not creating prototypes improved the breadth and representativeness of the analysis, it also created a logistic and quality assurance issue—how to deal with multiple thousands of building models. Griffith used an XML schema associated with a database of inputs to define each model. Since the inputs were derived directly from the CBECS data or related assumptions, the inputs could be automatically verified before a series of simulations were started.
Recently, Deru et al (2008) published a set of 16 benchmarks for new commercial buildings based on the 2003 CBECS and ASHRAE Standard 90.1-2004. The benchmark buildings descriptions include a scorecard comprising detailed documentation of all inputs and assumptions as well as information and data sources. Each benchmark building also has a corresponding EnergyPlus input files (US DOE 2007).
For utilities, the economic benefit of incentives paid for improved energy efficiency is often obscured by their regulated environment and the complex valuation of equitable sharing of net benefits, cost capitalization, and risks with their stakeholders. Rather than evaluating individual incentives, they aggregate the energy efficiency measures into a portfolio, essentially a top-down approach to the utility sector. For example, Cappers et al (2009) present an analysis of energy efficiency incentives in the context of a prototypical investor-owned utility. This analysis adapts a spreadsheet-based financial model (known as the Benefits Calculator) developed in support of the National Action Plan for Energy Efficiency (Jensen 2007).
The literature is full of similar portfolio-centric approaches to energy efficiency with a focus on program costs, costs and benefits to ratepayers, and similar utility rate case calculations. Many consultants offer services to develop and evaluate incentives for utilities but few publish in the peer-reviewed literature, which may indicate that they see their utility incentive calculation methodologies and procedures as a business advantage. Instead, utilities focus on supporting their customers and administering the incentive programs. Ter-Martirosyan (2003) says that this is due to changes which began in the late 1980s, with public utility commissions and other regulators focusing on regulation of the incentives themselves rather than the rate of return the utility could earn. For utilities, this has a two-fold result—decreased quality and cuts in service (as described by Ter-Martirosyan) and less
interest in detailed engineering approaches that are overwhelmed by their heavily regulated environment.
2.4
Climate
Data
in
Building
Performance
Modeling
For many years, the unavailability of data was a limiting factor in what could be done to represent climatic conditions in a specific location or common climate conditions in a zone. More recently, better data sets have allowed aggregation of multiple locations and statistics to create maps and climate zones.
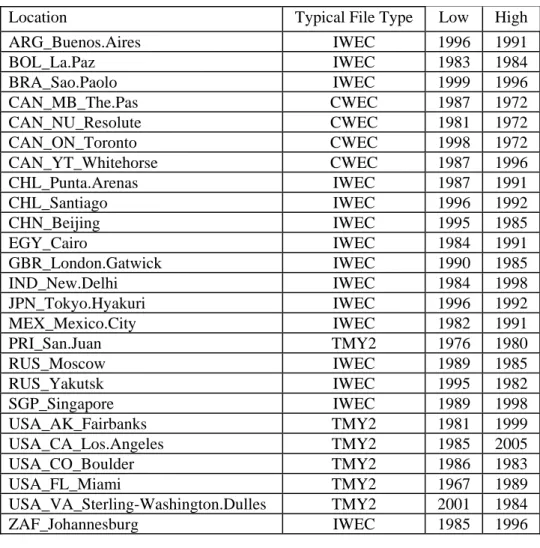
As recently as 15 years ago, limited weather data were available to building simulation users. Even in the early 1990s, the number of weather files available in the United States was fewer than 100 locations for a country of nearly 10 million km2. Today, the United States has more than 1,000 “typical” weather files available in the TMY3 format (Wilcox and Marion 2008) and another 1,000 weather files are available internationally1. Until more typical weather files become available as more meteorological data are collected, tools such as Meteonorm2 allow knowledgeable users to interpolate and extrapolate weather data for use in simulation tools, but even these tools are limited by the available data and statistics.
Building standards have used a variety of climate zones over the years. In Standard 90.1-1989, 38 climate regions were defined to represent that range of climatic conditions worldwide. A subsequent revision to the climate zones in Standard 90.1-1999 took the number of climate zones to 73. When this number proved unwieldy, research by Briggs et al (2003a, 2003b) evolved eight major climate zones with subcategories of wet and dry. This resulted in 15 climate zones, as shown in Standard 169-2006 (ASHRAE 2006).
Crawley et al (1999) proposed a new, neutral weather data format for building performance simulation programs. In the past nine years, more than 20 simulation tools and providers of weather data have adopted this format or adapted their climate data tools to read or write it. Hensen (1999) reviewed and identified issues with availability, temporal resolution, and data required for building performance simulation. He found that climatic data availability and
1
A list of publicly available typical meteorological data for more than 2,100 locations from 20 data
sets including source is available: http://energyplus.gov/weatherdata_sources.cfm. This list omits
proprietary or older data sets, such as the Test Reference Year (TRY) developed in the EU (CEC 1985), the older TRY in the United States (NCDC 1976), and the Weather Year for Energy Calculations (WYEC) and WYEC2 data sets from ASHRAE (1985, 1997).
2
resolution was still a significant issue in building performance simulation and that building performance tools increasingly need additional data such as illuminance, sky temperature, and pollutants that have traditionally not been widely available.
2.5
Modeling
Climate
Change
and
Urban
Heat
Islands
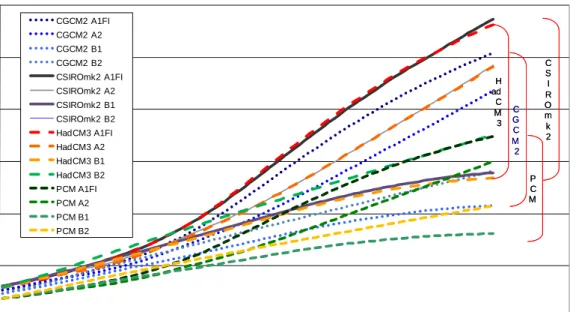
During the past 15 years, much scientific work has been published on humans’ potential impact on climates. For their Third Assessment Report in 2001 (IPCC 2001), the United Nations Intergovernmental Panel on Climate Change (IPCC) developed a set of economic development scenarios, which were then run with the four major general circulation models (GCM) to estimate the anthropogenesis-forced climate change. These GCMs produce worldwide grids of predicted monthly temperature, cloud, and precipitation deviations from the period of 1961–1990. As this period is the same used for several major typical
meteorological year data sets, these typical data sets can be used as a starting point for modifying weather files to represent predicted climate change. The IPCC summarizes the impact on the built environment simply as “increased electric cooling demand and reduced energy supply reliability.”
Trigo and Palutikof (1999) reanalyzed the HadCM2 data for Portugal using artificial neural networks to downscale the data to predict future climate conditions in Portugal. They found that the HadCM2 produced unreliable results for local sites in Portugal.
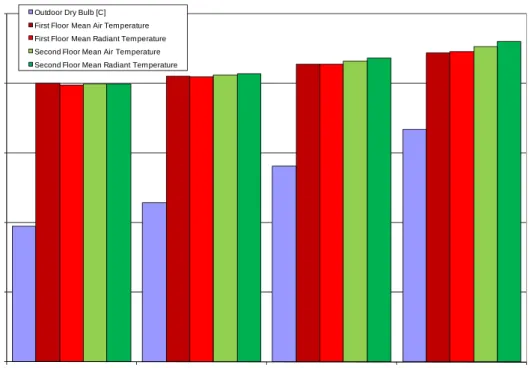
In a proof of concept study, Crawley (2003) found that temperature increases expected from climate change would substantially increase the operating time for cooling equipment in the United States and would shift many locations from heating (typically fossil fuel-based systems with conversion efficiencies of less than 1) to cooling (predominantly electrical systems with COPs greater than 2). By adding the annual average temperature predicted by the IPCC climate change scenarios to existing weather data for a few U. S. locations, he showed that annual average space temperatures would increase toward the cooling temperature set-point (see Figure 2-1).
Hacker et al (2005) looked at the potential summer overheating risks associated with the climate change scenarios in the United Kingdom for offices, schools, and houses. They then proposed measures for mitigating the overheating risks. Levermore took this research further
0 5 10 15 20 25 1990 2040 2070 2100 T e m p er a tur e , C
Outdoor Dry Bulb [C] First Floor Mean Air Temperature First Floor Mean Radiant Temperature Second Floor Mean Air Temperature Second Floor Mean Radiant Temperature
Figure 2-1. Annual Average Outdoor Temperature and Predicted Indoor Mean Air and Radiant Temperature, °C, by Zone in Chicago, Illinois, USA (Crawley 2003) and created climate change weather data for Edinburgh, Manchester, and London (CIBSE 2004)—tabular design conditions for potential future conditions. This results in a static data set of future climate conditions based on one model.
To support the development of the 2007 update report for the IPCC, Scott et al (2007) evaluated the potential impacts of climate change using a sector-wide, top-down model of the building sector, estimating increases in energy use and the value of building energy-efficiency programs. In their work, they started with an overview of the building sector in terms of energy use and estimated the impacts of changes in climate. Rong et al (2007) and Edmonds et al (2007) document a global macroeconomic model of energy use which includes the building sector by representing the demand for energy services—