Air Force Institute of Technology
AFIT Scholar
Theses and Dissertations Student Graduate Works
3-23-2018
The Application of Text Mining and Data
Visualization Techniques to Textual Corpus
Exploration
Jeffrey R. Smith Jr.
Follow this and additional works at:https://scholar.afit.edu/etd
Part of theDatabases and Information Systems Commons
This Thesis is brought to you for free and open access by the Student Graduate Works at AFIT Scholar. It has been accepted for inclusion in Theses and
Dissertations by an authorized administrator of AFIT Scholar. For more information, please [email protected].
Recommended Citation
Smith, Jeffrey R. Jr., "The Application of Text Mining and Data Visualization Techniques to Textual Corpus Exploration" (2018).
Theses and Dissertations. 1863.
THE APPLICATION OF TEXT MINING AND DATA VISUALIZATION TECHNIQUES TO TEXTUAL CORPUS EXPLORATION
THESIS
Jeffrey R. Smith Jr, Captain, USAF
AFIT-ENS-MS-18-M-163
DEPARTMENT OF THE AIR FORCE AIR UNIVERSITY
AIR FORCE INSTITUTE OF TECHNOLOGY Wright-Patterson Air Force Base, Ohio
DISTRIBUTION STATEMENT A
The views expressed in this thesis are those of the author and do not reflect the official policy or position of the United States Air Force, Department of Defense, or the United States Government. This material is declared a work of the U.S. Government and is not subject to copyright protection in the United States.
iii AFIT-ENS-MS-18-M-163
THE APPLICATION OF TEXT MINING AND DATA VISUALIZATION TECHNIQUES TO TEXTUAL CORPUS EXPLORATION
THESIS
Presented to the Faculty
Department of Operational Sciences Graduate School of Engineering and Management
Air Force Institute of Technology Air University
Air Education and Training Command In Partial Fulfillment of the Requirements for the Degree of Master of Science in Operations Research
Jeffrey R. Smith, BS Captain, USAF
March 2018
DISTRIBUTION STATEMENT A
AFIT-ENS-MS-18-M-163
THE APPLICATION OF TEXT MINING AND DATA VISUALIZATION TECHNIQUES TO TEXTUAL CORPUS EXPLORATION
Jeffrey R. Smith, BS Captain, USAF Committee Membership: Dr. C. M. Smith Chair Dr. B. C. Boehmke Member
v AFIT-ENS-MS-18-M-163
vi Abstract
Unstructured data in the digital universe is growing rapidly and shows no evidence of slowing anytime soon. With the acceleration of growth in digital data being generated and stored on the World Wide Web, the prospect of information overload is much more prevalent now than it has been in the past. This potential for overload may present users with issues such as difficulty finding and parsing relevant information, personalizing information to their needs, and using information to gain deeper insight. These difficulties also present a threat to industry leaders trying to maintain their share of the market and to military commanders defending this nation. As a preemptive analytic measure, organizations across many industries have begun implementing text mining techniques to analyze such large sources of unstructured data. This effort is not only being done to enhance their ability to retrieve and decipher known information, but to discover previously unknown information hidden within this unstructured data.
Utilizing various text mining techniques such as n-gram analysis, document and term frequency analysis, correlation analysis, and topic modeling methodologies, this research seeks to develop a tool to allow analysts to maneuver effectively and efficiently through large corpuses of potentially unknown textual data. Additionally, this research explores two notional data exploration scenarios through a large corpus of text data, each exhibiting unique navigation methods analysts may elect to take. Research concludes with the validation of inferential results obtained through each corpus’s exploration scenario.
vii
Acknowledgments
I would like to express my sincere appreciation to my faculty advisor, Dr.
Christopher Smith, for his guidance and support through the course of this thesis effort. I would also like to thank my committee member Dr. Bradley Boehmke for his dedication to my understanding of the R language, and Dr. Brandon Greenwell and Mr. Andrew McCarthy for guiding me through the code development process.
viii Table of Contents page Abstract ... vi Acknowledgments... vii List of Figures ... xi
List of Tables ... xiii
I. Introduction... 1
1.1 Background ... 1
1.2 Research Goal and Objectives... 3
1.3 Limitations ... 5
1.4 Assumptions ... 6
II. Literature Review ... 7
2.1 Chapter Overview ... 7
2.2 Background Information ... 8
2.2.1 Terminology and Concepts ... 8
2.3 Overview of Text Mining... 9
2.4 Applied Text Mining... 11
2.5 Information Extraction ... 14
2.6 Named Entity Recognition ... 15
2.6.1 Rule-Base Approach ... 17
2.6.2 Statistical Learning Approach ... 17
2.6.3 Dictionary Based Approach... 18
2.7 Corpus Exploration ... 21
2.8 Word Relationships ... 22
2.9 Summary ... 23
III. Methodology ... 25
3.1 Chapter Overview ... 25
3.2 Corpus Exploration Method... 25
3.3 Text Mining Techniques ... 27
3.3.1 Bag-of-Words ... 27
3.3.2 Preprocessing ... 28
ix
3.3.4 Term Frequency Analysis ... 29
3.3.5 Term Correlation Analysis... 30
3.3.6 Topic Modeling... 31
3.3.6.1 Cosine Distance Minimization Method ... 32
3.3.6.2 KL-Divergence Minimization Method ... 33
3.3.6.3 Information Divergence Maximization Method ... 34
3.3.6.4 Markov Chain Monte Carlo Maximization Method ... 35
3.3.7 Network Graph Visualizations... 35
IV. Results and Analysis ... 37
4.1 Chapter Overview ... 37
4.2 Data Generation... 37
4.2.1 Stage 1: News Source Selection ... 38
4.2.2 Stage 2: GDELT API 2.0 ... 38
4.2.3 Stage 3: Web Scraping... 40
4.3 Data Storage ... 41
4.4 Overall Dataset ... 42
4.5 Case Studies ... 44
4.5.1 Directed Search: Ballistic Missile Proliferation ... 44
4.5.1.1 Corpus A.1: 26 April – 01 May 2017 ... 48
4.5.1.2 Corpus A.2: 11 May 2017 – 17 May 2017 ... 52
4.5.1.3 Corpus A.4: 11 June 2017 – 15 June 2017 ... 57
4.5.1.4 Inferenced Information Summary ... 58
4.5.1.5 Data Validation ... 59
4.5.2 Undirected Search: Silk Road Initiative ... 64
4.5.2.1 Corpus B ... 66 4.5.2.2 Data Inference ... 73 4.5.2.3 Data Validation ... 73 V. Conclusion... 76 5.1 Results ... 76 5.2 Research Conclusion ... 76 5.3 Future Research ... 77
x
Appendix A: R Packages Used ... 80
Works Cited ... 82
xi List of Figures
Figure 1. Example of Entity Extraction Pipeline Architecture [22] ... 15
Figure 2. Example of Entity Extraction Technique [23]... 15
Figure 3. Typical Procedure of a DNR System [30]... 19
Figure 4. Flow of Analysis... 26
Figure 5. Undirected Network Graph Example [55] ... 36
Figure 6. Corpus A Document Frequency ... 46
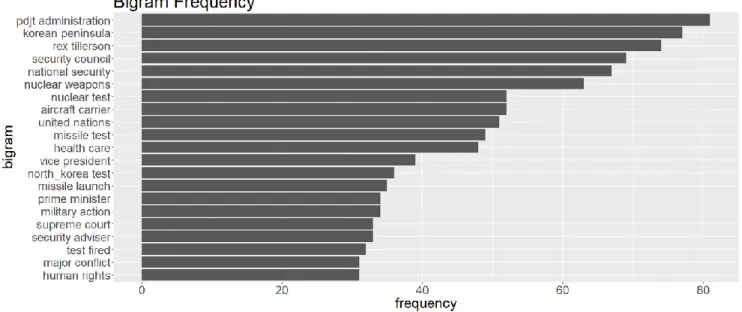
Figure 7. Corpus A.1 Bigram Frequency ... 48
Figure 8. Corpus A.1 Bigram Frequency ... 50
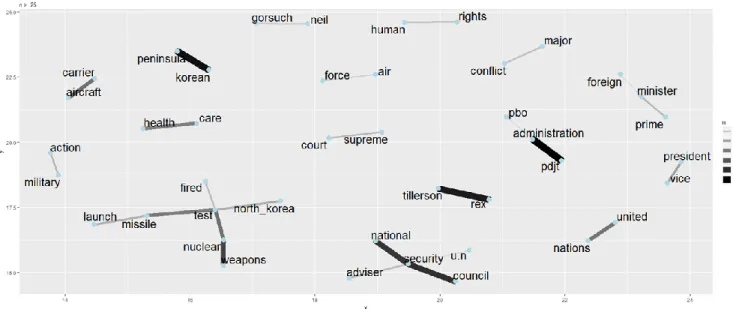
Figure 9. Corpus A.1 Bigram Network ... 51
Figure 10. Corpus A.1 Correlation Network ... 52
Figure 11. Corpus A.2 Bigram Network ... 53
Figure 12. Corpus A.2 Bigram Network ... 54
Figure 13. Corpus A.2 Correlation Network ... 55
Figure 14. Corpus A.2 Term Association: Hwasong ... 56
Figure 15. Corpus A.4 Bigram Network ... 57
Figure 16. North Korean Missile Launches 1984-2017 [58] ... 61
Figure 17. Estimated Timeline of North Korean Ballistic Missile Development ... 62
Figure 18. Estimated vs Accurate Event Occurrences ... 63
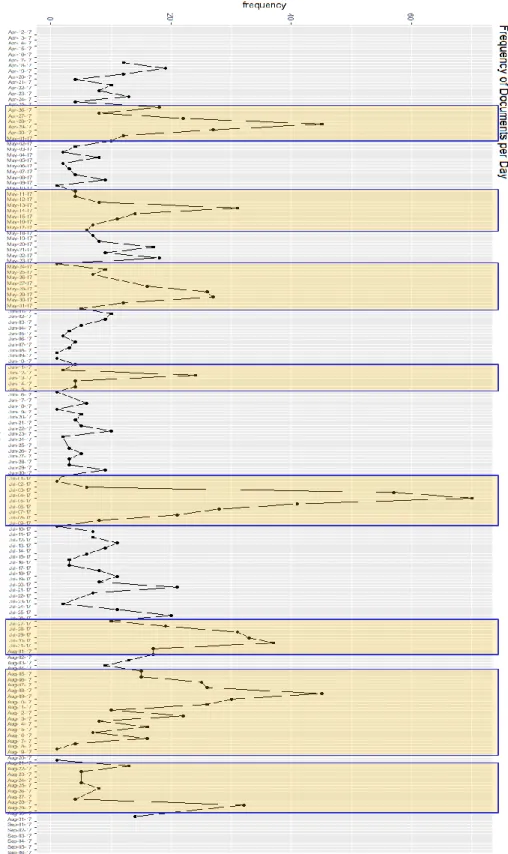
Figure 19. "Silk" Time Series Document Frequency Plot ... 65
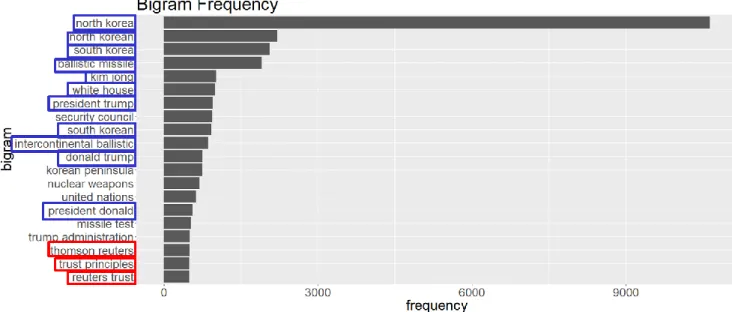
Figure 20. Corpus B Bigram Frequency ... 66
xii
Figure 22. Re-Examination of Corpus B Bigram Network ... 68
Figure 23. Corpus B Correlation Network ... 69
Figure 24. Topic N umber Analysis Output... 70
Figure 25. Topic Models ... 71
Figure 26. Topic 2: Bigram Network ... 72
xiii List of Tables
Table 1. N-gram Example ... 29
Table 2: Term Adjacency Matrix Example ... 30
Table 3. Summary of News Sources ... 38
Table 4. News Source API Access Examples... 39
Table 5. CSV Output Example ... 40
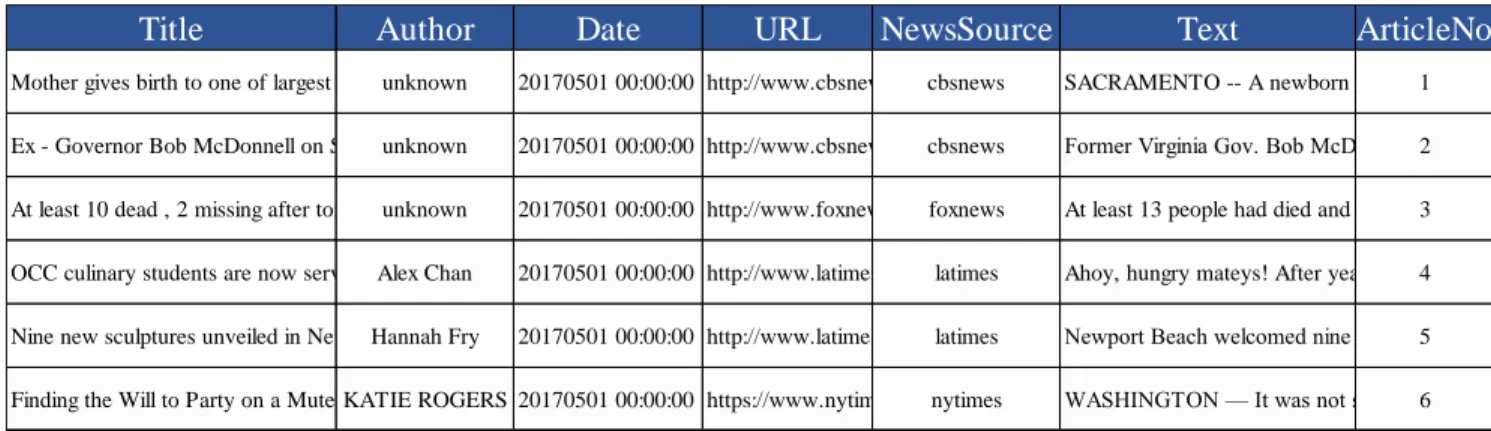
Table 6. Example Data Frame Structure ... 41
Table 7. Overall Data Date Range ... 42
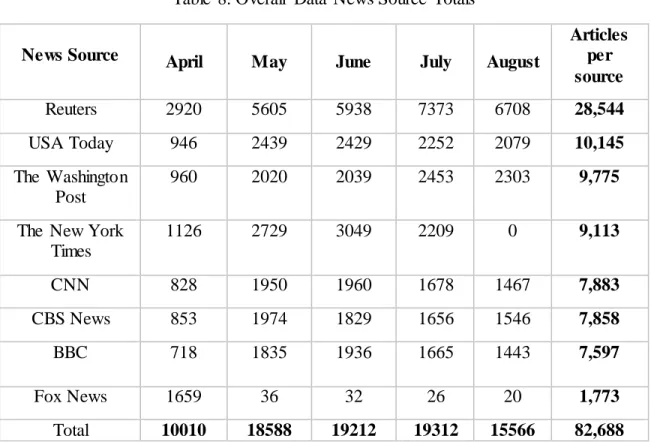
Table 8. Overall Data News Source Totals... 42
Table 9. Overall Dataset Term Counts... 43
Table 10. Summary of Corpus A’s Sub-Corpuses ... 47
Table 11: Corpus A.1 Summary of Merged/Deleted Terms ... 49
Table 12. North Korean Ballistic Missile Test Summary (18 April - 31 August 2017) [58] ... 62
Table 13. Topic Inferences... 71
Table 14. Silk Road Inference Accuracy ... 75
THE APPLICATION OF TEXT MINING AND DATA VISUALIZATION TECHNIQUES TO TEXTUAL CORPUS EXPLORATION
I. Introduction
1.1 Background
There has never been a time in the history of the digital universe where
information has been more readily available online. The explosive growth in digital data being generated and stored on the World Wide Web, has created a problem of
information overload much more prevalent than it has been in the past. A study produced by IDC suggests that the size of the digital universe is doubling every two years[1]. Furthermore, the expected growth in this data presents users with issues such as difficulty finding and parsing relevant information, personalizing information to their needs, and using information to gain deeper insight into their data. These difficulties present a threat to industry leaders trying to maintain their share of the market and to military
commanders defending this nation. To address the ever-increasing size of data created in this new information age, organizatio ns across many industries have begun focusing their efforts on methods to analyze large sources of data. This effort is not only being done to
2
enhance their ability to retrieve known information, but to discover previously unknown information.
The copious amounts of information being created daily make it necessary to implement methodologies and applications to extract relevant knowledge and provide meaningful insight. Originally this solution presented itself in the form of data mining, also referred to as Knowledge Discovery from Data (KDD) [2]. KDD is a method to automate the extraction of patterns representing knowledge implicitly stored or captured in large databases, data warehouses, the Web, other massive information repositories, or data streams [3]. The goal of the data mining process is to extract raw information from a large data set and transform it into understandable and useable information. These tasks are performed through the consideration of the applications of statistical and machine-learning methodologies to discover novel relations in large relation databases [2]. Data mining is an extremely powerful tool when applied to information that is already highly organized and easily searchable. This type of information is often referred to as structured data. While these KDD techniques work for structured data they are not as useful for data which is not highly organized such as digital media files, both audio and video, word processor documents, and text files. Such files as these are typically referred to as unstructured data. This data is not organized in a pre-defined manner as typically found in structured data. Unstructured data is typically text heavy, yet also contain multiple other data types such as numbers and dates. According to a 2011 study by IDC, unstructured data will account for more than 90% of the digital universe in the next decade [4]. Considering such a significant amount of data being unstructured and the high level of disorder inherent in these data sets it can be necessary to implement a method to
3
scour through this data and transform it into understandable information that can be easily used and analyzed. Text mining, also referred to as Knowledge Discovery from Text (KDT), is a specialized variant of data mining that facilitates the analysis of unstructured data [5]. It focuses on discovering unknown information and patterns, and extracting interesting, non-trivial information from large amounts of unstructured data. Text mining has continued to gain increasing attention in recent years. This attention stems from the large amounts of unstructured data that are being created from an ever-increasing number of sources, including social networks, data bases, and the world wide web to name a few. While the term text mining encompasses multiple topics, more specified applications maintain the primary goal of analyzing and discovering any interesting patterns, including trends and outliers, in text data. [6].
1.2 Research Goal and Objectives
Important aspects of text mining and the subsequent analysis of textual data reside in the mining techniques utilized, such as entity extraction, clustering, and visualization techniques such as network graphs. While analysts could read documentation and extract non-trivial information, this form of analysis can be extremely time and resource
intensive. Employing these techniques, this research will focus on the development of a textual corpus exploration software package that would allow analysts to not only sift through unstructured data at an accelerated pace, but understand the data quickly and clearly.
The overall objective of this thesis research is to create a text mining R software package [7], using R version 3.4.3, that will quickly and effectively scour massive
4
corpuses of semi-structured data in the form of news articles. News articles are an excellent proxy for many other document types which may be of a proprietary nature, or whose content contains information that is not publicly available.
Three specific objectives of this thesis research include the following:
Develop a methodology to allow the analyst to effectively and efficiently
explore large textual data corpuses through the utilization of various exploratory text mining techniques
Develop a robust user defined data manipulation feature that allows the
analyst, applying their subject matter expertise to the context of the textual corpus, the ability to create, merge, separate, and delete terms from the corpus. Additionally, manipulated data will then be interpreted in subsequent analysis.
Develop visualization methods as outputs to various text mining
techniques used throughout textual corpus analysis.
The overall application of this package will identify and parse relevant
information from each news article to be analyzed both individually and together as a single body of knowledge.
Additionally, applying statistical machine learning techniques in concert with a human-in-the- loop (HITL) factor, this package will allow analysts to be able to generate timely and useful data for decision makers. The algorithms applied to this R software package will focus on text mining techniques such as n-gram analysis, term correlation
5
analysis, and networks, and include information visualization methods to provide simple yet powerful graphics to aide analysis of these data sets.
1.3 Limitations
Data for this research was collected through accessing Global Database of Events, Language and Tone (GDELT) Project API. GDELT is one of the largest and most
comprehensive open database of the world’s news media consisting of over a quarter-billion event records in over 300 categories covering the entire world from 1979 to the present [8]. GDELT’s creator, Kalev H. Leetaru, has been studying the web and building systems to interact with and understand the impact it has made on society for more than two decades. The GDELT Project was born from the want to better understand global human society and the connection between communications and society’s behavior [8]. This research relied on data generation using the GDELT API and only links housed within this database were captured.
This database was accessed to extract news article links via the development of a web scraping algorithm. Due to the unique architecture of each online news source and the direct increase in algorithmic complexity and time with each additional news source, it was decided to limit the focus of data collection to eight specific, and recognized, and “trusted” news sources. These sources include Reuters, BBC, CNN, Fox News, CBS News, USA Today, Washington Post, New York Times. Data was also limited to the article URLs captured from each of these sources via the GDELT database, meaning that this research would only have access to data contained in the GDELT database.
6
Research was also limited in the range of time the news articles were acquired. The method used to generate the URLs for each news source restricted the user of generating data 85 days prior to the date of retrieval. During URL data generation, the earliest date applicable for data collection was April 18, 2017. An upper bound date of August 31, 2017 was determined as a sufficient end date for data generation. All news articles, from the eight news sources, generated for this research were collected between the date ranges of April 18, 2017 to August 31,2017. The method used to generate this body of data will be discussed in Chapter III.
1.4 Assumptions
The creation of a textual corpus exploration R software package will rely heavily on the combination of multiple, previously existing, R packages. The main underlying assumptions in the use of these packages are that they will continually be monitored and updated as newer versions of R are released and that each package works as intended by their creators.
Additionally, it is assumed all news article data generated from the above-mentioned news sources are accurate accounts of historical events (i.e., no fake news). This assumption focuses on the database in which data collection is performed. It is also assumed that the sample of news articles generated during the established period
represents a sufficient size to provide meaningful analysis and draw insightful
conclusions from. Potential bias among the various news sources was assumed to nullify between the various news sources. Therefore, potential idiosyncratic biases were not considered in the selection of news sources.
7
II. Literature Review
2.1 Chapter Overview
Unstructured data accounts for more than approximately 90% of the digital universe and is projected to continue growing in the coming years [4]. There is
speculation that the volume of unstructured data is growing at a rate of 62% per year and that by 2022, 93% of all data in the digital universe will be unstructured [9]. This
expected explosion in unstructured data growth, along with novel methods to capture, organize, analyze, and act on this new information, has become a hot topic across a variety of industries. This chapter provides a summary of the analytical framework that industry leaders are currently using to analyze unstructured data as well as a summary of the previous work done relevant to the research presented in this thesis and is organized as follows. The first section attempts to provide a synopsis of the history of text mining, the methodology used to explore text based unstructured data, and explains how text mining differs from other text analysis fields such as Natural Language Processing (NLP) and Information Retrieval (IR). Next, definitions of common terminology and concepts found in text mining will be presented. Following this, business cases exhibiting how text mining is currently being utilized in both the medical field and in industry will be
presented to help the reader better understand the usefulness of this analysis method. This section continues with a discussion of various text mining methods including IR, entity extraction, and named entity recognition (NER) approaches. Discussion then turns to an
8
explanation of corpus exploration. This section concludes with an examination of analysis methods used for word relationships.
2.2 Background Information
This research attempts to merge the distinct, yet similar, academic fields of Operations Research (OR), Natural Language Processing (NLP) and computer science to produce a robust, but easy to use, R package for the analysis of large textual data
corpuses. While these fields maintain distinct representations in term of their respective knowledge base, many analytical concepts and vocabulary are shared between them. This section focuses on bridging any terminology gaps between the academic fields with concentration on the R package deliverable for this thesis. This section begins by defining some common terminology and concepts used in text mining, as well as this study, to provide a baseline understanding of more technical notions of text mining. Next is a brief discussion of a typical text mining pipeline used in various text analysis applications and an explanation of associated terminology and processes.
2.2.1 Terminology and Concepts
The following are explanations of terminology and concepts found throughout the reviewed literature and the research conducted for this thesis. Most definitions are
provided through Dr. S. Vijayarani et al. [10] and Andreas Hotho et al. [11].
Natural Language Processing (NLP) – a computational research avenue which
explores methods in which computers can be used to understand and manipulate natural language
9
Information Retrieval (IR) – the ability to retrieve information from a number of
text-based documents
Filtering – comprises the various methods of removing words from text
documents. Words removed typically will bear little to no content information to the context of the text.
Stemming - a method of filtering used to reduce the number of words accurately
recognized in a text document. This procedure will remove the suffix of words to match the stems with the purpose of saving time and memory
Lemmatization - a method of filtering used to reduce the number of words
accurately recognized in a text document by attempting to map verb forms to the infinite tense and nouns to singular form.
Stop Words – extremely common words found throughout different
documentation which are usually of the form of articles, prepositions, and pro-nouns, etc. This words typically do not provide meaning to the documents.
Tokenization – text preprocessing method of splitting continuous word streams by
removing all punctuation marks and replacing all other non-text characters by single white spaces
2.3 Overview of Text Mining
Text mining is a method of uncovering hidden and extracting useful information with the purpose of assisting researchers who may be overwhelmed with vast amounts of textual data. The procedures and techniques involved in these processes differ greatly than that of the concept of Information Retrieval (IR). IR, in the academic setting, can be
10
described as the application of statistical techniques to search, index, and locate index specific material in large volumes of unstructured data [12].
While the information generally used for traditional data mining are typically housed in database systems, text data is typically managed via a search engine [13]. This method of managing text data allows users to implement information retrieval techniques to access specific topics. This method does not however, focus on analyzing text data to discover patterns and trends within the text and extract useful and high-quality
information. While text mining may provide useful methods to fill these analytical voids, it is not a simple task.
It has been acknowledged that the bulk of information growth has become one of the most formidable communication issues to arise in past century [14]. Although an interest in the ability to automatically analyze textual data has existed for decades, the initial focus of research into data and gaining analytical insight has been dominated by the field of data mining and the use of highly structured data formats. This was due to the technological limitations placed on information management systems and the early creation and reliance on relational databases. Relational databases are a means of storing information in tables and grew to popularity in the 1970’s. These databases utilize a predefined schema which store information in tuples (rows) and columns, making it a favorable method of storing numerical data. The structured nature of relational databases not only allowed data to be stored effectively, it also facilitated an efficient and effective means of data retrieval for use in business analysis. Data mining is an extremely powerful
11
tool when applied to information that is already highly organized and easily searchable such as this.
The goal of the data mining process is to extract raw information from a large data set and transform it into understandable and useable information. These tasks are performed through the consideration of the applications of statistical and machine-learning methodologies to discover novel relations in large relation databases [2]. While these KDD techniques work for structured data they are not useful for data that does not maintain such a highly organized structure such as is the case with unstructured data. Unstructured data is data that does not fit the structured schema of relational databases such as text heavy documents, pictures, and audio files for example. For this research, the term “unstructured” data will focus specifically on text heavy documents that may also contain multiple data types such as numbers and dates. With this level of disorder inherent in large data sets, it is necessary to implement a method to scour through and transform this data it into understandable information that can be effectively analyzed. This method of analysis takes the form of text mining and its applications can be found across various professional fields such as biomedical research, marketing, and
intelligence organizations.
2.4 Applied Text Mining
Text and data mining are having a profound effect on the medical field,
specifically in terms of biomedical research [15]. The Medical Literature Analysis and Retrieval System Online (MEDLINE) is a large bibliographic database containing life science and biomedical information including articles from academic journals.
12
MEDLINE holds information from a variety of medical fields and subjects including biology, biochemistry, medicine, nursing, pharmacy, dentistry, veterinary medicine, and health care, to name a few. In 2004, the MEDLINE database, already containing 12.5 million records, was experiencing a growth rate of 500,000 new citations each year [16]. A considerable growth rate such as this, would only increase the difficulty of keeping up to date with the new discoveries and theories being found across varying fields of
biomedical research. The potential for information overload in this arena increased the chance for important connections to be missed for new medical findings, on top of the potential for currently undiscovered connections already missed within the database.
Biomedical researchers addressing these issues have recently implemented biomedical text mining, a combination of techniques from natural language processing and text mining with the goal of allowing researchers to identify needed information more efficiently. This method of analysis also allowed for a general shift of the burden of information overload from the researcher to the computer [16]. To further expand on the capabilities and implementation of biomedical text mining, communities, such as the chemical compound and drug named entity recognition (CHEMDNER) task group, were formed to establish a united effort to evaluate biomedical text mining applications [17]. Application and integration of these novel biomedical research initiatives has resulted in the creation of multiple tools to assist with analysis. An example of how the biomedical community is utilizing text mining is through the use of Named Entity Recognition (NER), whose goal is to identify the frequency for names of specific drugs throughout a body of text or more specifically with a collection of journal articles. Methods such as
13
NER will identify these drug names in the hopes to extract further relationship information from the entity [16].
Advances such as this are allowing biomedical researchers to model, analyze, and understand complex biomedical, biological, and chemical systems at an accelerated pace through the analysis of text [18]. Applying text mining techniques to biomedical datasets Hu et al. [19] explores a statistical epistasis networks (SEN) approach to bladder cancer data. In short, the application of text mining, in concert with association-mining
techniques, have assisted in the production of a methodology which serves to be a promising tool to identify, previously identified, higher-order genetic relationships involved with potential tumor cell expansion.
The evolution of unstructured data in the digital universe has allowed businesses to connect with their customers in ways that were previously inaccessible. Consumer-generated content, data posted by consumers online through different mediums such as social media pages, blogs, and product reviews, is being used by companies to find novel combinations of customer “needs” that represent profitable new opportunities [20]. In a study by Netzer et al. [21], they illustrate the application of text mining to explore the market structure and brand-associative network derived from online customer forums discussing specific product categories. Throughout the course of the study, they leveraged associative and semantic networks to assess the proximity (or similarity) between several terms based on the frequency of their co-occurrence. The data that this study focused primarily on was customer data concerning cars. Here, the motivation was to find co-occurrences between two car brands, models, terms used to describe them and
14
all combinations in between. The researchers were able to identify connections that consumers were making about specific vehicles. For example, consumers frequently commented on the “plastic parts and interior” of the Toyota Corolla, as well as its “good mileage”. Using text mining in concert with network analysis, the researchers were able to develop a market structure from consumer-generated text that was highly correlated with the market structure derived from traditional data collection methods such as survey, transactional, and brand-switching data. The application of text mining to market
research is now allowing firms to assess online consumer discussions of their products, placement, branding and allows them to monitor their market position from a higher resolution position.
2.5 Information Extraction
The starting point for computers to begin analyzing unstructured data is to use information extraction. The goal of information extraction is to locate specific pieces of data from a corpus of natural-language texts [2]. This process is used to identify items such as people, places, and time to further provide meaningful information and insight to the researcher, and to uncover relationships within the text. Constructing an information extraction tool can often times be a complex undertaking, however. In order to alleviate this complexity, the task of information extraction naturally decomposes into a series of processing steps, typically including sentence segmentation, tokenization, part-of-speech assignment, and the identification of named entities, i.e. person names, location names, and names of organizations [11]. Figure 1 provides a visual example of an entity extraction pipeline architecture.
15
Figure 1. Example of Entity Extraction Pipeline Architecture [22] Figure 2 provides an example of how text can be identified and tagged using entity extraction principles.
Figure 2. Example of Entity Extraction Technique [23]
2.6 Named Entity Recognition
NER is the task of locating and classifying names in text [24]. According to Jiang et al. [25] NER is probably the most fundamental task in information extraction. She goes
16
further to explain that extraction of more complex structures such as relations and events depends on accurate named entity recognition as a preprocessing step. NER presents its own set of complexities as with information extraction. An entity may be mentioned over multiple instances throughout the course of text, but may be represented by multiple titles. For instance, “President Donald J. Trump” maybe titled as “President Trump,” “Donald Trump,” or simply “Trump”. While the text mining task could identify four unique entities, the user is aware that all four represent the same individual. As explained in [25], an entity also maintains the potential to be context-dependent. For example, the recognized entity, “JFK”, may refer to the person “John F. Kennedy,” or the location “JFK International Airport”. Here, it is necessary for the context of the entity to be considered to determine the entity type for “JFK” occurring in a document.
Context, is one of multiple challenges faced in application NER technology. Additional fundamental challenges that persist in this application are in the determination of the boundaries of the entity names in the text. This comes to fruition when analyzing entity names such as “Procter and Gamble” where that is the name of the single entity, but has the potential to be recognized as two distinct entities, “Procter,” and “Gamble”. This is problem is referred to as the entity delimitation problem [24]. Downey et al. describes another fundamental challenge to supervised NER techniques as the unseen classes problem. This problem focuses on the idea of ambiguity in the named entity recognition technology and the impracticality of hand tagging elements of each entity class to train supervised techniques.
17 2.6.1 Rule-Base Approach
There are multiple methods used in approaches to NER. One approach is to manually develop information extraction rules by encoding patterns. Typically, in rule-based methods a set of rules is either manually defined or automatically learned. Each token in the text is represented by a set of features. The text is then compared against the rules and a rule is fired if a match is found [25]. However, due to the variety of forms and contexts in which the desired information can appear, manually developing patterns is very difficult and will rarely result in a robust system [26]. Manually developed patterns are optimized to work well in specific situations whereas, it is likely that both the language and user’s needs will evolve over time. Additionally, this method of manually developed patterns may present difficulties in reflecting text that are less well behaved such as text that contains misspelled words or foreign words/phrases [24]. While rule-based approaches to named entity extraction and information extraction have provided sufficient results in the field of text mining, there has been more recent work
accomplished in developing NER technologies via the use of statistical machine learning [27].
2.6.2 Statistical Learning Approach
Machine learning is programming computers to optimize a performance criterion using example data or past experience. It uses the theories of statistics in building
mathematical models, because the core task is making inference from a sample [28]. Using statistical approaches, many NER algorithms treat the task as a sequence labeling problem. To map NER to this type of problem, each word in a sentence is treated as an
18
observation. The class labels must clearly indicate both the boundaries and the types of named entities with the sequence. Like that of most statistical analysis applications this learning approach can be categorized as either being a supervised or unsupervised learning processes. During supervised learning, the program can learn to classify a given set of labeled examples by the user who is teaching the program. Alternatively,
unsupervised learning requires the program to build representations from the data without feedback from the user. Most unsupervised learning techniques used for NER are not completely unsupervised [29], however. Various approaches to statistical learning for NER include Hidden Markov Models, Decision Trees, Conditional Random Field (CRF), and Maximum Entropy models.
2.6.3 Dictionary Based Approach
Drug name recognition (DNR) is the designation given to the text mining method which seeks to recognize the mention of various drugs (title and by component) in
unstructured medical texts. DNR is an NER task which seeks to classify these names into pre-defined categories [30]. An issue that biomedical researchers face is that drug names and designations in biomedical research vary widely among different authors and
publications. This, coupled with the fact that there are no set rules for how drug names must be entered and the potential of typographical errors, presents many challenges for simple queries and the reliance on well-known medical dictionaries for name matching. To combat these issues, researchers have implemented numerous supervised machine learning approaches, retrieving benchmark training data sets from various sources such as medical case reports such as ADE [31] and CHEMDNER [32].
19
A study by Liu et al. [30] provides an overview of the DNR system process and methods used amongst the biomedical research community. As one could expect, different researchers approach this problem in many different manners, establishing unique procedures for each method. Figure 3 illustrates a typical approach to the DNR system.
20
Here, the preprocessing step refers to the transformation of the original input texts into representations that enrich them with lexical and syntactic information. Many of these enrichments have been identified in earlier sections of this research.
The Dictionary Approach, listed under the DNR Approach category will be the focus here. Hettne et al. [33] speaks to the usefulness of the dictionary approach and its dependence on how well the terms are suited for natural language processing. Biomedical research application of the dictionary approach have involved the creation of combined dictionaries [34] as well as the use of online databases of chemical compounds [35]. Many of the techniques used in the application of dictionary approaches for NER rely on semi-supervised and supervised means of statistical classification to identify and
categorize entities and events. One of the major difficulties with this method is found in the base creation of the dictionary itself. Hettne et al. [33] identified some key issues involving the quality of some of the dictionary structure representations including the mis-association of chemical names with chemical entities and the overall assertation of what is to be considered a correct chemical structure and who asserts that it maintains that specific representation. The determination of how a compound is represented is based on the collective efforts of the company registering the compound, the patent, and the association of the compound amongst various databases. This system of
determination must be taken into account when considering the validity of a compound’s insertion into a dictionary as it will be an essential component to the results of the classification algorithm. To combat these issues, a curation platform was established in
21
which chemists could participate in the validation of many relationships within a dictionary.
2.7 Corpus Exploration
The concept of quickly exploring large document collections to discover useful and insightful information has been an exciting notion among researchers. One of the challenges with this area of texting mining is there is no definitive answer to how to perform this level of analysis. Eisenstein et al. [36] proposed TopicViz, an interactive environment that utilizes topic modeling in concert with various visualization techniques to identify latent themes found throughout large collections of documents. Lagus et al. [37] presented another method denoted as WEBSOM, an unsupervised method for the automatic organization of full-text document collections which utilizes the
self-organizing map (SOM) algorithm. This method was found to be especially useful for exploration tasks in which the user only had a limited view of the contents contained within the corpus. Using this method, the algorithm would order the documents in some meaningful pattern based on their content. These results would then be presented to the user in the form of a document map in which the user could explore the overall view of what the document space looked like. While these methods both present forms of exploration into a large corpus of documentation, each primarily focuses efforts on the grouping of similar documents based either on latent topics or similarly related subject matters of documents. This does not satisfy exploration and visualization of the purely the content of a corpus however.
22
As a more in depth approach to the exploration of large corpuses of
documentation, Ignat et al. [38] developed an automatic text analysis software which separates documents into clusters and extracts information such as a list of keywords, geographical locations mentioned, names of individuals and organizations and a list of user specified terms located within each cluster. The described system identifies
keywords and names found within the text and provides linkages the exact phrases in which these terms are mentioned as well as to external websites to provide additional information. While the tool developed here presents users with an abundance of insight into the data through combination of IR and IE techniques, it does not detect linkages between terms found in the text. The research presented here provided a sound launch point for this study to utilize in its development.
2.8 Word Relationships
This section introduces key concepts in the form of extended definitions, focused on developing relationships between linguistic units. The information presented here is based heavily on the research and documentation presented by Manning and Schutze [39]. They describe statistical inference as the concept of taking data, that has some unknown probability distribution, and making inferences on its distribution. As an example, through the examination of a training set of data, a researcher may seek to statistically infer, or predict, the next phrase given of a sentence of an equivocal class. To perform this type of prediction effectively, it is necessary to group words based on their histories. Using the Markov assumption is one possible way of doing this. This concept essentially looks at the last few words and determines how they affect the next word to
23
follow. To do this n - 1 words are placed together creating an (n-1)thorder Markov
model, also known as an n-gram model. Provided enough training data, researchers may derive a good probability estimate with
𝑝(𝑤𝑛|𝑤1, … , 𝑤𝑛−1) = 𝑝 (𝑤1,…,𝑤𝑛)
𝑝 (𝑤1,…,𝑤𝑛−1).
This is one method of uncovering relationship between different n-grams found in text. A secondary method would be in the analysis of the relationships between common words that exist within the same document within the corpus. These relationships can be discovered through correlation analysis. Here, the focus is to determine how often words appear together, within the same document, relative to how often they appear on their own. To implement this formulation, this research focuses on the phi coefficient which strongly relates to the Pearson correlation coefficient. This correlation coefficient measures the strength and direction of linear association between two variables [40], or words for the purposes of this research. The specific method of correlation used in this research will be discussed more thoroughly in the following sections.
2.9 Summary
This chapter presented some of the highlights of the previous works related to text mining techniques. The chapter opened with a definition of data mining, the challenges that unstructured data poses to data mining, and how text data mining can alleviate those issues. The focus then shifted to illustrate how text mining applications are being used in both the medical field and private sector. Following this, discussion moved to discuss
24
various methods of discovering insightful information and making connections with the application of text mining. The chapter concluded introducing two concepts for
25
III. Methodology
3.1 Chapter Overview
The purpose of this chapter is to provide an introduction into the various text mining techniques applied to the methodology developed during this thesis research. Discussion begins with the explanation of how users of this package can navigate their exploratory analysis. Then the discussion focuses on the concepts underlying n-gram development and analysis. Next is a discussion of term frequency analysis, the measure of how frequently terms occur in documentation, followed by a discussion of term correlation analysis, a statistical technique used to expose relationships between terms in the same document. Following this is a brief overview on the application of topic
modeling to a corpus of documents. This chapter ends with a discussion focused on the graphical tools used to visualize the results of the aforementioned text mining techniques.
3.2 Corpus Exploration Method
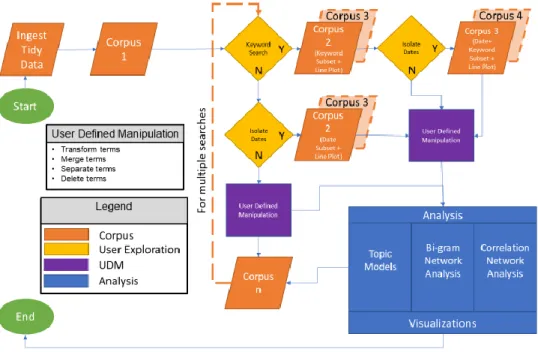
The purpose of this section is to introduce the methodological flow of analysis this research seeks to develop. Figure 4, is a visual representation of the application of these various methodologies in sequence. This flow chart serves to outline the possible directions an analyst may take when conducting their analysis.
26
Figure 4. Flow of Analysis
The program is initialized with the ingestion of data. To correctly implement this software package, data is required to be in a data frame format with, at minimum,
variables identified for the Date, Text Body, and Article Identification. This package utilizes “tidy data” techniques [41] for all data structures. Once tidied, data will enter first into the “User Exploration” phase where, as the name suggests, the analyst will be provided the functionality to explore the dataset to obtain any preliminary insight that is to be gained. Following this, the user will transition into the “User Defined
Manipulation” phase where, applying their subject matter expertise, they have the ability to transform, merge, separate, and delete terms found throughout the exploration phase. Once the user has successfully manipulated the dataset, the package can move into the “User Analysis” phase in which they can use text mining techniques such as bi-gram
27
network analysis, correlation network analysis, and topic models to visualize the results of their analysis and make inferences into the dataset.
3.3 Text Mining Techniques
This section will discuss the various text mining techniques utilized through this research. It begins with a discussion of the bag-of-words methodology and its relation to n-gram analysis. Discussion continues with definitions of temporal document and term frequency, and correlation analysis. This section concludes with an explanation of the topic modeling method used and visualizations of the results.
3.3.1 Bag-of-Words
Text documents are considered unstructured as compared to the highly structured fields of numerical data. In this form, it is difficult to analyze the content of textual documents, and even more so to mine them for valuable insight. To lessen this difficulty one of the most widely used approaches to text mining is the concept of representing text within a document as a “bag-of-words”. Before explaining how this concept is used in text mining it is first necessary to provide an explanation of vector space representation. This concept takes a word and defines it as a value of numerical importance [11]. This
model represents each document d as vector in m-dimensional space with each described
by a numerical feature vector 𝑤(𝑑) = (𝑥(𝑑, 𝑡1), … , 𝑥(𝑑, 𝑡𝑚)). This vectorization allows
documents to be compared using various vector operations.
The bag-of-words concept seeks to be a method of extracting features from documents by examining text in documentation as unique numerical values and
28
measuring the frequency of those words throughout the document[42]. Here, each word count is considered a feature.
3.3.2 Preprocessing
Prior to each analysis performed throughout this research, it is necessary to perform data preprocessing on all text within the corpus. Initially, upon ingestion, documents maintain their original structure which includes all words founds in the text, punctuations, capitalized letters, and full and correct spellings of each term. The method of preprocessing this data for analysis purposes include applying computational
procedures such as the removal of stop words, transforming all text to its lower-case form, and the removal of all punctuation and white space to all for effective tokenization of each term. This research elected not to use a stemming algorithm throughout the preprocessing. Traditionally, stemming seeks to remove the ends of words in an effort to reduce words to a base form, but this application is often performed in a crude manner procedure [12]. It was elected to omit stemming from data cleansing processes to not skew the results of the analysis.
3.3.3 N-grams
N-gram analysis [43] focuses on identifying a contiguous sequence of n terms in a
given sequence of text. To identify contiguous sequences, it is necessary to tokenize the textual content of the documents within a corpus. Tokenization [44] is the process of segmenting the linear sequences of text into smaller linguistic units. These units may consist of segments such as punctuations, word(s), sentences and paragraphs to name a
29
is equal to 1, this is designated as a unigram. When n is equal to any value greater than 1
it denotes how often wordX is followed by wordY and beyond. Table 1 illustrates the
n-gram relationship and how n is used. N-gram analysis seeks to provide a level of
enhanced insight into a corpus’ content.
Table 1. N-gram Example
N-gram (n) Token
unigram 1 “trump”
bi-gram 2 “donald trump”
tri-gram 3 “president donald trump”
four-gram 4 “u.s. president donald trump”
3.3.4 Term Frequency Analysis
Term frequency (tf) is a measure of how frequently a term occurs in a document. Every document within a corpus should be considered a unique instance in which it is possible that a term can appear many more times in some than others. For use in this project, this calculation is simply a count.
For a more formal description of the term frequency algorithm, let D be the set of
documents and 𝑇 = {𝑡1, … , 𝑡𝑚} be the different terms occurring in D, then the absolute
frequency of 𝑡 ∈ 𝑇 in document 𝑑 ∈ 𝐷 is given by tf(d, t). When applied to a subset of
terms, the term frequency can be written as 𝑡𝑓(𝑑, 𝑇′) ≔ ∑ 𝑡𝑓(𝑑, 𝑡)
𝑡∈ 𝑇 .
Applying term frequency, the analyst focuses on the most frequent terms that appear throughout the corpus. The most frequent terms will provide some indicatio n of
30
the main topics of discussion throughout the text. Term frequency is used in concert with n-grams at both the document and term level to provide values for some of the plots used throughout this research.
3.3.5 Term Correlation Analysis
Term correlation analysis seeks to expose the relationships between terms that are found in the same document, but may not co-occur such as with n-grams [45]. To
accomplish this, pairwise correlation is used to indicate how often terms appear together relative to how often they appear independently. Generating these correlation values, the pairwise correlation relies on the calculation of the phi coefficient [33],
𝜙 = 𝑛11𝑛00− 𝑛10𝑛01 √〖 (𝑛1∙)(𝑛〗0∙)(𝑛∙0)(𝑛∙1)
where n11 is the case where both words appear, n00 is the case where neither word
appears, and n01 and n10 are cases where either word appears. Table 2 illustrates the how
the term adjacency matrix is generated to populate these values.
Table 2: Term Adjacency Matrix Example
If most of the values between two terms falls on the main diagonal, then a positive correlation is indicated.
y = 1 y = 0 total x = 1 𝑛11 𝑛10 𝑛1∙
x = 0 𝑛01 𝑛00 𝑛0∙
31 3.3.6 Topic Modeling
Topic modeling is a very widely used unsupervised classification method for documentation. For this research, the Latent Dirichlet Allocation (LDA) [47] method of topic modeling was used. The main concept of LDA is that within a corpus, latent (natural) topics are present among the documents with each word in each document contributing to a specific topic. LDA treats each document as a mixture of topics, with each topic as a mixture of words [45]. The purpose of this analytical approach is to discover hidden topics that pervade the corpus. Following this discovery, each document will be tagged with its respective topic, organized, explored, and then the content of these hidden topics will be summarized. The two assumptions made during this analysis are that (1) each document exhibits each topic in different proportions and (2) each word in each document is drawn from one of the topics [48]. As a simple explanation of the
complex math used in LDA, imagine that for each of the possible number of topics (k),
the algorithm will multiply the frequency of the term found in the topic by the number of other terms found in the document already belonging to that topic. This explanation is expressed by,
𝑃(𝑍|𝑊, 𝐷) =(# 𝑜𝑓 𝑤𝑜𝑟𝑑 𝑊 𝑖𝑛 𝑡𝑜𝑝𝑖𝑐 𝑍)+ 𝛽𝑤
(𝑡𝑜𝑡𝑎𝑙 𝑡𝑜𝑘𝑒𝑛𝑠 𝑖𝑛 𝑍)+𝛽 ∗ (# 𝑤𝑜𝑟𝑑𝑠 𝑖𝑛 𝐷 𝑡ℎ𝑎𝑡 𝑏𝑒𝑙𝑜𝑛𝑔 𝑡𝑜 𝑍 + 𝛼),
where Z represents possible topics within each document, W represents each word in a
document, D represents each document, and α and β are user defined hyperparameters.
When using LDA, the appropriate determination of the number of topics is one of the more crucial elements involved in the accuracy of the algorithm. When the parameter
32
k is to small the potential for loss information pervades the analysis. Conversely, when k
is to large LDA cannot capture all correlations while also inferring the documents
posterior distribution over topics leading to an inaccurate representation of the data [49].
To determine the appropriate number of topics (k), this research utilizes the ldatuning
package [50], which realizes four metrics in its selection of the appropriate number of topics for LDA modeling. The following is a summarization of each of the methodologies utilized in the determination of the appropriate number of topics used in LDA, a sample of the visualization of expected results, and a discussion on how an analyst utilizing this tool can interpret the results.
3.3.6.1 Cosine Distance Minimization Method
Cao, Xia, Li, Zhang, and Tang [49] present an approach to the determination of the appropriate number of topics by adaptively selecting the best LDA model based on
topic density. In this approach they determine that the best k is correlated with the
distances between topics. The cosine distance is used to measure the correlation between topics with 𝑐𝑜𝑟𝑟𝑒(𝑇𝑖, 𝑇𝑗) = ∑𝑉𝑣=0𝑇𝑖𝑣,𝑇𝑗𝑣 √∑𝑉𝑣=0(𝑇𝑖𝑣)2√∑ (𝑇𝑗𝑣) 2 𝑉 𝑣=0 .
The smaller the 𝑐𝑜𝑟𝑟𝑒(𝑇𝑖, 𝑇𝑗) the more independent the topics, therefore establishing this
as a minimization metric. The output of the cosine measure is then used in the calculation of the average cosine distance between every pair of topics. Using this method, Cao et al.
were able to establish a correlation between the best k and the distances between topics.
33
number of topics within this radius. The kthtopic with the smallest topic density is then
deemed the optimal k.
3.3.6.2 KL-Divergence Minimization Method
As a secondary approach to a minimization metric, Arun, Suresh, Madhavan, and Murty [51] propose a measure to correctly identify the number of topics in a corpus through the use of the Symmetric Kullback-Leibler (KL) divergence. This research focuses on the notion that LDA’s probabilistic generative model can be viewed as a non-negative matrix factorization method. Assessing the concept of data in this way allows
for the separation of a Document-Word Frequency Matrix M into a Topic-Word Matrix
M1 and a Document-Term Matrix M2 where the values between the two matrices are
identical. Before presenting the divergence model, Arun et al. proceeds to explain how the concepts of Singular Value Decomposition (SVD) and topic splitting are incorporated into the theory of their model. They introduce the theory of the Symmetric KL
divergence explaining that if given a random Topic-Word Matrix R, the vector
representing the distribution of row L1norms, Rl1, and the vector representing the
distribution of L2 norms, Rl2, will be very similar component-wise when the number of
words W in a corpus is large enough. As W becomes large enough the Symmetric
KL-divergence will go towards zero. With this proposition they presented,
34
where CM1 is the distribution of singular values of Topic-Word matrix M1, and CM2 is the
distribution obtained by normalizing the vector L*M2, (where L is 1*D vector of lengths of each document in the corpus and M2 is the Document-Topic matrix).
With this measure, these researchers support that the appropriate number of topics will have the lowest calculated measure.
3.3.6.3 Information Divergence Maximization Method
Deveaud, Sanjuan, and Bellot [52] build upon the methodologies of Cao et al. and Arun et al. In the review of the works of these researchers, Deveaud et al. acknowledges the differences in their approaches, but note the similarities in the calculation of the distance metrics between topics over several instances of the model, all varying in the number of topics. They propose a method, a simple heuristic, which seeks to estimate the
number of latent topics in a corpus by maximizing the information divergence D between
all pairs of potential LDA topics (ki, kj). 𝐾̂ represents the number of topics determined by
this heuristic and represented by,
𝐾̂ = 𝑎𝑟𝑔𝑚𝑎𝑥 𝐾 1 𝐾 (𝐾−1) ∑ 𝐷(𝑘||𝑘 ′) (𝑘,𝑘′)∈𝕋𝐾 ,
where K is the number of topics given as a parameter to LDA, 𝕋K is the set of K topics
modeled by LDA, and D is the Jensen-Shannon divergence.
The method presented here uses the Jensen-Shannon divergence, stating that it is a symmetrized version of the KL divergence. The outcome of this method estimates the
35
3.3.6.4 Markov Chain Monte Carlo Maximization Method
Griffiths and Steyvers present a unique method also focused on the concept of a maximization model. The researchers seek to obtain estimates for the topic’s multinomial
distributions over the words W, 𝜙, and the set of document’s multinomial distributions
over the topics, 𝜃, by considering the posterior distribution over the assignments of words
to topics, 𝑃(𝒛|𝒘), where 𝒛 is the vector of latent variables indicating the topics.
Considering this distribution, the researchers found they were able to find estimates for 𝜙
and 𝜃. To evaluate 𝑃(𝒛|𝒘), among other mathematical components necessary for this
model, but beyond the scope of this thesis research, Griffith et al. also implemented the use of a Markov chain Monte Carlo procedure for their algorithm to converge to a target distribution. The Markov chain portion of this procedure called for the use of Gibbs sampling [53] as an indicator of when the next state would be reached. The Markov model portion of the algorithm leads to the development of a conditional distribution. The information developed here would then be used to determine the initial state of the
Markov chain. At this point the chains are run over multiple iterations. After enough iterations the chain would begin to approach at target distribution which maximizes
𝑃(𝒛|𝒘).
3.3.7 Network Graph Visualizations
Data visualization [54] is the science of visually representing data, either
categorical or quantitative, that has been abstracted in some form for units of information. Network theory is the study of graph visualizations representing complex systems of relationships between discrete objects. These graphs are typically represented by nodes,
36
which represent entities, and edges, which represent the interactions between these entities. For the purpose of networks towards the application of this thesis, focus is concentrated on undirected graphs and networks, Figure 5 [55].
Figure 5. Undirected Network Graph Example [55]
Here nodes are represented by each individual term found within the documents in the corpus. Edges are represented by some value metric such as count or correlation.
37
IV. Results and Analysis
4.1 Chapter Overview
This chapter presents the application of the text mining and graphical techniques described in Chapter III to a large corpus of news articles in the form of case studies. The chapter begins with a detailed discussion of the data generation process. Following this, the focus shifts to a thorough investigation of the overall dataset. The remainder of the chapter is dedicated to the examination of the overall dataset using two case studies. The chapter concludes with the validation of the inferential results using unbiased, nationally recognized, and expert sources.
4.2 Data Generation
Data generation was executed in three distinct stages. Stage 1 involved the selection of eight viable news sources to be used throughout this study. Stage 2 involved a mass URL retrieval of the selected news sources from the Global Database of Events, Language and Tone (GDELT) Project API. Stage 3 involved the creation and application of web-crawling algorithms to extract specific data from each URL retrieved from the GDELT Project API to be compiled into a robust data frame.
38 4.2.1 Stage 1: News Source Selection
As stated previously, the purpose of this research is to develop a methodology to allow users to sift efficiently and effectively through a corpus of textual data to glean insightful information. With this purpose in mind, it was imperative that the data sources be of an accurate, reliable, and reputable nature. For the algorithmic convenience of web scraping, news sources were also selected based on the consistency of the webpage
structure between articles. Table 3 identifies the eight, well-known and well-trusted, news agencies selected for this study.
Table 3. Summary of News Sources
Reuters BBC CNN Fox News CBS News USA Today Washington Post New York Times
4.2.2 Stage 2: GDELT API 2.0
Data generation for this research utilized the GDELT GEO 2.0 API which debuted on April 26, 2017. Through many iterations, this API has become a robust engine that allows users to explore world events through a host of insightful
visualizations. While this API maintains many advanced features, this research simply accessed the API for the generation of a list of URLs from the eight specific news sources identified above. The API was used to generate a collection of URL links, dates, and titles of online news articles of user specified news sources. The API was not without its limitations in use however. The API limited the user’s data request to a maximum of 85 days from the date of use. For example, if a user initiated a pull request on July 17, 2017 the first date the API would retrieve would be on 18 April 2017. Additionally, each
![Figure 1. Example of Entity Extraction Pipeline Architecture [22]](https://thumb-us.123doks.com/thumbv2/123dok_us/9897054.2483246/29.918.208.824.110.524/figure-example-entity-extraction-pipeline-architecture.webp)
![Figure 3. Typical Procedure of a DNR System [30]](https://thumb-us.123doks.com/thumbv2/123dok_us/9897054.2483246/33.918.212.673.331.918/figure-typical-procedure-dnr.webp)
![Figure 5. Undirected Network Graph Example [55]](https://thumb-us.123doks.com/thumbv2/123dok_us/9897054.2483246/50.918.275.657.303.544/figure-undirected-network-graph-example.webp)