High-risk
rural roads guide
This document provides guidance on the government’s Safer Journeys 2020
Strategy initiative to focus efforts on high-risk rural roads.
High-risk
rural roads guide
September 2011
NZ Transport Agency Published September 2011 ISSN 978-0-478-38039-2 (print) ISSN 978-0-478-38038-5 (online)Copyright: September 2011 NZ Transport Agency
National Office 50 Victoria Street Private Bag 6995 Wellington 6141 New Zealand T 64 4 894 5400 F 64 4 894 6100
Foreword
Crashes on rural roads are a serious issue in New Zealand. The
social and economic costs are high. The government’s road safety
strategy Safer Journeys signals that more must be done to improve
safety on our high-risk rural roads. Crashes on rural open roads
(state highways and local roads with speed limits of 80km/h or
more) accounted for 53% of New Zealand’s fatal and serious road
crashes for the five-year period to 2009.
The vision of Safer Journeys is
‘a safe road system increasingly free of death and serious
injury’.
The strategy gives us a road map for focusing our efforts where the greatest gains
can be made. Roads and roadsides are an area of great concern, and high-risk rural roads
are identified as requiring early action under the strategy.
Safer Journeys introduces the Safe System approach, which represents a fundamental
shift in the way we think about, and act on, road safety. Human beings make mistakes
and crashes are inevitable, but in a safe system they are less likely to result in death and
serious injury.
This
High-risk rural roads guide
is a flagship Safer Journeys initiative. It is a practical guide
to making our roads safer, intended for use by all road controlling authorities that manage
high-risk rural roads.
The guide introduces a new way to identify high-risk road sections and, using the Safe
System approach, provides best practice guidance on choosing effective
countermeasures.
Our traditional approach to road safety has helped achieve our current good levels of
road safety. We now need to add to this mix the Safe System approach, where road
designers and users share responsibility for a system to protect road users from death
and serious injury.
A draft guide was issued in May. Many supportive comments and helpful suggestions
were received and have been incorporated into the release of this guide. We see the
guide as a living document so it’s important that we keep it up-to-date. We are only
beginning our journey to understand what safe system thinking means for the future of
New Zealand roads. As new countermeasures are developed and trialled, and we gain
more experience with the use of the guide and the Safe System approach, we intend to
revise the guide.
If you are involved in managing a rural road network, I encourage you to consider how
applying the
High-risk rural roads guide
can change for the better what you do. Your
experiences and suggestions will be most welcome.
Geoff Dangerfield Chief Executive NZ Transport Agency
Contents
1 Introduction and objectives
7
1.1 Purpose 7
1.2 Scope 7
1.3 Target audience 8
1.4 Risk management 8
1.5 Definitions 8
1.6 Structure of the document 9
2 Strategic context
10
2.1 Safer Journeys – Road Safety Strategy 2010 10
2.2 Safe System 10
2.2.1 Safe System principles 10
2.2.2 Human tolerance to physical force 11
2.2.3 Safe System cornerstones 12
2.3 Key Safer Journeys initiatives 13
2.3.1 Introduction 13
2.3.2 Safe Roads and Roadsides 13
2.3.3 Safe Speeds 14
2.4 Investment framework 15
2.5 Source material 15
3 Crash priorities
16
3.1 Crash severity on New Zealand’s rural road networks 16 3.2 Comparing state highway and local road networks 18
3.3 Key crash types 18
3.3.1 Run-off road crashes 21
3.3.2 Head-on crashes 22
3.3.3 Intersections 23
3.3.4 Vulnerable road users 24
4 Identifying high-risk rural roads
25
4.1 High-risk rural road definitions 25
4.2 Summary of process 25
4.3 Step 1: Process to calculate risk metrics 28
4.3.1 Risk metrics 28
4.3.2 Selection of risk metrics for individual RCAs 28
4.3.3 Collective and personal risk metrics calculations 29
4.3.4 Star rating and RPS risk metrics derivation 29
4.3.5 RISA calculation 30
4.4 Step 2: Process to determine a high-risk rural road using risk metrics 30
4.4.1 Using crash data 30
4.4.2 Using the Road Asset Maintenance Management database (RAMM) 32
4.4.3 Road Infrastructure Safety Assessment (RISA) 32
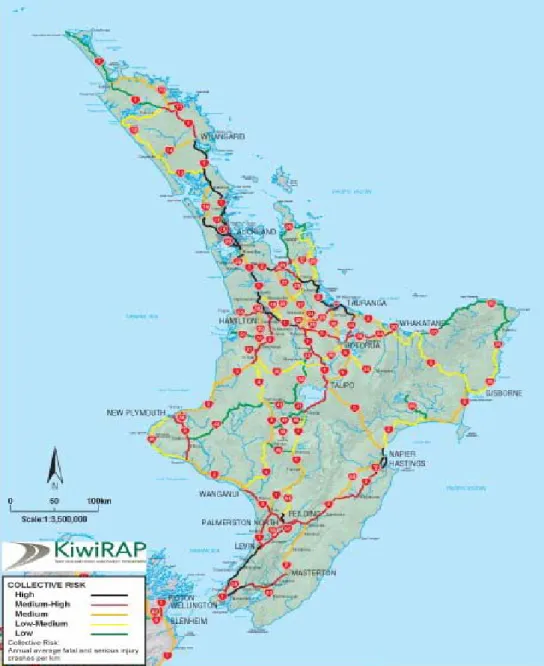
4.4.4 Published KiwiRAP collective and personal crash risk maps 32 4.4.5 Published KiwiRAP star ratings and RPS (state highways) 38
4.5 Treatment of high-risk rural roads 41
4.5.1 Process 41
4.5.2 Safety Improvement Strategy 41
4.6 Performance and safety improvement potential of high-risk rural roads 43
5 Understanding the issues
44
5.1 Analysing the data 44
5.2 Detailed crash analysis 44
5.2.1 Environmental factors 45
5.2.2 Vulnerable road users 46
5.3 Unsealed roads 47
6 Countermeasures
48
6.1 Section layout 48
6.1.1 Crash types 48
6.2 Treatment philosophy strategy 49
6.2.1 Safe System transformation treatments 49
6.2.2 Safer Corridor improvements 50
6.2.3 Safety Management treatments 53
6.2.4 Safety Maintenance treatments 54
6.2.5 Treatments based on key crash types (themes) 55
6.3 Road safety action plans 57
7 Programme implementation, monitoring and
evaluation 58
7.1 Introduction 58
7.2 Programme development 59
7.2.1 Programme prioritisation – focus on infrastructure
transformation countermeasures 60
7.2.2 Challenges to implementation 60
7.2.3 Programme implementation 60
7.2.4 Focus on incremental improvements across network 60
7.2.5 Consistency and road classification 61
7.2.6 Driver awareness measures/self-explaining roads 61
7.2.7 Communication and consultation 61
7.3 Monitoring and evaluation 62
7.3.1 Monitoring 62
7.3.2 Evaluation 62
7.3.3 Monitoring and evaluation performance measures 67
7.3.4 Responsibilities for monitoring and evaluation 68
8 Other information sources/references 69
8.1 Other information 69
8.1.1 iRAP Road Safety Toolkit 69
8.1.2 Austroads Road Safety Engineering Toolkit 69
8.1.3 KiwiRAP Assessment Tool (KAT) 69
8.1.4 Road Infrastructure Safety Assessment (RISA) 69
8.1.5 Rune Elvik – Handbook of Road Safety Measures 69
8.1.6 PIARC Countermeasures 70
8.1.7 USA AASHTO Highway Safety Manual (HSM) 70
Appendix A : RAMM SQL for calculating personal and collective risk 80
Appendix B : Allocation of road networks to climate zones 84
Appendix C: Using Personal reported vs predictive risk correlation charts 87
Appendix D: Countermeasures – infrastructure measures 90
Appendix E: Countermeasures – Safer Corridors measures 101
Appendix F: Countermeasures – safety management measures 121
Glossary of terms
3 Es
engineering, education and enforcement
AADT
annual average daily traffic
ATP markings
audio-tactile profiled markings
Austroads
National Association of Australian Road Authorities
CAS
Ministry of Transport’s Crash Analysis System
CMS
changeable message sign
EMP
edge marker post
gTKP
global transport knowledge partnership
Harm minimisation
speed
posted speed limit targets that are based on impact speeds at which the chance
of a fatal outcome increase rapidly
Harm reduction speed
a posted speed limit based on using a balance between the current speed limit
and a harm minimisation speed
high-severity crashes
fatal and serious crashes
HRRR
high-risk rural roads
IL
investigation levels for skid resistance
iRAP
International Road Assessment Programme
KAT
KiwiRAP assessment tool
KiwiRAP
The New Zealand joint agency Road Assessment Programme
LoS
level of service
MoT
Ministry of Transport
NMA
Network Maintenance Area
NSC
Network Safety Coordination
NZTA
NZ Transport Agency
OECD
Organisation for Economic Co-operation and Development
PIARC
World Road Association
RCA
road controlling authority
RISA
Road Infrastructure Safety Assessment
RoNS
road of national significance
RPS
road protection score
RRPM
retro-reflective raised pavement marker
SAWS
speed-activated warning signs
SCRIM
Sideway-force Coefficient Routine Investigation Machine
SHGDM
State highway geometric design manual
speed zone
a posted speed limit based on the driver’s 85th percentile operating speed
SWOV
Dutch national road safety research institute
TERNZ
Transport Engineering Research New Zealand
the guide
the
High-risk rural roads guide
TCR
Traffic Crash Reports (completed by the Police and coded by the NZTA)
1 Introduction and objectives
1.1
Purpose
The High-risk rural roads guide (HRRRG or ‘the guide’) has been prepared by the NZ Transport Agency (NZTA) to provide guidance on the government’s Safer Journeys 2020 Strategy initiative to focus efforts on high-risk rural roads.
The objective of the guide is to provide practitioners with best practice guidance to identify, target and address key road safety issues on high-risk rural roads. The guide provides links to a number of road safety resources and guidance for planning, funding and evaluating safety projects and programmes.
The guide focuses on the Safer Journeys actions. However, roads that have crash problems but do not meet the criteria for a high-risk rural road may still warrant investigation and the use of suggested countermeasures but may not be prioritised in terms of funding.
Specifically, the guide is intended to provide:
• details of a Safe System approach to Safe Roads and Roadsides and to a lesser degree Safe Speeds in New Zealand (two of the four key components of a Safe System)
• a discussion of key crash issues on New Zealand rural roads
• tools to help identify and analyse high-risk rural roads
• a range of countermeasures for key crash types occurring in rural environments, to help develop best-value remedial treatments
• guidance for developing, prioritising and funding road safety infrastructure and speed management programmes
• references to further tools and resources to evaluate implemented countermeasures.
The guide has also been developed to provide national consistency regarding the identification of high-risk rural roads and the application of proven countermeasures.
The guide provides a mechanism for road controlling authorities (RCAs) to manage the safety of their road networks. Although there are many ways in which high-risk rural roads can be identified, regions will still need to identify and prioritise their own issues regardless of whether they conform to those identified in the guide. Guidance on funding is discussed in section 2.4.
In addition to this guide, for more detailed information and recommendations on both high-risk urban and high-risk rural intersections, refer to the High-risk intersection guide. For more detailed information on motorcyclist issues and treatments refer to the High-risk motorcycle guide.
1.2 Scope
The guide supports and references:
• the New Zealand Ministry of Transport’s (MoT) Safer Journeys 2020, New Zealand’s Road Safety Strategy 2010–2020 (March 2010)
• the Safer Journeys Implementation Action Plan 2011/12 (May 2011)
• the NZTA’s Road Safety Strategic Plan (updated in April 2011)
• New Zealand legislation and, in particular, the Land Transport Act 1998 and rules made pursuant to that act, including the Land Transport (Road User) Rule, the Land Transport Rule: Traffic Control Devices, and the Land Transport Rule: Setting of Speed Limits
• Austroads Guides (Guides to Traffic Management, Road Design, Road Safety) and other Austroads Technical Guides
• New Zealand and, as appropriate, Australian standards, codes of practice and guidelines
• published standards of various organisations and authorities.
The guide provides direction on measures to improve safety on high-risk rural roads. However, practitioners should always apply sound judgement when identifying and installing any
1.3 Target audience
The principles presented in the guide are relevant to rural roads in both the state highway network and the territorial local authority (TA) network. The HRRRG is intended to provide guidance to a range of technical practitioners, including:
• those from RCAs
• state highway and local roads engineers
• planners
• funders.
It may also be useful to other industry practitioners, developers and private landowners when they would like to identify road safety risks and develop appropriate risk-reducing measures.
1.4 Risk management
The objective of this guide is to reduce fatal and serious injuries on the New Zealand rural road network as defined by the Safer Journeys strategy. The term ‘high-risk rural road’ takes into account both consequence and likelihood of fatal and serious crashes occurring.
In defining a high-risk rural road this guide provides a mixture of information (refer section 4) ranging from providing actual locations of high-risk rural roads (through published KiwiRAP risk maps) and the methodology to assist RCAs in risk identification (such as those calculations and charts provided for local roads to determine high-risk routes etc).
It is important to note that communication and consultation is one of the most important components of risk management and should be considered at all stages of the process. For example in using the high-risk rural road definitions (which use actual and predicted risk) further risk identification may be through public feedback, Road Transport Associaton, high-volume road users, AA, emergency services etc. In using this feedback we should therefore also determine whether that level of perceived risk matches the actual or potential risk through the use of crash and road data. Once routes have been determined, further consultation can be undertaken with the community and road user groups on better understanding the risks, and the best methods of addressing these. This is explained further in sections 5 and 7.
The user of this guide should document the identification, analysis, treatment and monitoring process for high-risk rural roads. This is an important means of recording the right level of information for the decision maker and the person responsible for taking action.
Further information on risk management, communication and consultation and recording the risk management process can be sourced from AS/NZA ISO31000: 2009 Risk Management – Principles and Guidelines and chapters 3 and 9 of SAA/SNZ HB 436:2004 Risk Management Guidelines.
1.5 Definitions
In this guide:• a rural road is a motorway, state highway, expressway, local road or private road with a speed limit of 80km/h1 or more
• a high-risk rural road2 is classified as:
- a rural road where the fatal and serious crash rate (personal risk) or crash density (collective risk) is high or medium–high compared with other roads as defined in section 4 and/or - a rural road with a high or medium–high collective risk; or a high or medium–high personal
risk (as defined by KiwiRAP3) and/or
- a rural road that has engineering features that have the potential for fatal or serious injury crashes to occur as determined by the KiwiRAP star rating or road protection score (RPS), eg a road with 1 or 2 stars or an RPS greater than 10 (section 4) and/or
- a rural road that has a personal risk of greater than 2.5 identified as part of the Road Infrastructure Safety Assessment (RISA) process (section 4)
• any section of road to be classified as a high-risk rural road must have an actual crash record of 3 or more fatal and serious crashes over 5 years or 5 or more fatal and serious crashes over 10
1 Note that, for the purposes of the guide and any relevant crash analysis, the definition of a rural road is a road with a posted speed limit of 80km/h or more. However, in some documents, such as the New Zealand Traffic control devices manual, this has been defined as being 70km/h or more.[2]
2 A rural road identified as high-risk through this guide may not necessarily meet the requirements for a high strategic fit in the Investment and Revenue Strategy for funding purposes. Refer section 2.4 and 4.1.
3 KiwiRAP is New Zealand’s joint agency Road Assessment Programme. [3] The Ministry of Transport, the NZTA, Police, ACC and AA developed the programme
1.6 Structure of the document
The guide is divided into seven main sections :Section
2
Strategic context Outlines the varying strategies and priorities of the government. It includes descriptions and background information on the Safer Journeys strategy and the Safe System approach.Section
3
Crash priorities Discusses the focus on key crash types across all rural road networks. Section4
Identifying high-risk rural roads Describes the types of data and resources available to identify high-risk roads, includng resources that are crash data driven and those that involve a risk-based assessment. It includes guidance for preparing forward worksprogrammes, examples of high-risk rural roads and how this document and analysis fits in with Safety Management Systems (SMSs).
Section
5
Understanding the issues Describes what further analysis could be undertaken to better determine the safety problem and the most appropriate countermeasures.Section
6
Countermeasures Includes the treatment philosophy, summaries of countermeasures, examples of types of countermeasures, reference material, the implementation process and best practice across networks.Section
7
Programme implementation, monitoring and evaluationDescribes the processes involved with prioritising and programming works identified as part of the methodology. Provides advice on how best to monitor and evaluate completed countermeasures at high-risk sites and routes. Section
8
Other information sources Includes other sources of information that have been included in the development of this guide and provide additional guidance to RCAs in developing and treating high-risk rural roads. References throughout the document are provided in brackets [ref no.]2 Strategic context
2.1 Safer Journeys – Road Safety Strategy 2010
The New Zealand government released its Safer Journeys – Road Safety Strategy in March 2010. Safer Journeys is a national strategy to guide improvements in road safety over the period 2010– 2020. The strategy sets out a long-term vision for New Zealand of ‘a safe road system increasingly free of death and serious injury’.4
To support the vision, Safer Journeys introduces, for the first time in New Zealand, a Safe System approach to road safety (section 2.2).
Safer Journeys also lists a number of key initiatives that have been identified as having the greatest impact on road trauma. These initiatives will be implemented through a series of action plans relating to the four key components of a Safe System – Safe Roads and Roadsides, Safe Speeds, Safe Road Use and Safe Vehicles.
2.2 Safe System
2.2.1 Safe System principles
A Safe System approach to road safety represents a fundamental shift in the way New Zealanders think about road safety. It works on the principle that it is not acceptable for a road user to be killed or seriously injured if they are involved in a crash. The Safe System approach also acknowledges that road users are fallible and will continue to make mistakes.
Scandinavian research [4] indicates that, even if all road users complied with all road rules, fatalities would only fall by around 50% and serious crashes by 30%. Putting this in a New Zealand context, if everybody obeyed all the road rules, there would still be around 200 road deaths each year (based on current fatalities).
The traditional 3 Es approach to road safety – engineering, education and enforcement – has helped achieve our current good levels of road safety. These elements remain important, but the
traditional approach tends to blame and try to correct the road user. Continuing with this approach will not achieve the desired gains in road safety in New Zealand. A Safe System approach
recognises the need for system designers and road users to share responsibility, with the ultimate aim of protecting road users from death and serious injury.
The Safe System approach acknowledges these four principles:
Human beings make mistakes and crashes are inevitable
However, the current consequences of those mistakes and crashes should not be regarded as acceptable. A Safe System aims to reduce the likelihood of crashes with a focus on removing the potential for death or serious injury.
The human body has a limited ability to withstand crash forces
A Safe System aims to manage the magnitude of crash forces on the human body to remove the potential for death or serious injury (refer to figure 2-1).
System designers and road users must all share responsibility for managing crash forces to a level that does not result in death or serious injury
The aim of the system designer is to deliver a predictable (self-explaining) road environment to the road user that is also forgiving of mistakes. The Safe System relies on the principle of shared
responsibility between system designers and road users. System designers include planners, engineers, policy makers, educators, enforcement officers, vehicle importers, suppliers, utility providers, insurers, etc.
It will take a whole-of-system approach to implement the Safe System in New Zealand
Everyone plays a part in providing a safe transport system. Road designers will design safe roads and roadsides that will encourage safe behaviour and be forgiving of human error. Vehicle technology (safe vehicles) will vastly improve communication with the road environment to ensure appropriate speeds that respond to real time conditions (safe speeds). Road users need to understand and play
4 References noted by a number in brackets [..] can be found in section 8 ‘Other information sources’.
2.2.2 Human tolerance to physical force
The fundamental principle of a Safe System is the relationship between road users, vehicles, speeds and road infrastructure, and how much force the human body can withstand when each of these four elements interacts in the event of a crash. The OECD [5] states that ‘the human body’s tolerance to physical force is at the centre of the Safe System approach’. In addition, the Australian Road Safety Strategy (2011–2020) states that ‘the chances of surviving a crash decrease rapidly above certain impact speeds, depending on the nature of the collision’ [118]. This is illustrated in figure 2-1, which shows the threshold speeds above which the risk of death or serious disabling injury climbs rapidly for five key crash types.
The OECD (2008) recognises that safe speeds are paramount in achieving a Safe System. However, achieving safe operating speeds on rural roads throughout New Zealand will in some cases adversely affect transport efficiency. Other measures, such as providing median separation, would be needed to reduce crash severity where safe speed thresholds cannot be appropriately provided. The need to balance efficiency and safety often leads to compromises in the
management of speeds (a harm reduction philosophy as opposed to a more rigid harm minimisation philosophy–see appendix D, section D7).
FIGUre 2-1
Survivable impact speeds for different scenarios ([118 – figure 7])
2.2.3 Safe System cornerstones
Under a Safe System, designers create and operate a transport system where road users who are alert and compliant are protected from death and serious injury. The four key cornerstones of a Safe System are illustrated in figure 2-2 and include:
• safe roads and roadsides
• safe speeds
• safe vehicles
• safe road use.
FIGUre 2-2
The Safe System
UN DER STAN DIN G CR ASHE S AND RISKS
INNOVATION LEGISLATION AND ENF
ORCEM EN T A DM ISSIO N TO TH E SYS TEM E DUC ATION
AND INFORMATION LEADERSH IP AND CAPA BILITY SAFE ROA DS A ND RO ADSIDES SAFE V EHIC LES SA FE ROA D USE SAFE SP EE DS HUMAN TOLE RAN CE TO C RA SH FO RCES HUM AN TO LERA NCE T O CRA SH FOR CES HU M AN TO LERA NC E TO CRA SH FORCES HUMAN TOL ERAN CE TO CRA SH F ORC ES A SAFE ROAD SYSTEM INCREASINGLY FREE OF
DEATH AND SERIOUS INJURY
SAFE ROADS AND ROADSIDESare predictable and forgiving of
mistakes – their design should encourage appropriate road user behaviour and speeds
SAFE SPEEDS suit the function and level of safety of the road – road
users understand and comply with speed limits and drive to the conditions
SAFE VEHICLES help prevent crashes and protect road users from
crash forces that cause death and serious injury
SAFE ROAD USE ensures road users are skilled, competent, alert
and unimpaired, and people comply with road rules, choose safer vehicles, take steps to improve safety and demand safety improvements
When the driver of a vehicle travelling on a rural road in wet weather loses control on a bend, a crash into a solid roadside object such as a power pole is likely to result in death.
Under a Safe System, the road user has a much lower risk of death or serious injury because:
• vehicles will increasingly have advanced safety features, including electronic stability control (ESC), front and side airbags, and head restraints
• road surfaces will be improved and roadside objects removed or barriers installed
• speed is managed to safe levels through more appropriate speed limits, self-explaining roads that encourage safe speeds and devices such as Intelligent Speed Assist
• road users are alert and aware of the risks and drive to the
How is the Safe System approach different?
2.3 Key Safer Journeys initiatives
2.3.1 Introduction
The Safer Journeys strategy contains road safety initiatives across the four Safe System
cornerstones. This guide provides direction on how to implement a number of the key initiatives for Safe Roads and Roadsides and Safe Speeds (to a degree5). Specifically, the guide provides
information and guidance on the following action under the Safe Roads and Roadsides plan:
‘Focus safety improvement programmes on high-risk rural roads and high-risk urban intersections’
Guidance is also provided on a number of speed management initiatives presented under the Safe Speeds plan, including:
‘Create more speed zones on high-risk rural roads to help make roads more self explaining, and to establish criteria for what roads with different speed limits should look like’
Speed management is an important way to improve the safety of high-risk rural roads and is therefore included in the guide, alongside typical infrastructure improvement measures.
2.3.2 Safe Roads and Roadsides
‘Focus safety improvements on high-risk rural roads…’The greatest safety gains on high-risk rural roads are expected to be achieved by focusing on reducing fatal and serious outcomes on key crash types. This approach is also consistent with the Safer Journeys long-term vision:
‘A safe road system increasingly free of death and serious injury’
For instance, around 8 out of 10 fatal and serious crashes on the nation’s state highways occur on rural roads and, of those state highway crashes, 85–90% of fatal and serious crashes are due to one of three crash types:
• run-off road (on a curve or straight)
• head-on
• at intersections.
Detailed information on these crash types, for both state highways and local roads, is included in section 3.
The NZTA and local government need to ensure that road safety efforts focus on these key areas to help achieve Safe Roads and Roadsides.
5 Although only minimal information is provided on speed management a review of speed limit setting is currently being undertaken that will result in the development of a Speed limits guide
within the NZTA’s Traffic control devices manual.
2.3.3 Safe Speeds
Safe Speeds is closely linked to Safe Roads and Roadsides – especially for rural road and highway networks. The guide describes how Safe Speeds can be achieved to complement Safe Roads and Roadsides in order to improve safety for all road users. Appropriate speed management-related countermeasures are proposed that relate to all aspects of the Safe System, ie Safe Roads and Roadsides, Safe Road Use, Safe Speeds and Safe Vehicles.
When a driver exceeds the speed limit there is a large increase in the risk of a severe crash. Kloeden studied crashes in South Australia and showed that compared to travelling at the speed limit, the risk of a serious casualty crash doubles at just 5km/h above the limit on 60km/h urban roads or 10km/h above the limit on rural highways.
Figure 2-3 shows the effect of changes in the mean speeds of all vehicles in a rural traffic stream on the number of casualties. Changes in mean speeds have the most effect on the most severe casualties. Nilsson proposed the power relationships in 2004 and Elvik updated and refined them in 2010 using more recent data.
The default speed limit on New Zealand’s open/rural roads is 100km/h and it is generally applied to all rural roads with only limited exceptions at the present time. A more suitable speed limit for these roads might in future be one that more closely matches the design speed and the safety features present. The NZTA recognises that there is some merit in applying a safer operating speed limit or speed zone6 for roads on which the standard rural speed limit is inappropriate. This is
further described in appendix D, section D7.
Harm minimisation and harm reduction speeds are used in Safe Systems to reduce high-severity crashes. These are discussed in the countermeasures section in appendix D, section D7.
The Safer Journeys strategy refers to other speed management initiatives, such as speed cameras, lower speed limits in urban areas, self-explaining roads, GPS-based speed advice systems and road improvements to address speed-related crashes.
6 A speed zone takes into account the alignment of a route or section of road and operating speed of vehicles. This is in contrast to the current (as at 2011) method of setting speed limits, which is based primarily on the amount of frontage development.
FIGUre 2-3
relationship between change of mean speed and casualties on
rural roads
2.4 Investment framework
The Government Policy Statement on Land Transport Funding 2012 (GPS), covering the period 2012/13 to 2021/22, has a strong safety focus, with its three priorities being road safety, value for money and economic growth and productivity improvement. While no specific safety funding activity class has been created, there is an expectation that the level of safety investment is to be made transparent and the NZTA will be required to report on how it has been used to improve road safety. Safety expenditure includes the safety proportions of RoNS, safety improvements such as barriers and realignments, minor safety works, efforts on high-risk rural roads and high-risk intersections, motorcycle black routes, demonstration projects, road safety education and a safety component of maintenance and renewals.
The NZTA’s Investment and Revenue Strategy (IRS) gives effect to the GPS 2012. The Strategy has a focus on reductions in deaths and serious injuries and the adoption of a ‘safe systems’ approach in line with Safer Journeys. The ‘high strategic fit’ assessment of the Strategy includes the ‘potential to significantly reduce the number of crashes involving death and serious injuries in line with Safer Journeys on a high-risk rural road’. However at this stage for a ‘high strategic fit’ the IRS has a requirement to address actual crash records only. A predicted crash rate will be assigned a ‘medium strategic fit’. For more details on applying this criteria when developing programmes, refer to the NZTA’s Planning, programming and funding manual.
This investment focus combined with this guide is aimed at strongly encouraging RCAs to focus their efforts on the Safer Journeys priorities and actions,
2.5 Source material
The guide recognises the availability of several other high-risk rural roads guidance documents and web-based tools to apply relevant countermeasures. These are described in section 8.
3 Crash priorities
Prioritising safety improvement measures for high-risk rural roads requires a focus on reducing the number of fatal and serious casualties; this involves specifically focusing on the three key types of crashes on rural roads: head-on crashes, run-off-road crashes and intersection crashes (see figure 3-1). Details of crash severity, road type and key crash types within a New Zealand context are further described in this section.
FIGUre 3-1
Crash priorities
Safer Journeys 2020 road Safety Strategy
‘Focus safety improvement programmes on high-risk rural roads and high-risk intersections’
Priority crash types (targeting high-risk rural roads and high-risk intersections)
Head-on crashes run-off road crashes Intersection crashes
3.1 Crash severity on New Zealand’s rural road networks
Rural (open road) crashes6 accounted for 25% of all reported motor vehicle crashes on NewZealand roads over the five-year period 2005–2009. Approximately 30% of injury crashes on all rural roads are recorded as fatal or serious, which would contribute to a large portion of the social cost of crashes.
Fatal and serious injury crashes impose significant costs in terms of grief and suffering, as well as economic costs. It is for this reason that Safer Journeys and its Safe System approach focus on these high-severity crash types.
However, these high-severity crashes are typically highly dispersed. Nationwide, approximately 56% of fatal and serious crashes on local authority rural roads have occurred at locations where no other injury crash has been recorded in the past five years. That said, the proportions vary from TA to TA as does the actual number (see figure 3-2). Because of this there will be an increasing move to corridor or route treatments rather than focusing solely on crash clusters, thereby ensuring road users are provided with a consistent level of safety, appropriate to the route on which they are travelling.
If significant gains in road safety are to be made, priority should be given to addressing these routes and locations where high-severity crashes occur. This is the intention of the guide.
7 State highways and local roads combined – and with speed limits of 80km/h or more. Excludes motorways. Note that even though excluded from the overall data analysis in section 3 (because types of crashes occurring on motorways would skew results), motorways can still be included when defining a high-risk rural road.
FIGUre 3-2
The number of high-severity crashes (2005 to 2009 inclusive) by
TA and the proportion occurring in isolation, ie no other reported
injury crash with 250m radius
3.2 Comparing state highway and local road networks
As illustrated in figure 3-3, state highways comprise only 12% of the nation’s road network. However, they account for over half of all rural road fatal and serious injury crashes. Figure 3-4 shows that the crash density, and especially the density of fatalities (the numbers per unit of road length), is proportionally higher on state highways than on local roads. The amount of travel on state highways represents approximately half of all vehicle kilometres travelled. Therefore, in relation to travel activity, fatal and serious crash rates are higher for rural state highways than for rural local roads.3.3 Key crash types
Although all crash types are used when identifying high-risk routes, the guide focuses on the three most common crash types for fatal and serious crashes on rural roads – 88% of all high severity crash types8 occurring on New Zealand rural roads (excluding motorways) over the period
2005–2009 were: run-off road – lost control on curves9 and lost control on straights, head-on, and
at intersections which resulted in 90% of the total high severity casualties as outlined in table 3-1. Analysis also shows that pedestrians and cyclists for 3% of fatal and serious crashes on rural roads, with the remaining 11% comprising a variety of other crash types.
TAble 3-1
Key crash type percentage (all New Zealand rural roads excluding
motorways) 2005–2009
Key crash type % of high severity crashes on
New Zealand rural roads % of high severity casualties from key crash types of all high severity casualties
Run-off road 54% 50%
FIGUre 3-3
All rural roads (excluding
motorways): rural network length,
travel and severe crashes
FIGUre 3-4
Number of deaths and
serious injuries on rural state
highways and local roads (2005–
2009), excluding motorways
8 Key crash types are defined in the NZTA’s Economic evaluation manual.
9 For the purposes of this guide, it has been assumed that fatal and serious injuries due to loss of control on curves and straights equate to run-off-road on curves.
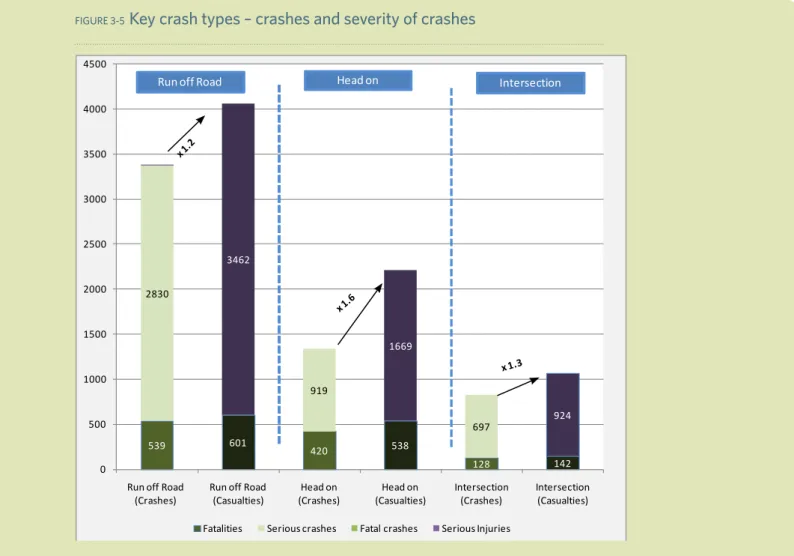
‘Run-off road’ crashes are the most common crash type in terms of both fatal and serious crashes and injuries (figure 3-5). However, when comparing fatalities across crash types, the number of fatalities in head-on crashes is of a similar magnitude to those in ‘run-off road’ crashes. In addition, there are more fatal and serious casualties for each head-on crash (1.6 times the number of fatal and serious crashes), due partly to more than one vehicle being involved. Furthermore, the ratio of severe injuries in intersection crashes is greater than in run-off road crashes.
For further information on the types of movement, codes are used for each key crash type (refer to figures 3-8, 3-9 and 3-10).
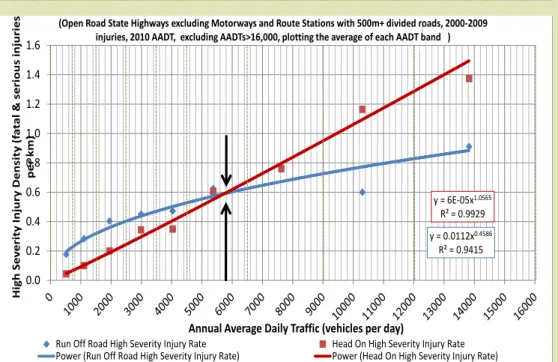
Figures 3-6 and 3-7 show the way the head-on severe injury density and rate vary with traffic volume. At above about 6000 vehicles per day, there are typically more people killed or seriously injured in head-on crashes than in run-off-road crashes. At low traffic volumes single vehicle crashes and casualties predominate because opposing traffic is infrequent. The risk of running off the road for each person reduces rapidly with increasing traffic. This is likely due to driver behaviour (such as excessive speed) being tamed by more traffic, but also to busier roads having higher safety standards. As roads get busier, head-on crashes and casualties increase in direct proportion to the amount of traffic, but the personal risk stays remarkably constant. Most head-on crashes result from loss of control so where a vehicle loses control and crosses the centreline, the outcome will only be a head-on crash if an opposing vehicle is present at the wrong time.
FIGUre 3-5
Key crash types – crashes and severity of crashes
539 601 420 538 128 142 2830 3462 919 1669 697 924 0 500 1000 1500 2000 2500 3000 3500 4000 4500
Run off Road (Crashes)
Run off Road (Casualties) Head on (Crashes) Head on (Casualties) Intersection (Crashes) Intersection (Casualties)
Fatalities Serious crashes Fatal crashes Serious Injuries
Note: In the above graphs the data is the average of crashes and casualties on straights and bends. The casualty rate is less on straights and higher on bends so the graphs should not be used to predict crash rates. Crash prediction tools discussed elsewhere in this guide take all geometric
FIGUre 3-7
run-off road and head-on high-severity injury rates
y = 301.75x-0.539 R² = 0.9555 y = -8E-09x2+ 0.0001x + 2.4237 R² = 0.3031 0 2 4 6 8 10 12 H ig h S ev e rit y In ju ry R at e ( fa tal & s e rio u s in ju rie s p e r 100M V K T)
Annual Average Daily Traffic (vehicles per day)
Run-off road and Head-on High Severity Injury Rates
(Open Road State Highways excluding Motorways and Route Stations with 500m+ divided roads, 2000-2009 injuries, 2010 AADT, excluding AADTs>16,000, plotting the average of each AADT band )
Run Off Road High Severity Injury Rate Head On High Severity Injury Rate Power (Run Off Road High Severity Injury Rate) Poly. (Head On High Severity Injury Rate) Source: NZTA
Note: Figure 3-7 is based on casualties and is therefore a personal casualty risk rate
FIGUre 3-6
run-off road and head-on injury density
y = 0.0112x0.4586 R² = 0.9415 y = 6E-05x1.0565 R² = 0.9929 0.0 0.2 0.4 0.6 0.8 1.0 1.2 1.4 1.6 H ig h S e ve rit y In ju ry De n sit y (f at al & s e rio u s in ju rie s p e r km)
Annual Average Daily Traffic (vehicles per day)
Run-off road and Head-on High Severity Injury Densities
(Open Road State Highways excluding Motorways and Route Stations with 500m+ divided roads, 2000-2009 injuries, 2010 AADT, excluding AADTs>16,000, plotting the average of each AADT band )
Run Off Road High Severity Injury Rate Head On High Severity Injury Rate Power (Run Off Road High Severity Injury Rate) Power (Head On High Severity Injury Rate) Source: NZTA
3.3.1 Run-off road crashes
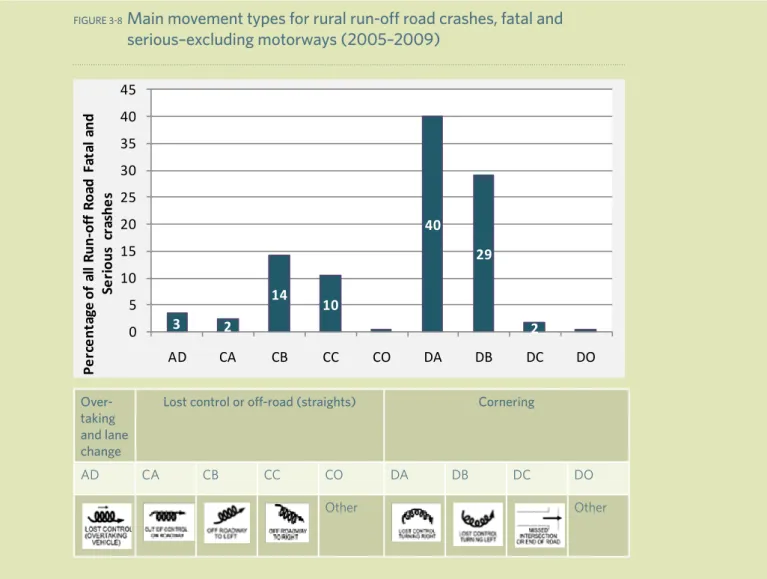
Loss of control (run-off road) crashes are the most common rural road crash type and account for 54% of fatal and serious crashes on all rural roads for the period 2005–2009. These types of crashes occur on both curves (69%) and straights (26%). The main type of movement is loss of control turning right, which represents 40% of all rural fatal and serious run-off road crashes (figure 3-9). The next most common movement types for run-off road crashes are lost control turning left (29%), lost control off-roadway to the left (14%) and lost control off-roadway to the right (10%), with the remainder equalling 7% of different crash movement types. Note that many vehicles initially leave the roadway to the left but while attempting to recover swerve across the road to the right.
KiwiRAP has specifically examined the level of road and shoulder width, road alignment, delineation on clear zones and barrier treatments on state highways, in order to rate the run-off road risks associated with those roads. In order to achieve a low risk rating (4 stars or greater), sufficient clear zones need to be provided, some form of barrier treatment, a good standard of alignment or an increase in shoulder width for recovery to address both the number and severity of run-off road crashes.
FIGUre 3-8
Main movement types for rural run-off road crashes, fatal and
serious–excluding motorways (2005–2009)
3
2
14
10
40
29
2
0
5
10
15
20
25
30
35
40
45
AD
CA
CB
CC
CO
DA
DB
DC
DO
Per
cen
ta
ge
of
a
ll R
un
-o
ff
R
oa
d
Fa
tal
an
d
Se
ri
ou
s c
ra
sh
es
Run off Road Movement Code
Over-taking and lane change
lost control or off-road (straights) Cornering
AD CA CB CC CO DA DB DC DO
3.3.2 Head-on crashes
Head-on crashes represent the second highest fatal and serious crash type (approximately 21%) on all rural roads. Most fatal and serious head-on crashes happen on curves, consisting of loss of control (BF) 33%, swung wide (BC) 19% and cut corner (BB) 12%. Head-on crashes on straight roads accounted for 26%, consisting of failing to keep left (BA) 16% and lost control (BE) 10%. Head-on crashes while overtaking (AB) were only 7%.
In order to rate the safety on rural state highways, KiwiRAP10 (discussed in section 4) takes into
account the risk of head-on crashes, based largely on the level of median protection provided as well as other related factors, such as traffic volume, roadway alignment and width. Because most head-on crashes result from a vehicle that loses control, all the factors that contribute to losing control also influence a head-on crash. To achieve a low risk rating (4 stars or greater), higher-volume roads will typically need physically divided carriageways with a central median barrier, thus reducing the potential for head-on crashes. Varying types of median-separation measures and their application to all rural roads are discussed further in section 6 and appendix E.
The NZTA intends to initially target the highest-risk rural roads Some of those roads will be addressed by the roads of national significance (RoNS). Some New Zealand roads carry 15,000– 20,000 vehicles per day but do not have median barriers. Installing median barriers11 on all
high-risk high-volume rural roads is estimated to save 8–10 lives per year and 102–119 injuries per year. [1]
FIGUre 3-9
Main movement types for rural head-on crashes, fatal and serious - excluding
motorways (2005–2009)
7 16 12 19 2 10 33 0.74682599 0 5 10 15 20 25 30 35 AB BA BB BC BD BE BF BO Pe rc en ta ge o f H ea d O n F at al a nd S er io us C ra sh esHead on Movement Code
Over-taking and lane change Head-on AB BA BB BC BD BE BF BO Other
10 KiwiRAP is New Zealand’s joint agency Road Assessment Programme.[3] The Ministry of Transport, the NZTA, Police, ACC and AA developed the programme to assess the risk of New Zealand roads and targeted it at decision makers and the wider public.
11 Other countries require median barriers on all high-speed routes that carry over 10,000–15,000 vehicles per day. [1] Sweden aims to install median barriers on all roads that carry more than 4000 vehicles per day.
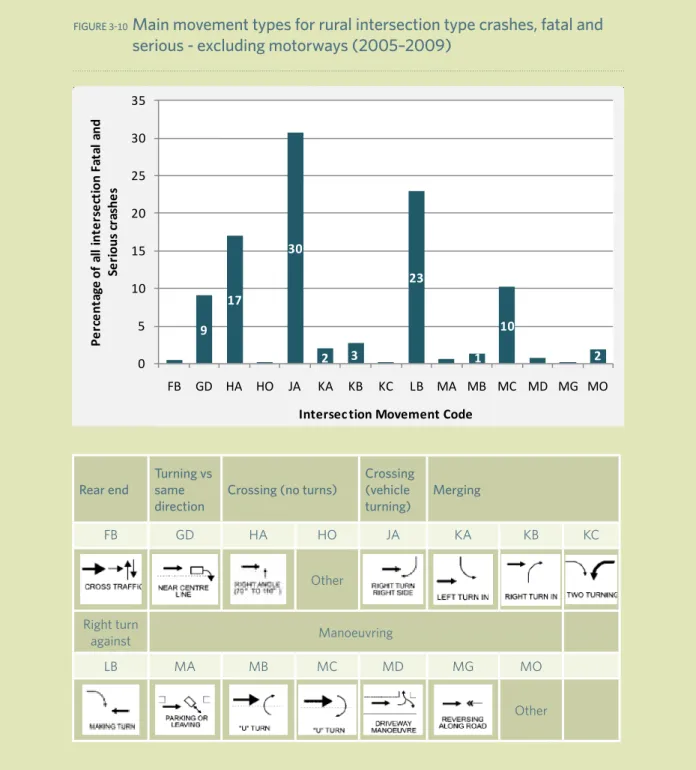
3.3.3 Intersections
Intersection crashes are the third key crash type. The main type of intersection crash movement on rural roads involves traffic crossing from different roads (48%), with straight across (HA)
comprising 17% and turning right from side road (JA) 31%. Vehicles turning right across traffic from the opposite direction (LB) make up 23%.
In order to achieve KiwiRAP’s highest rating of 5 stars (ie the lowest safety risk), a route must have grade-separated intersections. Various forms of intersection countermeasures for high-risk rural routes are discussed in section 6 and appendix D.
For more information about intersection safety refer to the High-risk intersection guide.
FIGUre 3-10
Main movement types for rural intersection type crashes, fatal and
serious - excluding motorways (2005–2009)
9 17 30 2 3 23 1 10 2 0 5 10 15 20 25 30 35 FB GD HA HO JA KA KB KC LB MA MB MC MD MG MO Pe rc en ta ge o f a ll i nt er se ct io n Fat al a nd Se ri ou s c ra sh es
Intersec tion Movement Code
rear end Turning vs same
direction Crossing (no turns)
Crossing (vehicle turning) Merging FB GD HA HO JA KA KB KC Other Right turn against Manoeuvring LB MA MB MC MD MG MO Other
3.3.4 Vulnerable road users
1 Pedestrians and cyclists
Due to the lower numbers of users present, crashes involving vulnerable road users (pedestrians and cyclists) are less prevalent on rural or open road networks, than on urban roads (less than 3% of crashes in rural areas). They are not one of the three main crash types. However, where pedestrians and cyclists are involved in open road crashes, the outcomes are typically severe, due to the often high speeds of traffic and the human body’s limited tolerance of crash forces at speeds above 40km/h. As a result nearly two thirds of all New Zealand cyclist fatalities and one third of all pedestrian fatalities happen on rural roads. Clearly the personal risk to each cyclist and pedestrian is very high so where they are present their safety needs are important.
The inclusion of all fatal and serious crashes when identifying high-risk rural roads will help identify road sections that have high numbers of pedestrian and cyclist crashes.
2 Motorcyclists
Motorcyclists travel at high speeds with little protection and are at the highest personal risk of death and serious injury of any road users . On popular or high-risk routes any treatments proposed should recognise their vulnerability.
The inclusion of all fatal and serious crashes when identifying high-risk rural roads will help identify road sections that have a high-risk for motorcyclists. Refer to the High-risk motorcycle guide for further information.
Section 5.2.2 of this guide describes the main safety issues for motorcyclists on rural roads and introduces those countermeasures that are most relevant to their needs.
4 Identifying high-risk rural roads
The safety performance of a road is a function of:• the likelihood of each user travelling on the road being involved in a crash
• the exposure or frequency, ie the number of vehicles using the route (traffic volume).
High-risk rural roads are essentially lengths of road with a higher than ‘average’ crash risk, and by implication are roads where targeted safety improvements are most likely to reduce trauma. High-risk rural roads are where the greatest reduction in severe casualties can be achieved, which is why they represent one of the highest Safe Roads and Roadsides priorities for investigation. However, there are also likely to be benefits from improving roads with moderate risks, or riskier spot locations (such as crash clusters/blackspots) on road lengths not formally classified as high-risk by this guide. Cost-effective solutions may be available for such sites and it is not the intention of this guide to stop blackspot studies and treatments, but rather to focus most attention on high-risk routes.
This section of the guide defines risk metrics and what constitutes a high-risk rural road and outlines how the various risk metrics that make up the definition of a high-risk rural road can be derived. Guidance has also been provided on how these metrics can be used to determine an appropriate treatment strategy, together with some examples of the process.
4.1 High-risk rural road definitions
A high-risk rural road is defined as:• a rural road where the fatal and serious crash rate (personal risk) or crash density (collective risk) is classified as high or medium–high compared with other roads (section 4.4.1 and figures 4-1 and 4-2) and/or
• a high or medium–high collective risk and/or high or medium–high personal risk (as defined by KiwiRAP risk maps) (section 4.4.4) and/or
• a rural road that has engineering features that have the potential for fatal or serious injury crashes to occur as determined by the KiwiRAP star rating or road protection score (RPS), eg a road with 1 or 2 stars or an RPS greater than 10 (section 4) and/or
• an equivalent process such as the Road Infrastructure Safety Assessment (RISA) where personal risk is greater than 2.5 (section 4.4.3).
We have not defined a minimum road length. We have specified a minimum number of high severity crashes instead. The road sections must have crash histories of 3 or more fatal and serious crashes over a 5-year period or 5 or more fatal and serious crashes over a 10-year period. Desirably, lengths of road being considered should be corridors (maybe 10km or longer) or adjoining road sections with similar characteristics, traffic volumes, environment and road-use purpose. However shorter lengths can be considered. At the extremes a very short section of road with 3 or more high severity crashes will be a blackspot with a high crash density, whilst a very long section may have a low crash density (collective risk) albeit possibly a high crash rate (personal risk) and may only justify relatively low cost delineation improvements. In either case the process and countermeasures outlined in this guide are relevant.
With regard to predicted risk metrics (KiwiRAP star rating, RPS or RISA), we still do not define a minimum length; however, the likely crash numbers of 5 crashes in 10 years (ie at least 0.5 crashes per year) would need to be determined, taking into account the road length and traffic volume. An example of this is provided in appendix C.
4.2 Summary of process
The process of identifying high-risk rural roads in our networks should be completed at least every three years to provide information to support maintenance and renewal works included in the three-year National Land Transport Programme (NLTP). Table 4-1 shows the total process (from selection of the route to monitoring and evaluation) and table 4-2 summarises the processes we can use to determine high-risk rural roads. Detailed information on each of these is provided in section 4.5, with some description of treatment examples.
TABLE 4-1
General summary of process to determine, manage, implement
and monitor high-risk rural roads
Select route Crash datarisk maps
(section 4.3)
Determine risk rating CAS, rAMM, KiwirAP,star rating,
rPS, rISA (section 4.4)
Overall treatment philosophy Section 4.5,figure 4-6
Understanding the issues Section 5
Determine countermeasures Section 6, and appendices D, e & F
Programme/project development/funding Section 7
Use T reatment Philosoph y Str at egy (figur e 4-6) t o det ermine appr opriat e scale of tr eatments f or the r out e ollectiv e and per
sonal risk definitions, a minimum number of f
atal and serious cr
ashes will be needed, ie 3 or mor
e f
atal and serious cr
ashes o
ver a
5-year period and 5 or mor
e f
atal and serious cr
ashes o
ver a
oad identified thr
ough the pr
edict
ed risk metrics (ie RPS, star r
ating and RIS
A
) must c
orr
elat
e with the equiv
alent of g ener ating 3 high-se verit y cr ashes o ver 5 y ear s ( or 1. 4 per y ear) verit y o ver 10 y ear s (2.8 per y
ear ) using figur
es C
-1 and C
-2 in appendix C.
TAble 4-2
Detailed summary of process to identify high-risk rural roads
Note that we only need to use one of these processes to determine whether or not we have a high-risk rural road. However, different processes may give different results, and if possible it is best to use several processes to determine a better understanding of the issues.
Hi gh -ri sk ru ra l r oa ds g ui de ra l r oa ds g ui de fi na l 1 6 au gu st 2 01 1w or ki ng fi le hi gh ri sk ru ra l r oa ds g ui de fi na l 1 6 au gu st 2 01 1w or ki ng fi le .d oc x 27 4. 2 De ta ile d su m m ar y of pr oc es s t o id en tify h ig h-ris k ru ra l r oa ds ha t y ou o nl y n ee d t o u se o ne o f t he se p ro ce ss es to d et er m in e w he th er o r n ot y ou h av e a hi gh ri sk ru ra l r oa d. H ow ev er , d iff er en t p ro ce ss es m ay g iv e di ffe re nt re sul ts , a nd sib le it i s b es t to u se se ve ra l p ro ce ss es to d et er m in e a be tt er u nd er st and in g of th e iss ue s U si ng C AS ido r o r ne tw or k-ba se d ly sis a nd sc re eni ng le ct and pl ot hi gh-rity cr as he s w ithi n a tw or k or ro ute to te rm ine ro ute s f or the r i nv es tig ati on rm ine co lle cti ve a nd ona l r isk [R is k M et ric ] r e ac h of the ro ute s (s ec tio n 4. 3. 3) rm ine w he the r the re hi gh-ris k r ur al ro ad* pa re d to o the r r ur al (s ec tio n 4. 4. 1 us ing ur es 4-1 an d 4-2) U si ng R AM M m or e appr opr ia te tha n CA S fo r ne tw or k w ide sc re eni ng U se tr af fic cr as h da ta in RA M M to c re ate a n annua l re po rt fr om C AS w hi ch is linke d to the R AM M ro ad I.d ( S ee a ppe ndi x A) De te rm ine C ol le cti ve a nd Pe rs on al R isk [ Ri sk M et ric ] fo r e ac h of the ro ute s (s ec tio n 4. 3. 3) De te rm ine w he the r the re is a hi gh ris k rur al ro ad* co m pa re d to o the r r ur al ro ads . ) se cti on 4. 4. 1 us ing fig ur es 4-1 an d 4-2) U si ng R IS A ( m or e appr opr ia te w he re ce rta in co rr id or a sse ssm en t h av e al re ady be en co m pl ete d Se le ct studi ed ro ute s w ithi n ne tw or k Fi lte r o ut ur ba n site s, sho rt le ng ths o f r oa d, a nd co rr id or s p ro gra m m ed fo r othe r i nf ra str uc tur e w or ks Fi lte r o ut ro ute s RI SA v al ue >2 .5 fo r p er so na l r isk [R is k M et ric ] to de te rm ine w he the r the y ar e a hi gh ris k ru ra l r oa d* U si ng K iwi RA P Ri sk M ap s ca lc ul ate d fo r l ong er le ng ths o f hi ghw ay (> 5km ), ty pi ca lly be tw ee n to w n ce ntr es Se le ct ro ut e/ s f ro m th e publ ishe d Ki w iR AP m aps fo r bo th co lle ct iv e and pe rs ona l ris k [ R isk M etr ic ] w ith in yo ur ne tw ork De te rm in e th e ris k le ve l o f co lle ctiv e an d pe rs on al ris k [ Ri sk M et ric ] m ap s ( i. e h ig h, m edi um -hi gh, m edi um , l ow -m edi um a nd lo w ) De te rm in e w he th er th er e is a hi gh ris k rur al ro ad* us ing de fin itio ns ( se ctio n 4. 4. 4) U si ng K iwi RA P St ar R at in g Ri sk Ma ps ca lc ul ate d fo r l ong er le ng ths o f hi ghw ay (> 5km ) Se le ct ro ute /s fr om the publ ishe d Ki w iR AP m aps fo r s ta r r ati ng s [ R isk M etr ic ] w ithi n yo ur ne tw or k De te rm in e th e ris k le ve l o f the sta r r ati ng [ Ri sk M et ric ] De te rm ine w he the r the re is a hi gh ris k rur al ro ad* us ing de fini tio ns i. e sta r ra tin g <3 ( s ec tio n 4. 4. 5) U si ng K AT ( St ar R at ing and Ro ad Pr ot ec tio n Scor e) m or e appr opr ia te fo r sh or te r c or rid or inv es tig ati ons ( >= 1 00 m ) Se le ct N etw or k M ai nte na nc e Ar ea s ( N M A) or ro ute s w ithi n N M A Fi lte r o ut ur ba n site s, sho rt le ng ths o f r oa d, a nd co rr id or s p ro gr am m ed fo r othe r i nf ra str uc tur e w or ks Fi lte r o ut ro ute s w ith Sta r ra tin g <3 o r R PS > 10 [R is k M et ric ] to de te rm ine w he the r the y ar e a hi gh ris k ru ra l r oa d* U se T re at m en t P hi lo so phy S tr at eg y (fi gur e 4-6) to de te rm ine a ppr op ria te sc al e of tr ea tm en ts fo r t he ro ut e e co lle cti ve a nd p er so na l r isk d ef in iti on s, a m in im um n um be r o f f at al a nd se rio us c ra sh es w ill b e n ee de d. , i e 3 fa ta l a nd s er io us c ra sh es o ve r a 5 y ea r p er io d a nd 5 fa ta l a nd se rio us c ra sh es o ve r a 10 ye ar S im ila rly a se ctio n of ro ad id en tif ie d th ro ug h th e pr ed icte d ris k m etr ic s i .e R PS , s ta r r ati ng a nd R IS A m us t c or re la te w ith th e eq ui va le nt o f ge ne ra tin g 3 hi gh se ve rit y cr as he s o ve r 5 y ea rs (o r 1 .4 /y ea r) o r 5
4.3 Step 1: Process to calculate risk metrics
4.3.1 Risk metrics
Risk metrics are a set of measures to help determine crash risk. Generally, this can be defined in two different ways:
1 Actual crash risk: Actual crash risk is based on crashes reported in recent years and is, in
theory, the primary measure of performance. It is most reliable where crashes are frequent, which happens on the busier roads where traffic volumes are also more reliable. However, on quieter roads, the crash density of fatal and serious crashes becomes too low to provide a reliable picture. KiwiRAP has already published some actual crash risk metrics (section 4.4.4). These are:
• collective risk maps
• personal risk maps.
2 Predicted crash risk: Predictive risk scores are most useful for roads with fewer crashes and
lower traffic volumes, where the random nature of crashes can be misleading when dealing with small crash numbers. Because Safer Journeys and the Safe System approach focus on the less common fatal and serious crashes, predictive risk scores are important to ensure we don’t implement measures that simply chase random crashes around the network. Metrics for predicting risk have also been developed for both state highways (KiwiRAP) and local roads (RISA programme). These are:
• KiwiRAP road protection score (RPS) (section 4.4.5)
• KiwiRAP star rating (published maps – section 4.4.5)
• Road Infrastructure Safety Assessment (RISA) (section 4.4.3).
Given the higher traffic volumes using the state highway network and the relatively high proportions of high-severity crashes, the initial release of KiwiRAP has focused on rural state highways. However, all RCAs are able to calculate collective and personal risk from their crash histories and traffic volumes.
The definitions for each of the risk metrics are as follows:
• Collective risk (also known as crash density) is a measure of the number of high-severity (fatal
and serious) crashes that have happened per kilometre of road per year. Additional information and calculations are provided in section 4.3.3.
• Personal risk (or crash rate) is a measure of the number of high-severity (fatal and serious)
crashes that have happened per 100 million vehicle kilometres of travel on the road. Additional information and calculations are provided in section 4.3.3.
• Road protection score (RPS) (100m) is a predictive measure of the personal safety of a road
based on the presence or absence of road infrastructure features that are associated with the three major crash types on the New Zealand rural road network, ie head-on, run-off road and intersection crashes (section 4.4.4).
• Star rating (5km) is a predictive measure of the personal safety of a longer length of road based
on the 100m RPSs and typically averaged over 5km lengths (section 4.4.4).
• Road Infrastructure Safety Assessment (RISA) is a technical review that assesses a sample of
an approved organisation’s road network to identify possible areas for safety improvement. This assessment method is still being trialled. It is based on international research that relates infrastructure features to crash rates, assesses the extent of these features on the road network, recommends high-level strategic actions to improve road safety on a network-wide basis and is used as an input to technical reviews (section 4.4.3).
By taking predictive rating scores for personal risk and converting them to personal risk using known relationships, it is possible to multiply them by traffic volumes to create predictive metrics that represent collective risk or crash density.
4.3.2 Selection of risk metrics for individual RCAs
To help RCAs identify high-risk rural roads, the following risk metrics can currently be used:
![FIGUre 2-1 Survivable impact speeds for different scenarios ([118 – figure 7])](https://thumb-us.123doks.com/thumbv2/123dok_us/9841481.2477060/13.892.51.854.456.830/figure-survivable-impact-speeds-different-scenarios-figure.webp)