UNIVERSITAT POLIT`
ECNICA DE CATALUNYA
Doctoral programme:
AUTOMATIC CONTROL, ROBOTICS AND COMPUTER VISION
Doctoral Dissertation
A CONTRIBUTION TO THE RANKING AND
DESCRIPTION OF CLASSIFICATIONS
Germ´
an S´
anchez-Hern´
andez
Co-Advisors:
Juan Carlos Aguado Chao
N´
uria Agell Jan´
e
it is fully adequate in scope and quality as a dissertation for the degree of Doctor of Philosophy.
Juan Carlos Aguado Chao (Principal Co-Advisor)
I certify that I have read this dissertation and that, in my opinion, it is fully adequate in scope and quality as a dissertation for the degree of Doctor of Philosophy.
N´uria Agell Jan´e (Principal Co-Advisor)
Acta de calificación de tesis doctoral
Curso académico: 2012-2013Nombre y apellidos
Germán Sánchez Hernández DNI / NIE / Pasaporte
53075559T Programa de doctorado
Automática, Robótica y Visión (ARV) Unidad estructural responsable del programa
Instituto de Organización y Control de Sistemas Industriales (IOC), Departamento de Ingeniería de Sistemas, Automática e Informática Industrial (ESAII)
Resolución del Tribunal
Reunido el Tribunal designado a tal efecto, el doctorando / la doctoranda expone el tema de la su tesis doctoral titulada _ A contribution to the ranking and description of classifications ________________ __________________________________________________________________________________________. Acabada la lectura y después de dar respuesta a las cuestiones formuladas por los miembros titulares del tribunal, éste otorga la calificación:
APTA/O NO APTA/O
(Nombre, apellidos y firma)
Presidente/a
(Nombre, apellidos y firma)
Secretario/a
(Nombre, apellidos y firma)
Vocal
(Nombre, apellidos y firma)
Vocal
(Nombre, apellidos y firma)
Vocal
______________________, _______ de __________________ de _______________
El resultado del escrutinio de los votos emitidos por los miembros titulares del tribunal, efectuado por la Escuela de Doctorado, a instancia de la Comisión de Doctorado de la UPC, otorga la MENCIÓN CUM LAUDE:
SÍ NO
(Nombre, apellidos y firma)
Presidenta de la Comisión de Doctorado
(Nombre, apellidos y firma)
Secretaria de la Comisión de Doctorado
Acknowledgments/Agradecimientos
Agradecer a las empresas e instituciones acad´emicos...Fundaci´o ESADE, AIS, UPC
This work is partially supported by the SENSORIAL Research Project (TIN2010-20966-C02-01, 02), funded by the Spanish Ministry of Science and Information Technology. This research work has been partially conducted during a three-months visiting period to the Centre for Computational Intelligence (CCI) at De Montfort University in Leicester (UK). The participation and interest of the firm Textil Seu SA in the SENSORIAL project is also gratefully acknowledged.
I have many people to thank for their support during the preparation and writing of this disser-tation. As with most of them I communicate in Spanish (or Catalan), that is the language I have used in these acknowledgments.
Este doctorado ha supuesto un recorrido a lo largo de un camino desafiante que no habr´ıa sido capaz de recorrer sin la ayuda de mi familia, amigos y colegas. Entre ellos, el agradecimiento m´as especial es para mis padres Germ´an e In´es per haberme educado con rectitud y amor. No solo me han apoyado incondicionalmente estos ´ultimos a˜nos de doctorado, sino que lo han hecho desde mis primeros garabatos a l´apiz. Esperemos que tengan raz´on en eso de “ya llegar´an los frutos”. Tambi´en tengo que agradecer a mis hermanos Dar´ıo y Almudena por el ejemplo a seguir que me han proporcionado desde bien peque˜no.
A mis co-directores, Juan Carlos Aguado y N´uria Agell, por su comprensi´on, entusiasmo y dedicaci´on en la direcci´on de este trabajo. Buena parte de esta tesis les corresponde, especialmente a N´uria, que me ha llevado de la mano como si de una madre se tratara desde aquel d´ıa que baj´o al CPD de ESADE preguntando por alguien con ganas de trabajar con ella. ¡Gracias, N´uria!
Cecilio, Francisco, M`onica, M´onica, Quico, Xari... a´un sigo aprendiendo de vosotros (¡y lo que me queda!). A la gente del JARCA y CCIA, por hacerme disfrutar de los congresos tanto a nivel cient´ıfico como social. Y a Paco Chiclana, por su inmejorable acogida durante mi estancia en Leicester y su excelencia a la hora de trabajar.
A mis colegas, amigos y compa˜neros de penas y alegr´ıas Albert Sam`a, Ricardo Campos y Josean Sanabria. El primero est´a tambi´en a punto de leer la tesis, mientras que los otros dos lo hicieron hace no muchos meses. Ha sido un placer trabajar con vosotros.
En general, a todos los amigos con los que he compartido mi vida en estos ´ultimos a˜nos. A los Esade Crew, Pichotes, colegas de AIS, gente del CPD, FIBers, badalonins, hattrickeros... al fin puedo responder a vuestra reiterativa pregunta: “Muy bien pero... ¿cu´ando lees la tesis?”. Menci´on especial para Julio, por entenderme como nadie y por estar siempre ah´ı, sin importar la distancia f´ısica.
Y finalmente, a mi mujer Ver´onica (no, no estamos casados pero s´ı, es mi mujer) por su com-prensi´on y apoyo no solo durante estos ´ultimos a˜nos sino desde la primera ´epoca de ex´amenes en la FIB. Gran parte de la motivaci´on para acabar esta tesis es debida a las ganas de darle una alegr´ıa, as´ı que todo esto va por ti. Porque pronto seremos tres. Te quiero, bonita. ¡Gracias, Vero!
Abstract
This thesis presents a novel and complete fuzzy multi-criteria decision making (MCDM) method-ology. This methodology is specifically designed for selecting classifications in the framework of unsupervised learning systems. The main results obtained are twofold. On the one hand, the definition of fuzzy criteria to be used to assess the suitability of a set of given classifications and, on the other hand, the design and development of a natural language generation (NLG) system to qualitatively describe them.
Unsupervised learning systems often produce a large number of possible classifications. In order to select the most suitable one, a set of criteria is usually defined and applied sequentially to assess and filter the obtained classifications. This is done, in general, by using a true-false decision in the application of each criterion. This approach could result in classifications being discarded and not taken into account when they marginally fail to meet one particular criterion even though they meet other criteria with a high score. An alternative solution to this sequential approach has been introduced in this thesis. It consists of evaluating the degree up to which each fuzzy criterion is met by each classification and, only after this, aggregating for each classification the individual assessments. This overall value reflects the degree up to which the set of criteria is globally satisfied by each classification.
Five fuzzy criteria are defined and analysed to be used collectively to evaluate classifications. The corresponding single evaluations are then proposed to be aggregated into a collective one by means of an Ordered Weighted Averaging (OWA) operator guided by a fuzzy linguistic quantifier, which is used to implement the concept of fuzzy majority in the selection process. In addition, a NLG system to qualitatively describe the most important characteristics of the best classification is designed and developed in order to fully understand the chosen classification. Finally, this new
methodology is applied to a real business problem in a marketing context. The main purpose of this application is to show how the proposed methodology can help marketing experts in the design of specific-oriented marketing strategies by means of an automatic and interpretable segmentation system.
Resumen
En esta tesis se presenta una novedosa y completa metodolog´ıa difusa y multicriterio (MCDM). Esta metodolog´ıa est´a espec´ıficamente dise˜nada para la selecci´on de clasificaciones en el marco de los sistemas de aprendizaje no supervisado. Los principales resultados obtenidos son de dos tipos. Por un lado, la definici´on de criterios difusos que se utilizan para evaluar la idoneidad de un conjunto de clasificaciones dadas y, por otro lado, el dise˜no y desarrollo de un sistema de generaci´on de lenguaje natural (NLG) para describirlos cualitativamente.
Los sistemas de aprendizaje no supervisado producen a menudo un gran n´umero de posibles clasificaciones. Con el fin de seleccionar la m´as adecuada, se suele definir y aplicar de forma secuencial un conjunto de criterios para evaluar y filtrar las clasificaciones obtenidas. Esto se hace, en general, mediante el uso de una decisi´on de verdadero o falso en la aplicaci´on de cada criterio. Este enfoque podr´ıa dar lugar al descarte de clasificaciones cuando marginalmente no cumplen con alg´un criterio particular, a pesar de que cumplen con otros criterios incluso con una puntuaci´on m´as alta. En esta tesis se introduce una soluci´on alternativa a este enfoque secuencial. Esta alternativa consiste en evaluar el grado hasta el cual cada criterio difuso es cumplido por cada clasificaci´on, y s´olo despu´es de esto, agregar para cada clasificaci´on las evaluaciones individuales. Este valor general refleja el grado hasta el cual el conjunto de criterios es globalmente satisfecho por cada clasificaci´on.
Se definen y analizan cinco criterios difusos para ser usados de forma colectiva para evaluar clasi-ficaciones. Se propone a continuaci´on la agregaci´on de las correspondientes evaluaciones individuales en una colectiva por medio de un operador OWA guiado por un cuantificador ling¨u´ıstico difuso, que se utiliza para poner en pr´actica el concepto de mayor´ıa difusa en el proceso de selecci´on. Adem´as, un sistema NLG es dise˜nado y desarrollado para describir cualitativamente las caracter´ısticas m´as
importantes de la mejor clasificaci´on con el fin de entender plenamente la clasificaci´on elegida. Por ´
ultimo, esta nueva metodolog´ıa es aplicada a un problema empresarial real en un contexto de mar-keting. El prop´osito principal de esta aplicaci´on es mostrar c´omo la metodolog´ıa propuesta puede ayudar a los expertos de marketing en el dise˜no de estrategias de marketing espec´ıficas y orientadas por medio de un sistema de segmentaci´on autom´atica e interpretable.
Resum
En aquesta tesi es presenta una nova i completa metodologia difusa i multicriteri (MCDM). Aquesta metodologia est`a especificament disenyada per a la selecci´o de classificacions en el marc dels sistemes d’aprenentatge no supervisat. Els principals resultats obtinguts s´on de dos tipus. D’una banda, la definici´o de criteris difusos que s’utilitzen per avaluar la idone¨ıtat d’un conjunt de classificacions donades i, d’altra banda, el disseny i desenvolupament d’un sistema de generaci´o de llenguatge natural (NLG) per descriure’ls qualitativament.
Els sistemes d’aprenentatge no supervisat produeixen sovint un gran nombre de possibles classi-ficacions. Amb la finalitat de seleccionar la m´es adequada, se sol definir i aplicar de forma seq¨uencial un conjunt de criteris per avaluar i filtrar les classificacions obtingudes. Aix`o es fa, en general, mit-jan¸cant l’´us d’una decisi´o de cert o fals en l’aplicaci´o de cada criteri. Aquest enfocament podria donar lloc al descartament de classificacions quan marginalment no compleixen amb algun criteri particular, a pesar que compleixen amb altres criteris fins i tot amb una puntuaci´o m´es alta. En aquesta tesi s’introdueix una soluci´o alternativa a aquest enfocament seq¨uencial. Aquesta alterna-tiva consisteix en avaluar el grau fins al qual cada criteri dif´us ´es complert per cada classificaci´o, i nom´es despr´es d’aix`o, agregar per a cada classificaci´o les avaluacions individuals. Aquest valor gen-eral reflecteix el grau fins al qual el conjunt de criteris ´es globalment satisfet per cada classificaci´o. Es defineixen i analitzen cinc criteris difusos per ser usats de forma col·lectiva per avaluar classificacions. Es proposa a continuaci´o l’agregaci´o de les corresponents avaluacions individuals en una de col·lectiva per mitj`a d’un operador OWA guiat per un quantificador ling¨u´ıstic dif´us, que s’utilitza per posar en pr`actica el concepte de majoria difusa en el proc´es de selecci´o. A m´es, un sistema de NLG ´es dissenyat i desenvolupat per descriure qualitativament les caracter´ıstiques m´es importants de la millor classificaci´o amb la finalitat d’entendre plenament la classificaci´o triada.
Finalment, aquesta nova metodologia ´es aplicada a un problema empresarial real en un context de m`arqueting. El prop`osit principal d’aquesta aplicaci´o ´es mostrar com la metodologia proposada pot ajudar als experts de m`arqueting en el disseny d’estrat`egies de m`arqueting espec´ıfiques i orientades per mitj`a d’un sistema de segmentaci´o autom`atica i interpretable.
Contents
1 Introduction 1
1.1 Motivation and framework . . . 2
1.2 Objectives . . . 3
1.3 Theoretical background . . . 3
1.4 Structure of the doctoral thesis . . . 5
1.5 Publications derived from this thesis . . . 6
2 Literature review 9 2.1 Criteria for selecting classifications . . . 10
2.2 Aggregation functions based on OWA operators . . . 14
2.3 Data-to-text systems for generating natural language . . . 18
3 Fuzzy criteria for selecting classifications 25 3.1 First criterion: useful number of classes . . . 27
3.2 Second criterion: balanced classes . . . 30
3.3 Third criterion: coherent classification . . . 38
3.4 Fourth criterion: dependency on external variables . . . 43
3.5 Fifth criterion: accuracy of the predictive model . . . 45
3.6 Conclusions . . . 46
4 Natural language-based automatic qualitative description of clusters 49 4.1 Signal analysis . . . 51
4.3 Document planning . . . 70
4.4 Microplanning and realisation . . . 85
4.5 Conclusions . . . 92
5 Application to market segmentation 95 5.1 Dataset . . . 96
5.2 Obtaining segmentations . . . 99
5.3 Ranking and selecting segmentations . . . 101
5.4 Qualitative class description . . . 106
5.5 Discussion and managerial implications . . . 128
5.6 Conclusions . . . 132
6 Limitations and future research 133
A Learning Algorithm for Multivariate Data Analysis (LAMDA) 137
List of Tables
2.1 Clustering validation criteria (Part I) . . . 12
2.2 Clustering validation criteria (Part II) . . . 13
2.3 Preference results inReiter et al.(2005) where statisticallly significant results are in bold. . . 20
2.4 Data-to-text systems . . . 23
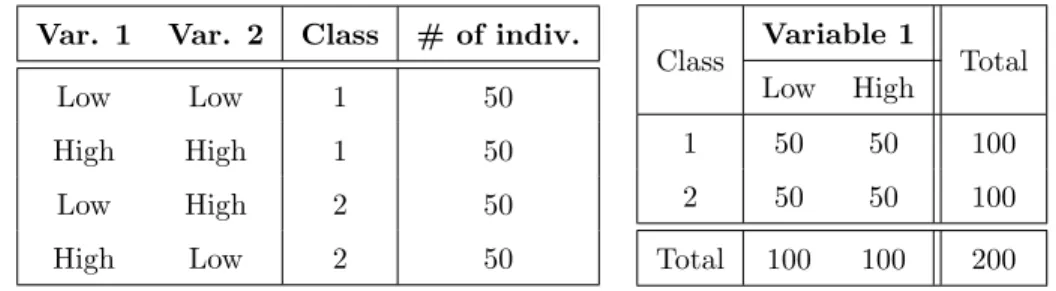
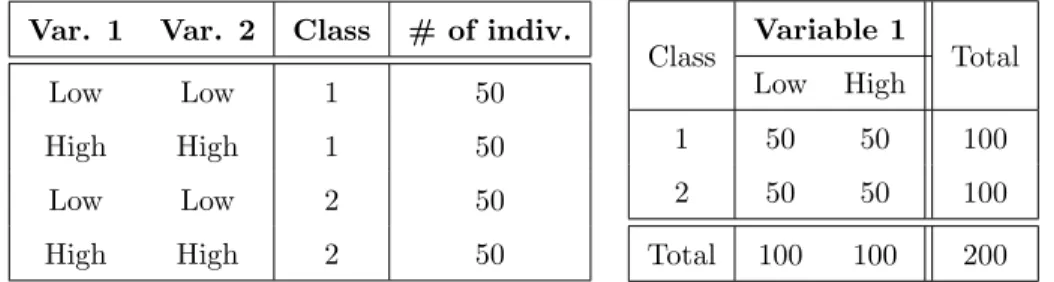
3.1 Marginal Adequacy Degrees (MADs) of individuals in classificationC1 . . . 42
3.2 MADs of individuals in classificationC2 . . . 43
3.3 Differences between maximum and minimum MAD . . . 43
3.4 Contingency table . . . 44
4.1 Contingency table of the example . . . 55
4.2 Expected values in the example . . . 56
4.3 Example: variables independent on class but dependent when combining them . . . 56
4.4 Example: combination of independent variables becoming dependent on class . . . . 57
4.5 Example: variables independent on class and also independent when combining them 57 4.6 Example: combination of independent variables remaining independent on class . . . 58
4.7 Values of importance in the example . . . 59
4.8 Conditional and joint distributions in the example . . . 62
4.9 Summary of type-A rules, showing which attributes are checked by each rule . . . . 64
4.10 Summary of the activation of type-B rules, showing which attributes are checked by each rule . . . 71 4.11 Example of messages ordered according to the defined criteria and the resulting groups 88
4.12 Compatibility between type-B rules . . . 89
4.13 Summary of type-B rules . . . 94
5.1 Description of variables . . . 98
5.2 Number of segmentations obtained by hybrid connective . . . 102
5.3 Distribution of variablePromosSensit . . . 104
5.4 Extract of the best segmentations using fuzzy selection criteria OWA methodology . 105 5.5 Frequencies of each obtained interval in the discretisation process . . . 106
5.6 Chosen modalities for the discretised variables . . . 107
5.7 Contingency table of variableCompetition . . . 107
5.8 Expected frequencies of variableCompetition . . . 109
5.9 values of importance (VoIs) associated with variableCompetition . . . 109
5.10 Cut points obtained for each variable and number of relevant VoIs detected . . . 110
5.11 Conditional frequencies of variableCompetition . . . 111
5.12 Percentiles of conditional frequencies to detect extreme frequencies (EFs) . . . 112
5.13 Number of obtained extreme frequencies . . . 112
5.14 Initial messages detected for variableCompetition. The rest of messages are included in Table B.10 . . . 113
5.15 Groups of messages affected by rule A.1 . . . 114
5.16 Groups of messages of variableCompetition affected by rule A.2. The rest of groups are shown in Table B.12 . . . 115
5.17 Messages of variablePromosSensitaffected by rule A.3. The rest of groups are shown in Table B.13 . . . 115
5.18 Groups of messages affected by rule A.5 . . . 117
5.19 Frequency of each final weight after applying type-A rules . . . 117
5.20 Groups of messages affected by rule B.1 . . . 118
5.21 Groups of messages affected by rule B.2 (first step, same sign). . . 119
5.22 Groups of messages of variableCompetition affected by rule B.2 (second step, differ-ent sign). The rest of groups are detailed in Table B.18 . . . 119
5.23 Messages affected by rule B.4 . . . 120
5.25 Messages affected by rule C.1 . . . 121
5.26 Messages affected by rule C.2 . . . 121
5.27 Variables needing a special transcription (rule C.3) . . . 122
5.28 Variables with modalities as adjectives (rule C.4) . . . 122
5.29 Number of messages implied in the analysis of each rule . . . 123
5.30 Final planning of the text . . . 124
5.31 Features of messages of group #4 . . . 125
5.32 Best segmentations according toIB. . . 129
5.33 Best segmentations according toIC. . . 129
5.34 Best segmentations according toID. . . 130
5.35 Best segmentations according toIA. . . 130
B.1 Best 100 segmentations . . . 141
B.2 Contingency tables of the selected variables (part I) . . . 145
B.3 Contingency tables of the selected variables (part II) . . . 146
B.4 Expected frequencies of the selected variables (part I) . . . 147
B.5 Expected frequencies of the selected variables (part II) . . . 148
B.6 Values of importance associated with the selected variables (part I) . . . 149
B.7 Values of importance associated with the selected variables (part II) . . . 150
B.8 Conditional frequencies of the selected variables (part I) . . . 151
B.9 Conditional frequencies of the selected variables (part II) . . . 152
B.10 Initial messages of the selected variables . . . 153
B.11 Groups of messages affected by rule A.1 . . . 156
B.12 Groups of messages affected by rule A.2 . . . 157
B.13 Groups of messages affected by rule A.3 . . . 158
B.14 Groups of messages affected by rule A.5 . . . 159
B.15 Filtered messages that will be mentioned in the final text . . . 160
B.16 Groups of messages affected by rule B.1 . . . 162
B.17 Groups of messages affected by rule B.2 (first step: same sign). . . 162
B.18 Groups of messages affected by rule B.2 (second step: different sign) . . . 163
B.20 Messages affected by rule B.5 . . . 164
B.21 Messages affected by rule C.1 . . . 164
B.22 Messages affected by rule C.2 . . . 164
B.23 Variables needing a special transcription (rule C.3) . . . 165
List of Figures
2.1 Some Regular Increasing Monotone (RIM) functions and their corresponding
ob-tained weights . . . 18
3.1 Examples of usefulness degree functions withK1= 4 andK2= 7 . . . 29
3.2 Fuzzy concept ‘Useful number of classes’withK1= 3 and K2= 5 . . . 30
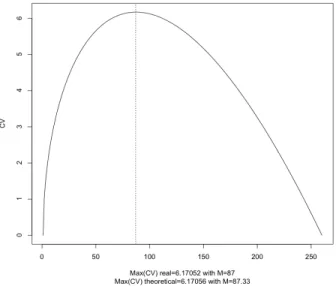
3.3 Functionf and its maximum coefficients of variation whenN = 260 . . . 36
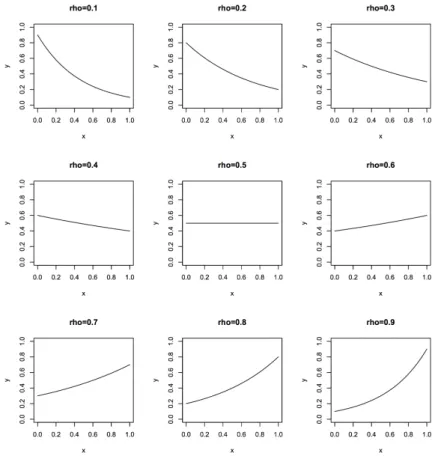
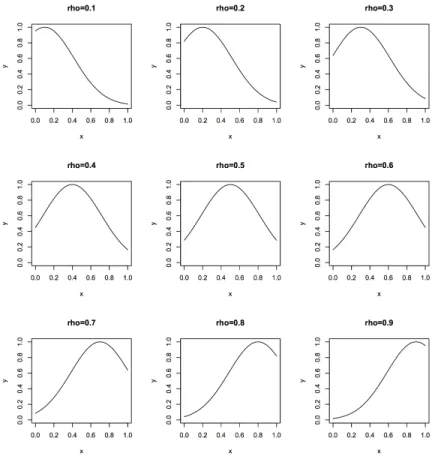
3.4 LAMDA classical function with different values ofρ . . . 39
3.5 Gaussian function with values= 0.1 and different values ofρ . . . 40
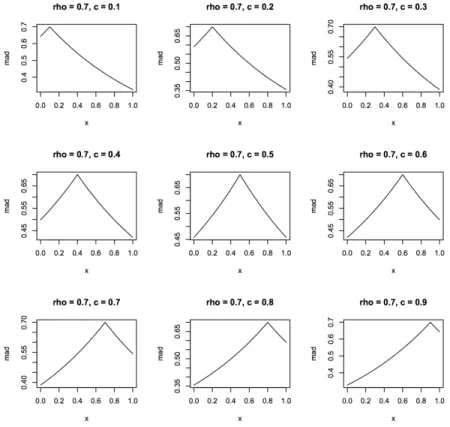
3.6 Waissman function with different values of the centrec. . . 41
4.1 Diagram of the designed NLG system. . . 52
4.2 Diagram of the Signal analysis stage. . . 53
4.3 The three clusters found in the VoIs of the example. . . 61
5.1 Summary of the considered variables in the dataset . . . 99
5.2 Histogram of the quantitative descriptors and their chosen density functions . . . 101
5.3 Histogram of the variable “number of classes” for the obtained segmentations . . . . 102
5.4 Membership function used of modelling the fuzzy concept ‘Useful number of classes’with K1= 3 and K2= 5 . . . 103
5.5 Distribution of the modalities within the classes, in addition with theirp−valueand the decision result of the selection process . . . 108
5.6 Histogram of the conditional frequencies of the dependent variables . . . 111
List of Acronyms
AI Artificial Intelligence . . . 50
B2B business to business . . . 133
BNF Backus-Naur Form . . . 85
BUM Basic Unit-interval Monotone . . . 16
CAIM class-attribute interdependence maximisation . . . 106
EF extreme frequency . . . 106
GAD Global Adequacy Degree . . . 138
IEM Information Entropy Maximisation . . . 54
LAMDA Learning Algorithm for Multivariate Data Analysis . . . 137
MAD Marginal Adequacy Degree . . . 138
MCDM multi-criteria decision making . . . 133
MDLP Minimum Description Length . . . 53
ML machine learning . . . 49
NIC Non-Informative Class . . . 139
NLG natural language generation. . . .133
OWA Ordered Weighted Averaging . . . 134
RBF Radial Base Functions . . . 139
RIM Regular Increasing Monotone . . . 105
SVM Support Vector Machine . . . 104
Chapter 1
Introduction
This document corresponds to the doctoral thesis carried out by Germ´an S´anchez Hern´andez. This thesis corresponds to the doctoral program of Automatic Control, Robotics and Computer Vision (ARV) of the Automatic Control Department (ESAII) and the Institute of Industrial and Control Engineering (IOC), belonging to the Universitat Polit`ecnica de Catalunya – BarcelonaTech (UPC)1. This thesis has been developed at ESADE Business School. ESADE is an international academic institution with over fifty years of history. ESADE head quarters are based in Barcelona and its main activities are education, research and social debating in the area of management, economy and business. The research lines of ESADE are mainly focused on entrepreneurship, innovation, leadership and governance, management, skills and knowledge, business social responsibility, etc. ESADE is affiliated with the Ramon Llull University (URL), a private, non profit-making university providing a public service.
The studies conducted in this thesis have been carried out at the Research Group on Knowledge Engineering2 (GREC). The GREC group was set up in 1994 and is recognised as a consolidated research group (2005 SGR 00943, 2009 SGR 855) by the Government of Catalonia. It is an inter-university group bringing together researchers from the BarcelonaTech and ESADE. Right from the outset, the multidisciplinary facet of the group has allowed it to work on both basic and applied research. The GREC’s main activity focuses on research and development of techniques in the area of Artificial Intelligence (AI). The GREC Research Group at ESADE has two broad goals: (1)
1ESAII:http://esaii.upc.edu; IOC:http://ioc.upc.edu; UPC:http://www.upc.edu
development of AI methodologies in non-structured environments (incomplete information, quali-tative and fuzzy); (2) the application of these methodologies to fields bearing on decision-making, finances and marketing.
1.1
Motivation and framework
Intelligent systems for decision support making are especially essential for companies or institutions that adopt strategies based on the use of information and operate in highly complex contexts. These systems must help in understanding and managing the large amount of information available from customers, products, competitors, and in assessing and analysing the alternatives in a explanatory and easily interactive way for the user. The growing interest in the last decades in automatic decision support systems lies in their ability to both synthesising information and obtaining easily interpretable results.
The use of unsupervised learning systems allows the behaviour of certain phenomena to be understood without relying on expert knowledge or information from past situations. Such systems usually offer several ways of segmenting the considered individuals. The selection of the best classification can be faced as a multi-criteria decision making (MCDM) approach. The definition of several criteria to evaluate several alternatives is done in this thesis by aggregating the assessments of each classification in terms of an Ordered Weighted Averaging (OWA) operator. Finally, some tools must be designed in order to interpret the chosen classification, as a qualitative description of the main characteristics of each considered class.
The final scope of this thesis was decided after a three-months visit period to the Centre for Computational Intelligence (CCI) at De Montfort University (DMU), in Leicester, United Kingdom. After having developed projects in which the selection of the best classification and its corresponding description were done in a manual way, the interest of the CCI in the research of operators for aggregating information led to the application of a MCDM approach for ranking classifications. Further research induced the development of a natural language generation (NLG) system to better understand the best classification by qualitatively describing the considered classes.
1.2
Objectives
The main objective of this thesis is to study and develop a complete MCDM system to create, select an understand the best classification on a set of individuals and according a set of criteria. This general objective can be divided into the following specific ones:
1. Generation of several classifications of a set of individuals by the application of unsupervised learning techniques.
2. Evaluation of classifications by analysing and designing a set of fuzzy criteria. Development of an index measuring the degree up to which each criterion is verified by each considered classification.
3. Rank of classifications by aggregating the assessments of each classification in terms of an OWA operator, and selection of the best classification.
4. Interpretation of a classification by designing an developing a NLG system that qualitatively describes the main characteristic of each class.
5. Application of this complete approach into a real marketing problem.
The main contributions of this thesis are related to the second and fourth objectives: the design of a set of fuzzy criteria to assess classifications (Chapter 3) and the development of a system to obtain a natural language-based description of a certain classification (Chapter 4).
1.3
Theoretical background
The use of machine learning (ML) tools within MCDM systems is especially interesting in envi-ronment where the available large volume of data has become a negative aspect when analysing alternatives and obtaining useful information. In general, either classification systems (supervised learning) or clustering systems (unsupervised learning) are used. The former are useful in situations in which the patterns have a label indicating their class, obtained from the behaviour, opinion or knowledge of an expert that is tried to be imitated when he is missing. The latter are convenient in scenarios where that label is not available. Frequently, both types of learning are used in com-bination. Situations can be found where, even being a classification available, existing classes are not separable. In these cases it is necessary to obtain a prior partition of initial classes
compat-ible enough with the original classification in order to group together the more similar examples, increasing the homogeneity of the resulting new classes.
This thesis is situated in the context of unsupervised learning algorithms. The origins of such learning systems date back to the end of the last century. Seminal studies conducted byAckley et al.
(1985) andBarlow (1989) were based on Boltzmann machines. These learning systems imported many of the concepts from multivariate statistics: either those based on the density estimation methods (Grenander and Miller, 1994) or those based on distances between patterns. For this reason, it is considered that there are two groups of unsupervised learning models (Barlow,1989). On the one hand, models based on the estimation of pattern distribution or density functions and, on the other hand, models based on distances between patterns or between patterns and classes. Models based on connectionist approaches can be found in both directions.
From the application point of view, unsupervised learning systems have been considered in the literature as systems capable to capture knowledge from complex structures (Duda et al.,2001;
Figueiredo and Jain,2002;Jain,2010). Such methods have been applied in a wide range of domains,
among which it is worth mentioning: text categorisation, images recognition, telecommunications fraud detection, stock price forecasting, bioinformatics, fault diagnosis, pollution classification and clinical or socioeconomic systems (Barr´on-Adame et al.,2012;Chen et al.,2005;Constantinos and
Paris, 2008; Elati and Rouveirol, 2011;Ferraretti et al., 2012; Goldsmith,2001; Hadavandi et al.,
2010; Lee and Yang, 2009; Niebles et al., 2008; Oliver et al., 2011; Yang et al., 2011). In the
marketing field, finding new and creative solutions is valuable because these allow for the definition of new strategies and innovation. The use of unsupervised learning algorithms allows us to suggest segmentations that are, in principle, not trivial. In this sense, behavioural patterns of ‘interesting’ profiles could be established by using this type of algorithms and these may reveal new customer profiles not yet known to experts (Chiu et al., 2009; Hong and Kim, 2012; Mo et al., 2010; Yao
et al., 2010; Lu et al., 2012).
Unsupervised learning systems produce in most cases a large number of possible classifications. The development of suitable tools or models for selecting classifications is an important topic of research in such area (Broder et al., 2008; Kukar, 2003; Osei-Bryson, 2010). It is usual to define a set of criteria in order to select the most suitable classification, and to apply them sequentially to the considered classifications (Choi et al., 2005; Osei-Bryson, 2010; S´anchez-Hern´andez et al.,
meet a particular criterion but it is important to note that it could result in classifications being prematurely discarded because they fail to meet one particular criterion but meet the other with a high grade.
An alternative to this sequential approach is that of evaluating the degree up to which each criterion is met by each classification. This can be done by modelling each criterion by means of a membership function, thus associating an index with each criterion. Once each criterion is evaluated on a classification, an overall aggregated value must be obtained for reflecting the degree up to which the set of criteria is satisfied by the classification.
Currently, at least 90 different families of aggregation operators have been studied (Chiclana
et al.,2004,2007;Dubois and Prade,1985;Fodor and Roubens,1994;Herrera et al.,2003;Klir and
Folger, 1988;Torra, 1997;Torra and Narukawa,2007; Xu and Da,2003;Yager,1988; Zhou et al.,
2008). Among them the OWA operator proposed byYager(1988) is the most widely used. One of the main reasons to support this extensive use is that the OWA operator allows the implementation of the concept of fuzzy majority in the aggregation phase by means of a fuzzy linguistic quantifier
(Zadeh, 1983) which indicates the proportion of satisfied criteria ‘necessary for a good solution’
(Yager, 1996). This is done by using the linguistic quantifier in the computation of the weights
associated to the OWA operator. The objective of the aggregation step is to combine a set of criteria in such a way that the final aggregation output takes all the single criterion into account
(Dubois and Prade, 1985). The final selection of classifications naturally derives from this set of
overall degrees and therefore valuable classifications are not discarded for having failed to meet few criteria.
Interpreting the classes of the chosen classification requires an amount of technical knowledge the end user does not usually possess (Oja, 1983). For this reason, it is desirable to rely on an automated tool for the description of these classes. If this description is done in a qualitative way, it enables the interpretation and understanding of the results, and improves the transmission of useful knowledge to experts.
1.4
Structure of the doctoral thesis
This thesis is structured as follows. In Chapter 2 a literature review of the topics of criteria for assessing and selecting classifications, aggregation functions based on OWA operators and natural
language systems for translating data to qualitative texts is provided. The next two chapters detail the main contributions of this thesis: Chapter 3 analyses and defines a set of five fuzzy criteria for assessing classifications while in Chapter 4 a NLG system to describe qualitatively the most important features of a classification is detailed. All analysed methodologies are applied in Chapter 5, where a case study is presented to generate, select and describe a segmentation from a real business situation. Finally, in Chapter 6 conclusions are drawn and suggestions made for further work. At the end of this document, Appendixes A and B include a brief explanation of LAMDA algorithm, the unsupervised learning method used in this thesis, and result tables of the case study, respectively.
Note that although the improvement or study of new aggregation functions is not within the scope of this thesis, Chapter 2 contains a description and a review of the literature on this topic. These functions have an important role in this thesis when summarising the information provided by the indexes associated with the criteria analysed in Chapter 3. Event though Chapter 5 presents an application of the presented methodology, Chapters 3 and 4 include easy examples with the aim of making this thesis reading more enjoyable and didactic. The end of each chapter contains a summary of conclusions related to the chapter, in addition with further research to be done.
1.5
Publications derived from this thesis
Germ´an S´anchez-Hern´andez, Francisco Chiclana, N´uria Agell, Juan Carlos Aguado (2013). Rank-ing and selection of unsupervised learnRank-ing marketRank-ing segmentation. Knowledge-Based Sys-tems, 44:20–33.
Francisco J. Ruiz, Albert Sam`a, Germ´an S´anchez, Jos´e Antonio Sanabria and N´uria Agell (2011). An interval technical indicator for financial time series forecasting. Proceedings of the 25th
International Workshop on Qualitative Reasoning (QR).
Germ´an S´anchez, Albert Sam`a, Francisco J. Ruiz and N´uria Agell (2010). Moving intervals for nonlinear time series forecasting. Proceedings of the 13th International Conference of the
Catalan Association for Artificial Intelligence (CCIA).
Jos´e Antonio Sanabria, Germ´an S´anchez, N´uria Agell and Josep Sayeras (2010). An application of SVMs to predict financial exchange rate by using sentiment indicators. Proceedings of the
V Simposio de Teor´ıa y Aplicaciones de Miner´ıa de Datos (TAMIDA).
Germ´an S´anchez, Juan Carlos Aguado, N´uria Agell, M´onica S´anchez (2009). Automatic Com-parison and Selection of Classifications in Unsupervised Learning Processes. XI Jornadas
de ARCA Sistemas Cualitativos, Diagnosis, Rob´otica, Sistemas Dom´oticos y Computaci´on
Ubicua (JARCA). Almu˜n´ecar (Granada), 24-26 June 2009.
Germ´an S´anchez, M`onica Casabay´o, Albert Sam`a and N´uria Agell (2008). Forecasting Customer’s Loyalty by Means of an Unsupervised Fuzzy Learning Method. Electronic proceedings of the
28th International Symposium on Forecasting, 43. Nice, 22-25 June 2008.
Germ´an S´anchez, Juan Carlos Aguado and N´uria Agell (2007). Forecasting New Customers’ Behaviour by Means of a Fuzzy Unsupervised Method. Artificial Intelligence Research and Development, Frontiers in Artificial Intelligence and Applications. Proceedings of the 10th
CCIA., 163:368–375. Andorra, 25-26 October 2007. ISBN: 978-1-58603-798.
Germ´an S´anchez, N´uria Agell, Juan Carlos Aguado, M´onica S´anchez and Francesc Prats (2007). Selection Criteria for Fuzzy Unsupervised Learning: Applied to Market Segmentation. In
Foundations of Fuzzy Logic and Soft Computing. Lecture Notes in computer Science, 4529:307–
310.
Cati Olmo, Germ´an S´anchez, N´uria Agell, M´onica S´anchez and Francesc Prats (2007). Using Orders of Magnitude and Nominal Variables to Construct Fuzzy Partitions. Proceedings of
the IEEE International Conference on Fuzzy Systems (FUZZ-IEEE), 1–6. London, 23-26 July
Chapter 2
Literature review
The application of unsupervised learning techniques enables the user to obtain new ways of segment-ing a data set that were previously unthinkable. The selection of the most suitable classification from the obtained (or considered) ones can be faced as a multi-criteria decision making (MCDM) problem, in which each alternative is assessed according a set of criteria. The application of the considered criteria can be done in a sequential way in which each criterion is applied by discarding those classifications whose evaluation does not reach a predefined threshold. An alternative to this sequential approach is, for each classification, to aggregate each individual assessment and there-fore to obtain a global ranking of the classification. Finally, in order to complete the system and fully understand the best classification according to the obtained ranking, a description of the most important characteristics of its classes must be provided.
In this thesis a contribution to the selection of classifications is provided, in terms of the criteria used to assess some aspects of the considered classifications, the functions used to aggregate the assessments and a qualitative description of the chosen classification with the aim of making the result of the MCDM system easily understandable. That is why this chapter includes a review of literature on this three topics. More specifically, Section 2.1 reviews criteria and methods for eval-uating classifications that can be obtained from applying any of the available clustering techniques, Section 2.2 reviews aggregation functions with a deeper emphasis in Ordered Weighted Averag-ing (OWA) operators and finally, in Section 2.3 a review of literature in data-to-text systems is provided.
2.1
Criteria for selecting classifications
Unsupervised learning or clustering is one of the most useful tools in data mining processes for discovering groups that were previously unknown. A clustering technique segments a given data set into groups or clusters such that the individuals in a cluster are more similar to each other than individuals in different clusters (Barlow,1989;Jain et al.,1999).
The design of suitable systems for selecting classifications is an important topic of research in clustering area (Kukar, 2003; Osei-Bryson, 2010) because such systems produce in most cases different classifications. If the inherent partition of a data set is known, the problem is translated into a search for the optimal clustering scheme that best fits this inherent partition (Halkidi et al.,
2002). Other approaches do not select directly the best classification, but define the final partition by grouping the obtained ones in term of voting or averaging (Broder et al., 2008). In general, it is not usual to have a priori information of the data set, so the selection of the most suitable classification lies in the application of a single criterion or a set of criteria previously defined.
There are mainly three types of clustering validation criteria: internal, external and relative
(Jain et al.,1999;Theodoridis and Koutroumbas,2008). Aninternal criterion tries to determine if
the classification structure is intrinsically appropriate for the considered data (Liu et al.,2010). An
external criterion of validation compares the considered classification with ana priori structure:
either a previously known partition of the analysed dataset typically provided by some domain experts or an external variable not participating in the clustering process (Wu et al.,2009). Finally,
arelativecriterion measures the relative similarity between two classifications, usually by comparing
them by using the same supervised technique (Jain et al.,1999).
Several works reviewing cluster validation indexes have been published. InHalkidi et al.(2001) a review of clustering algorithms is done. The algorithms are explained by comparing them, including a review of clustering validity measures. Liu et al.(2010) analyse a set of eleven internal criteria that measure compactness and separation of the considered clusters, and give the validation properties of some of these criteria in different scenarios. In Yatskiv and Gusarova (2005) a review of the computation of indexes related to the most used internal and external criteria is done.
Osei-Bryson(2010) gives an extensive review of cluster validation and provides a methodology in which
the considered classifications are being discarded by applying predefined thresholds on a set of validation criteria. These considered criteria cover the three types of validation criteria. These
works and other using or defining new criteria are shown in Tables 2.1 and 2.2.
Internal criteria for validating classifications can be classified according to the concept they are related to. Criteria associated with the compactness concept compute how closely related the individuals in a cluster are; these criteria are usually based on indexes measuring density or variance of the clusters (Bittmann and Gelbard, 2009; Cheng et al., 1999; Halkidi et al., 2001;
Liu et al., 2010; Ramze Rezaee et al., 1998; Tibshirani and Walther, 2005; Wang et al., 2009;
Xiong et al.,2009). Separability criteria determine how distinct or well-separated a cluster is from
other clusters (Halkidi et al., 2001; Liu et al., 2010; Ramze Rezaee et al., 1998; Tibshirani and
Walther, 2005; Wang et al., 2009; Xiong et al., 2009). Criteria related to theprediction strength
of the clusters calculate the accuracy rate of a model obtained by applying a supervised learning technique on them (Kukar, 2003; Osei-Bryson, 2010; Tibshirani and Walther, 2005; Xiong et al.,
2009). Some criteria are based on the number of important features (Osei-Bryson,2010). Criteria quantifying the achievement of goals can be very heterogeneous: from analysing desired structure of the obtained clusters (Cheng et al.,1999), applying economic theories (Choi et al.,2005), being assessed by graphical visualisations (Bittmann and Gelbard, 2009), or checking the existence of outliers clusters or pairs of variables (Osei-Bryson,2010).
External criteria require the existence of ana priori external variable or classification defined for each of the individuals. The computation of an index associated with external criteria can be performed by any of the following indexes: Rand statistic, Jaccard coefficient, Fowlkes and Mallows index, Hubert’s statistic and so on (Halkidi et al., 2001; Wu et al., 2009; Yatskiv and Gusarova,
2005).
Finally, the computation of relative criteria implies the pairwise comparison between clusters. This comparison is usually performed by some domain experts (Halkidi et al., 2001;Osei-Bryson,
2010;Yatskiv and Gusarova,2005). Although there are some methods to guide the search of which
comparisons should be made for minimising their number, relative criteria have not been taken into account in this work due to the usual difficulty in getting this feedback from the experts.
As it can be seen in Tables 2.1 and 2.2, all analysed papers give a review of existing criteria or make a definition of new criteria, all of them based on some of the concepts used for clustering evaluation. It is important to note that almost all concepts are covered in the present work.
P ap er Commen ts In ternal criteria External Relativ e Compactness Separabilit y Accuracy F eatures Goals criteria criteria Ramze Rezaee et al. (1998) One index for fuzzy c -Means Y es: compactness Y es: separation No No No No No Cheng et al. (1999) Subspace clustering Y e s: high densit y No No No Y e s: co v erage & correlation of dimensions No No Kuk ar (2003) Reliabilit y on diagnoses No No Y es: reliabilit y No No No No Haldiki et al. (2001) Review Y es: sev eral No No No Y es: sev eral Y es: sev e ral Choi et al. (2005) Asso ciation rules No No No No Y e s: Recency , F requenacy & Monet. V alue No No Tibshirani & W alther (2005) V ali da ti o n b y prediction strength Y e s: v ariance Y es: bias Y es: prediction strength No No No No Y atskiv & Gusaro v a (2005) Review No No No No No Y es: sev eral Y es: sev e ral Metho d presen ted Review & application Y es: IC (coherence) Y e s: IA (accuracy) No Y e s: IU & IB
(usefulness &balanced)
Y e s: ID (dep endency) No T able 2.1: Clustering v alidation criteria (P art I)
P ap er Commen ts In ternal criteria External Relativ e Compactness Separabilit y Accuracy F eatures Goals criteria criteria Bittmann & Gelbard (2009) Visualisation of hierarc hical clustering Y es: minimal hetereogeneit y No No No Y es: visualisation No No W ang et al. (2009) Clinical application Y es: Da vies-Bouldin & rel.-free No No No No No W u et al. (2009)
External criteria for
k -Means No No No No No Y es: sev e ral No Xiong et al. (2009) k -Means Y e s: Sum of Squared Errors Y es: en trop y and Co ef. of V ariation Y e s: F -measure No No No No Liu et al. (2010) In ternal criteria review Y es: sev eral Y es: sev eral No No No No No Osei-Bryson (2010) Review No No Y e s: accuracy Y es : # of imp ortan t v ariables Y es: outliers, Max/Min No Y e s: sev era l Metho d presen ted Review & application Y es: IC (coherence) Y es: IA (accuracy) No Y es: IU & IB
(usefulness &balanced)
Y es: ID (dep e n de n c y ) No T able 2.2: Clustering v alidation criteria (P art II)
2.2
Aggregation functions based on OWA operators
This section reviews the literature in aggregation functions, emphasising in the study of OWA operators. Although the improvement or study of new aggregation functions is not one of the contributions of this thesis, a study and review of the literature in this topic is done since these functions have an important role in this thesis. They are responsible for summarising the informa-tion provided by the indexes allowing us to select the most suitable classificainforma-tion.
The selection of the most suitable classification among a set of feasible ones and according to a set of predefined criteria can be faced as a MCDM approach. Each classification (alternative) is assessed by each of the considered criteria (evaluations). MCDM problems normally consist of two steps (Fodor and Roubens, 1994): aggregation andexploitation. The aggregation step consists of combining for each alternative the single evaluations into a collective evaluation in such a way that it summarises the conditions expressed in all the evaluations. The exploitation phase transforms the global evaluation of the alternatives into a ranking of the alternatives. This can be done in different ways, the most common being the use of a ranking method to obtain a score function
(Chiclana et al.,1998;Gramajo and Mart´ınez,2012;Zhang and Guo,2012;Zhou and Chen,2012).
Many different families of aggregation operators have been studied (Chiclana et al.,2004,2007;
Dubois and Prade, 1985; Fodor and Roubens, 1994; Herrera et al., 2003; Klir and Folger, 1988;
Torra,1997;Torra and Narukawa,2007;Xu and Da,2003;Yager,1988;Zhou et al.,2008). Among
them the OWA operator proposed by Yager (Yager, 1988) is one of the most widely used. Among the reasons to support this extensive use of the OWA operator is that it allows the implementation of the concept of fuzzy majority in the aggregation phase by means of a fuzzy linguistic quantifier
(Zadeh,1983) representing the proportion of satisfied criteria ‘necessary for a good solution’ (Yager,
1996). This is done by using the linguistic quantifier in the computation of the weights associated with the OWA operator. In addition, Marichal (1998) investigated the aggregation of dependent criteria and the fuzzy integral was found to be the appropriate aggregation operator in these cases. The most representative fuzzy integrals are the Choquet integral and the Sugeno integral. It is well known that the OWA operator is a particular case of Choquet integral, and consequently it is not necessary to assume independence of criteria when using the OWA operator.
Generally speaking, the OWA operator based aggregation process consists of three steps:
element for aggregation is not associated with a particular weight, but rather a weight is associated with a particular ordered position of an aggregated object;
(ii) the second step is to determine the weights for the operator in a proper way;
(iii) finally, the OWA weights are used to aggregate the re-ordered arguments.
Among the three steps, the first step introduces non-linearity into the aggregation process by re-ordering the input arguments, which make Yager’s OWA operator significantly different from the classical linear weighted averaging operator.
Definition 2.1. An OWA operator of dimensionn is a mapping φ:Rn →R, which has a set of
weightsW = (w1,· · · , wn)T associated with it, so thatwi∈[0, 1]and
n P i=1 wi= 1, φW(a1,· · · , an) = n X i=1 wiaσ(i) (2.1)
whereσ is a permutation function such thataσ(i) is the i-th highest value in the set {a1,· · · , an}.
This OWA operator exhibits the following desirable properties for an aggregation operation:
1. It is commutative:
φW pσ(1), . . . , pσ(n)
=φW(p1, . . . , pn),
beingσany permutation of the set{1, . . . , n}.
2. It is an or-and operator, i.e., it is located between the minimum and the maximum of the arguments to be aggregated: min(ai)≤φW(a1,· · · , an)≤max(ai). 3. It is idempotent: φW(a,· · · , a) =a. 4. It is monotonic: φW(a1,· · ·, an)≥φW(e1,· · · , en), ifai≥ei ∀i.
An issue in the definition of theOWAoperator is how to obtain the associated weighting vector
(Yager, 1988). InYager (1988) we can find two ways to do this. The first approach is to use a
learning mechanism using some sample data; the second approach is to provide some semantics or meaning to the weights. The latter approach enables applications in the area of quantifier guided aggregations (Yager,1983;Pei et al.,2012).
In the process of quantifier guided aggregation, given a collection of n criteria represented as fuzzy subsets of the alternatives X, the OWA operator has been used to implement the concept of fuzzy majority in the aggregation phase by means of afuzzy linguistic quantifier (Zadeh,1983) that indicates the proportion of satisfied criteria ‘necessary for a good solution’ (Yager,1996). This implementation is done by using the quantifier to calculate the OWA weights.
Definition 2.2. A fuzzy subset Q is called a Regular Increasing Monotone (RIM) quantifier if (i)Q(0) = 0; (ii) Q(1) = 1; (iii)Q(x)≥Q(y)ifx > y.
Definition 2.3. A fuzzy subset Q is called a Regular Decreasing Monotone (RDM) quantifier if (i)Q(0) = 1; (ii) Q(1) = 0; (iii)Q(y)≥Q(x)ifx > y.
Definition 2.4. Given a function Q: [0,1] →[0,1] such that Q(0) = 0, Q(1) = 1 and if x > y
thenQ(x)≥Q(y), an OWA aggregation operator guided byQis given as (Yager,1988):
φQ(a1, . . . , an) = n
X
i=1
wi·aσ(i),
being σ:{1, . . . , n} → {1, . . . , n} a permutation such that aσ(i) ≥aσ(i+1), ∀i= 1, . . . , n−1, i.e., aσ(i) is thei-th largest value in the set {a1, . . . , an}; and
wi =Q i n −Q i−1 n , i= 1, . . . , n. (2.2)
These Q functions are called Basic Unit-interval Monotone (BUM) functions in Yager (2003) and ‘are particularly useful in situations in which the imperative guiding the OWA aggregation is expressed linguistically by a quantifier’. Note that in Yager(1996) BUM functions are called RIM quantifiers.
Examples of RIM quantifiers areall,most,many andat least α, in contrast of RDM quantifiers
like none,few orat mostα(Yager,1996). Example 2.1 defines the quantifiersall andthere exists,
Example 2.1. The quantifier allis represented by the fuzzy subsetQ∗ where
Q∗(1) = 1 andQ∗(x) = 0 for allx6= 1.
The quantifier there exist,not one is represented by the fuzzy subsetQ∗ where
Q∗(0) = 0 andQ∗(x) = 1 for allx6= 0.
Consider the parameterised fuzzy subset defined [0, . . . ,1] such that
Q(r) =rα, α≥0. (2.3)
It can be seen that this formulation defines a family of RIM quantifiers. The special cases of this family are worth noting:
• Forα= 1 we getQ(r) =r. This is called theunitor quantifier.
• Forα→ ∞we getQ∗, the universal quantifier. • Forα→0 we get Q∗, the existential quantifier.
• For 0< α <1 we get a concave function.
• Forα >1 we get a convex function.
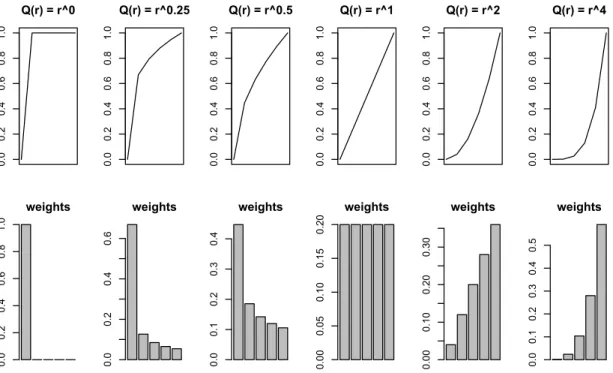
Figure 2.1 depicts some examples of RIM functions ofQ(r) =rα family on the top, and their corresponding vector of weights in the bottom. The first subgraph (α= 0) represents the previously named all quantifier, in which only the higher value do not have a null weight. Second and third subgraphs correspond toαlower than 1. The concave property of Qprovides decreasing weights. Fourth subgraph (α = 1) stands for the unitor quantifier, obtaining equally-valued weights and therefore representing the mean operator. Finally, fifth and sixth subgraphs depict functions with αgreater than 1, obtaining convex functions and therefore increasing weights.
Example 2.2 illustrates the use of RIM quantifiers to aggregate a set of values.
Example 2.2. The aggregation of the set of values {0.5,0.07,0.228,0.057,0.482} using an OWA
operator guided by the fuzzy linguistic quantifier ‘most of ’ represented via the RIM functionQ(r) =
r1/2, whose corresponding weighting vector using (2.2) is
(0.447,0.185,0.142,0.120,0.106), yields
φmost of(0.5,0.07,0.228,0.057,0.482) = 0.447·0.5 + 0.185·0.482 + 0.142·0.228 + 0.129·0.07 + 0.106·0.057
= 0.360.
0.0 0.2 0.4 0.6 0.8 1.0 Q(r) = r^0 weights 0.0 0.2 0.4 0.6 0.8 1.0 0.0 0.2 0.4 0.6 0.8 1.0 Q(r) = r^0.25 weights 0.0 0.2 0.4 0.6 0.0 0.2 0.4 0.6 0.8 1.0 Q(r) = r^0.5 weights 0.0 0.1 0.2 0.3 0.4 0.0 0.2 0.4 0.6 0.8 1.0 Q(r) = r^1 weights 0.00 0.05 0.10 0.15 0.20 0.0 0.2 0.4 0.6 0.8 1.0 Q(r) = r^2 weights 0.00 0.10 0.20 0.30 0.0 0.2 0.4 0.6 0.8 1.0 Q(r) = r^4 weights 0.0 0.1 0.2 0.3 0.4 0.5
Figure 2.1: Some RIM functions and their corresponding obtained weights
This type of aggregation ‘is very strongly dependent upon the weighting vector used’ (Yager,
1996), and consequently upon the function expression used to represent the fuzzy linguistic quan-tifier. The RIM function used in this work (with an α between 0 and 1) guarantees that all the individual valuations contribute to the final aggregated value because it is a strictly increasing function. Moreover, the higher the ranking of a value, the higher the weighting value associated with it. This is a consequence of the concavity property – which was proven in Chiclana et al.
(2007) to make a RIM function appropriate for conducting aggregation processes in heterogeneous decision-making problems.
2.3
Data-to-text systems for generating natural language
A growing number of applications require the translation of perceptual, sensory or statistical data into natural language descriptions, therefore increasing the interest in the research of data-to-text systems (Reiter,2007). These systems summarise qualitative or numeric data into natural language
texts with the motivation of the belief that textual summaries made large amount of numeric data more accessible to human users than traditional ways of presenting data (H¨uske-Kraus, 2003b;
Reiter et al., 2005). Such systems present not only a practical interest –most of natural language
generation (NLG) systems are considered to be data-to-text systems– but also a scientific interest in the study of the relation between language and non-linguistic world.
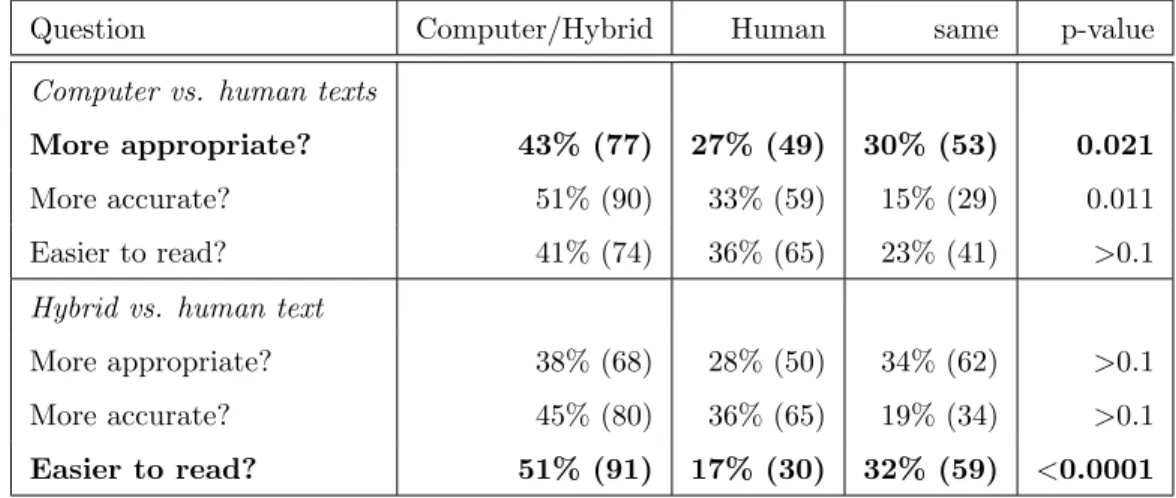
The most frequent area of application of such systems and the one in which their utility has been proved is theweather forecastingdomain. Several systems have been designed to produce textual weather forecast from weather data. One of the earliest works in such area and a classical one is FoG (Goldberg et al.,1994), which converts weather maps info forecast text by using rules, NLG and linguistic models. It is based on an three-stages architecture: data extraction, concep-tual (metereological) processing and linguistic processing, which involves both text planning and text realisation. More recently,SumTime-Mousam (Sripada et al., 2003) produces textual marine weather forecasts for offshore oilrig applications. Its input data are mainly time series. It points out the importance of the sensitivity of the text to the end user, and the configurability of the system by the forecasters to easily adjust the output. It uses a three-stages architecture: document planning, micro-planning and realisation, and it shows the big potential of these technologies. This potential has been evaluated inReiter et al.(2005), where it is concluded that people prefers the computer-generated texts rather than the human-computer-generated ones, mainly due to the best consistency of the automatic texts, as shown in Table 2.3.
There have been also lots of data-to-text systems applied in themedicinearea mainly because of the large amount of data that human systems have to deal with. InH¨uske-Kraus(2003b) a review of some of the applications of these systems in the medicine area is provided, also identifying the main functionalities of NLG applications in health care: producing explanations and giving advice in medical expert systems, generating reports, progress notes and discharge letters, preparing individualised patient information material and generating descriptions of medical concepts. These applications generally deal with raw data, in contrast of systems that are based on discrete events. In this sense, Suregen-2 (H¨uske-Kraus, 2003a) helps medical staff in the elaboration of routine reports by improving the specification and use of the predefined medical ontology, whileNarrative
Engine (Harris, 2008), in its commercial version calledComponent-Based Processing, helps in the
creation of summaries during symptoms, tests and prescriptions.
Table 2.3: Preference results in Reiter et al. (2005) where statisticallly significant results are in bold.
Question Computer/Hybrid Human same p-value
Computer vs. human texts
More appropriate? 43% (77) 27% (49) 30% (53) 0.021
More accurate? 51% (90) 33% (59) 15% (29) 0.011 Easier to read? 41% (74) 36% (65) 23% (41) >0.1
Hybrid vs. human text
More appropriate? 38% (68) 28% (50) 34% (62) >0.1 More accurate? 45% (80) 36% (65) 19% (34) >0.1
Easier to read? 51% (91) 17% (30) 32% (59) <0.0001
For example,Stop(Reiter et al.,2003) tries to help people quit smoking by generating short tailored smoking cessation letters based on responses to a questionnaire. Unfortunately, this system was not effective. In the same way of helping patients,Piglit(Cawsey et al.,2000) aids to oncologic patients by elaborating personalised hypertext pages explaining treatments, diseases and measurements related to the patients’ condition. As a hybrid system, helping both medical staff and patients,
BT-45 (Portet et al.,2009) builds automatic summaries from data provided by sensors in the Neonatal
Intensive Care Unit, both physiological signals and discrete events. This work is based on Topaz
(Kahn et al., 1991). An example of a system dealing with data as a list of events is described in
Hallett and Scott(2005), which generates two main types of report. On the one hand, a longitudinal
report provides a quick historical overview of the patient’s illness and, on the other hand, a report focussed on a given type of event in a patient’s history is supplied.
Data-to-text systems have been applied with success in other domains. iGraph (Ferres et al.,
2006) improves theaccessibility of graphical data for the visually-impaired by describing graphs in a simple and repetitive way. This description includes an overview of the axis, maximums and minimums, trends, evolution and so on. In a similar topic, Atlas.txt (Thomas and Sripada,
2008) describes geo-referenced information as text also for the visually-impaired by covering the identification of the location of high and low values and trends detected in the data. Infinancial area, Ana (Kukich, 1983) generates textual stocks reporting from numeric data of stock market,
basing this construction in three principles: the use of domain-specific semantic and linguistic knowledge, the use of macro-level semantic and linguistic constructs and the production system approach to knowledge representation. One of the standing works in the description of visual scenesisVitra(Herzog and Wazinski,1994), where a knowledge-based system is used to translate visual information into natural language descriptions, focussing in simultaneous scene description and image sequence evaluation. In the same area of application,Describer(Roy,2002), uses machine learning techniques for acquire linguistic structures generalised from training data in the form of domain specific rules of language generation, with the objective of describing objects in computer-generated visual scenes. As a partial data-to-text system in such domain, Ladder (Hammond and
Davis, 2005) is a sketching language for describing sketch-based user interface. There have been
also other areas of application likeSports, in whichScubaText (Sripada and Gao,2007) stands out in its helps to scuba divers by making summaries with graphical and textual information oriented to the security of the diving activity.
Most of these systems analyse raw data, typically data gathered from sensors and collected in form of time series. As opposite, PLANDoc (McKeown et al., 1994) builds summaries based on the events outputs generated in simulations trying to avoid repetition of similar information and similar phrasing. This work is not framed in a specific domain. Other example of agenericsystem is focussed on labour force surveys (LFS) (Iordanskaja et al., 1992), where bilingual (english and french) summaries of Canadian statistical data are supplied.
The work presented in this thesis in Chapter 4 describes in a qualitative way the most important characteristics of each cluster of a considered data set. It is a based on the analysis and application of a set of rules in order to avoid repetitive information (as seen in Section 4.2), to merge related information into the same sentence (as explained in Subsection 4.3.1) and to obtain a more natural description of the considered classes (as detailed in Subsection 4.3.2). Some of the reviewed papers describe also rule-based systems. A summary of the use of rules in such systems is provided below.
In Iordanskaja et al. (1992) rules are employed in both text planning and realisation stages;
Kukich (1983) employs rules in the message generator stage, the discourse organiser and the text
generator. In this last stage, for example, rules are used for grouping messages according to a clause-combining grammar; inGoldberg et al.(1994) rules are included in the data extraction stage to adapt the text to the desired type of output, in the linguistic processing stage provided by weather forecasters and for performing the use of the grammar; in Cawsey et al. (2000) rules are
attached to the hierarchy used in the medical knowledge base of the system; the system designed in Roy (2002) differs from the majority because domain-specific rules of language generation are learned from examples produced directly by domain experts. InPortet et al.(2009) expert rules are used to compute the importance of the events collected in the data extraction stage. Also, expert rules helps in finding associations between events while the document planning stage also uses some special-case rules and the microplanning and realisation stages employ rules for matching events against templates. Note that this work is based on the one carried out byKahn et al.(1991), also based on rules. InReiter et al.(2003) rules are used for deciding whether to include some content, whileSripada et al.(2003) employ rules in the micro-planning stage between the different parts of the sentence, according to previous or related sentences; inHallett and Scott(2005) rules are used both in the content selection stage to pick the events to be included in the text, and in the document planning stage to group messages: in Hammond and Davis (2005) the domain shape recognition is performed by a rule-based system while inFerres et al.(2006) rules are used for describing and querying the input graph.
The NLG system proposed in this thesis tries to make up for two main lacks affecting data-to-text systems. On the one hand, most of the reviewed systems are domain dependent. They have been designed to analyse input data with a known structure and to provide a specific natural language text according to the framework in which they are developed. The proposed NLG system is a generic one. It is able to produce generic natural text by only analysing the provided input clustered data set, without needing the definition of any domain knowledge. But it is important to note that the specification of some optional and short domain information enables the system to produce context-based text and therefore a more attractive description of involved classes. On the other hand, all reviewed works are designed to build summaries or descriptions of an specific data set, without differentiating among any existing subsets. The designed system highlights the most important features of each class by comparing them in terms of conditional and joint distributions of modalities of each considered variable on each class.
P ap er System Application area Input data Users Rules Goldb erg et al. (1994) F oG W eather for e casting Time series F orecasters Y es Reiter et al. (2005 ) F orecasting texts Time series F orecasters No Sripada et al. (2003) SumTime-Mousam Time series F orecasters Y es Ca wsey et al. (2000) Piglit Medicine Ev en ts P atien ts Y es Hallett and Scott (2005) Summaries of ev en ts List of ev en ts Medical staff & patien ts Y es Harris (2008) Narr ative Engine : text summaries Ev en ts Medical staff No H ¨usk e-Kraus (2003b) Review of applications Ra w data Medical staff No H ¨usk e-Kraus (2003a) Sur egen-2 : Routine rep orts Medical staff No Kahn et al. (1991) T op az Y es P ortet et al. (2009) BT-45 : Neonatal summaries Ra w data from sensors Medical staff & patien ts Y es Reiter et al. (2003 ) Stop : p ersonalised rep orts Man ual input P atien ts Y es F erres et al. (2006) iGr aph Accessibilit y Graphical data Visually-impaired Y es Thomas and Sripada (2008) A tlas.txt Geo-referenced data Visually-impaired No Kukic h (19 83) A na : textual sto ck mar k et Financial Time series Sto ck mark eters Y es Hammond and Da vis (2005) L adder Image Sk etc hes Y es Herzog and W azinski (1994) Vitru Visual scenes No Ro y (2 002) Describ er Visual scenes Y es Sripada and Gao (2007) Scub aT ext Sp o rts Scuba div ers No Iordansk a ja et al. (1992) Summaries Generic Statistical data Y es McKeo wn et al. (1994) PLANDo c List of ev en ts No Metho d presen ted (2013) Description of groups Generic T abular data Generic Y es T able 2.4: Data-to-text systems
Chapter 3
Fuzzy criteria for selecting
classifications
The use of unsupervised learning systems allows the behaviour of certain phenomena to be iden-tified without relying on expert knowledge or information from past situations. Indeed, the main characteristic of this type of learning systems is that they work with patterns without explicitly knowing their output. Because of this, unsupervised learning systems have been considered in the literature as systems capable to capture knowledge from complex structures (Duda et al., 2001;
Figueiredo and Jain,2002;Jain,2010).
Choosing the most appropriate classification from a given set of classifications of a set of patterns is an important topic on unsupervised systems and, in particular, on clustering analysis. In most cases, the use of these unsupervised techniques leads to several classifications as outputs, i.e. various classifications are compatible with the set of given patterns. For this reason, research in this area aims to develop suitable tools and models for selecting classifications (Broder et al., 2008;Kukar,
2003;Osei-Bryson, 2010).
This chapter presents a set of fuzzy criteria to be integrated into a classification selection method-ology. Each fuzzy criterion is modelled via a membership function measuring the degree up to which it is is verified by all considered classifications. With that aim, an index associated with each cri-terion is designed. This chapter analyses and demonstrates properties and usability of each fuzzy criterion.
The proposed criteria cover most of the concepts historically used to assess classifications, as the ones introduced in Section 2.1. Internal criteria like assessing the achievement of desired goals in terms of obtaining a classification with a useful number of classes or a proper distribution of the considered individuals along the classes are included. Also internal criteria quantifying compactness and separability of the classes, and the potential accuracy of the models associated with the classifications are considered in this chapter. External criteria are also covered in this chapter, by defining an index that evaluates the compatibility or dependency between each classification and an external variable provided by the experts.
In order to select the most suitable classification, all the defined criteria must be taken into account. Previous research use selection criteria as filters: they are applied sequentially to the considered classifications (Choi et al., 2005; Osei-Bryson, 2010; S´anchez-Hern´andez et al., 2007;
S´anchez Almeida et al.,2010). All those failing to meet a particular criterion are discarded and not
taken into account in the application of the subsequent criterion. The following drawback can be associated with this type of methodology: because a true-false decision is applied in the application of each of the criterion, this could result in classifications being discarded and not taken into account when they marginally fail to meet one particular criterion but meet other criteria wi