REAL-TIME PROBABILISTIC REASONING SYSTEM USING LAMBDA
ARCHITECTURE
by
ARINZE ANIKWUE
Thesis submitted in fulfilment of the requirements for the degree
Master of Technology: Information Technology
in the Faculty of Informatics and Design
at the Cape Peninsula University of Technology
Supervisor: Dr. Boniface Kabaso
District Six
June 2019
CPUT copyright information
The dissertation/thesis may not be published either in part (in scholarly, scientific or technical journals), or as a whole (as a monograph), unless permission has been obtained from the University
DECLARATION
I, Arinze Anikwue, declare that the contents of this dissertation/thesis represent my own unaided work, and that the thesis has not previously been submitted for academic examination towards any qualification. Furthermore, it represents my own opinions and not necessarily those of the Cape Peninsula University of Technology.
March 19, 2020.
ABSTRACT
The proliferation of data from sources like social media, and sensor devices has become overwhelming for traditional data storage and analysis technologies to handle. This has prompted a radical improvement in data management techniques, tools and technologies to meet the increasing demand for effective collection, storage and curation of large data set. Most of the technologies are open-source.
Big data is usually described as very large dataset. However, a major feature of big data is its velocity. Data flow in as continuous stream and require to be actioned in real-time to enable meaningful, relevant value. Although there is an explosion of technologies to handle big data, they are usually targeted at processing large dataset (historic) and real-time big data independently. Thus, the need for a unified framework to handle high volume dataset and real-time big data. This resulted in the development of models such as the Lambda architecture.
Effective decision-making requires processing of historic data as well as real-time data. Some decision-making involves complex processes, depending on the likelihood of events. To handle uncertainty, probabilistic systems were designed. Probabilistic systems use probabilistic models developed with probability theories such as hidden Markov models with inference algorithms to process data and produce probabilistic scores. However, development of these models requires extensive knowledge of statistics and machine learning, making it an uphill task to model real-life circumstances. A new research area called probabilistic programming has been introduced to alleviate this bottleneck.
This research proposes the combination of modern open-source big data technologies with probabilistic programming and Lambda architecture on easy-to-get hardware to develop a highly fault-tolerant, and scalable processing tool to process both historic and real-time big data in real-time; a common solution. This system will empower decision makers with the capacity to make better informed resolutions especially in the face of uncertainty.
The outcome of this research will be a technology product, built and assessed using experimental evaluation methods. This research will utilize the Design Science Research (DSR) methodology as it describes guidelines for the effective and rigorous construction and evaluation of an artefact.
Probabilistic programming in the big data domain is still at its infancy, however, the developed artefact demonstrated an important potential of probabilistic programming combined with Lambda architecture in the processing of big data.
Keywords: Big Data, big data processing, probabilistic reasoning, probabilistic programming, Lambda architecture.
ACKNOWLEDGEMENTS
I wish to thank:
▪ Yahweh, the source of all.
▪ Mr. Isaac Anikwue, my dad & Mrs. Miriam Anikwue, my mum for everything. ▪ My siblings for their continuous help, encouragement and love.
▪ Dr. Boniface Kabaso for his guidance and support.
▪ Prof. Israel & Ada Jideani for their encouragement and help. ▪ Colleagues and friends for their insight and support.
▪ The department of Information Technology, Cape Peninsula University of Technology for the platform and support.
DEDICATION
PUBLICATIONS FROM THIS RESEARCH
• Anikwue, A. & Kabaso, B. 2019. Probabilistic Programming and Big Data. In 2019 International Conference on Advances in Big Data, Computing and Data Communication Systems (icABCD). IEEE.
• Anikwue, A. & Kabaso, B. 2018. A systematic review of Lambda Architecture based big data solutions. In 2018 Conference on Information Communications Technology and Society (ICTAS).
GLOSSARY
Terms/Acronyms/Abbreviations Definition/Explanation DSR DSRM EPL FSS GFS HDFS IC OBJ QAC RQ SLR SLRQ VMPDesign Science Research
Design Science Research Methodology English Premiership League
Final Search String Google File System
Hadoop Distributed File System Inclusion/exclusion Criteria Objective
Quality Assessment Criteria Research Question
Systematic Literature Review
Systematic Literature Review Question Variational Message Research
TABLE OF CONTENTS
DECLARATION ... ii
ABSTRACT ... iii
ACKNOWLEDGEMENTS ... v
DEDICATION ... vi
PUBLICATIONS FROM THIS RESEARCH ... vii
GLOSSARY ... viii
TABLE OF CONTENTS ... ix
LIST OF FIGURES ... xiii
LIST OF TABLES ... xiv
CHAPTER ONE: INTRODUCTION ... 1
1.1 Introduction ... 1
1.2 Background and Motivation ... 1
1.3 Research Problem Statement ... 4
1.4 Research Questions ... 4
1.5 Research Aims & Objectives ... 4
1.6 Delineation and Assumption of the Study ... 5
1.7 Research Methodology ... 5
1.8 Organisation of the Thesis ... 6
CHAPTER TWO: THEORY, BACKGROUND AND REVIEW ... 8
2.1 Big Data ... 8
2.1.1 Concept of Big Data ... 8
2.1.2 Definition of Big Data ... 9
2.1.3 Brief History of Big Data ... 11
2.1.4 Big Data Processing ... 12
2.2 Lambda Architecture ... 17
2.3 Probabilistic Reasoning ... 19
2.3.1 Probabilistic Reasoning System ... 20
2.3.2 Probabilistic Programming ... 22
2.4 Probabilistic Programming System and Big Data: A Systematic Review ... 23
2.4.1 Systematic Literature Review (SLR) Questions ... 24
2.4.2 Review Protocol ... 25
2.4.4 Analysis ... 31
2.4.5 Systematic Literature Review Summary ... 33
2.4.6 Systematic Literature Review Limitations ... 33
2.5 Chapter Summary ... 34
CHAPTER THREE: METHODOLOGY ... 35
3.1 Introduction ... 35 3.2 Research Pyramid ... 35 3.2.1 Research Paradigm ... 36 3.2.2 Research Methodology ... 37 3.2.3 Research Methods ... 38 3.2.4 Research Techniques ... 38
3.3 Design Science Research ... 38
3.3.1 Business Needs ... 40
3.3.2 Applicable Knowledge ... 40
3.4 Design Science Research Methodology ... 41
3.4.1 Activity 1 – Identify Problem and Motivate ... 43
3.4.2 Activity 2 – Define Objectives of a Solution ... 43
3.4.3 Activity 3 – Design & Development ... 43
3.4.4 Activity 4 – Demonstration ... 44
3.4.5 Activity 5 – Evaluation ... 44
3.4.6 Activity 6 – Communication ... 44
3.5 Design Science Research Guidelines ... 45
3.5.1 Guideline 1 – Design as an Artefact ... 46
3.5.2 Guideline 2 – Problem Relevance ... 46
3.5.3 Guideline 3 – Design Evaluation ... 46
3.5.4 Guideline 4 – Research Contribution ... 47
3.5.5 Guideline 5 – Research Rigor ... 47
3.5.6 Guideline 6 – Design as a Search Process ... 48
3.5.7 Guideline 7 – Communication of Research ... 48
CHAPTER FOUR: DESIGN OF A REAL-TIME PROBABILISTIC REASONING
SYSTEM USING LAMBDA ARCHITECTURE ... 50
4.1 Introduction ... 50
4.2 Design Objectives/Requirements ... 51
4.3 System Overview ... 52
4.3.1 Components of Real-time Probabilistic Reasoning System using Lambda Architecture ... 54
4.3.2 Real-time Probabilistic Reasoning Process... 56
4.4 Design ... 58
4.4.1 The Feeder ... 58
4.4.2 The Storage ... 58
4.4.3 The Server ... 59
4.5 Chapter Summary ... 61
CHAPTER FIVE: KOGNITOR, AN EXPOSITORY CASE STUDY ... 62
5.1 Introduction ... 62
5.2 Problem Domain ... 63
5.3 Tools and Technologies ... 63
5.3.1 Feeder ... 63 5.3.2 Storage ... 64 5.3.3 Server ... 65 5.4 Testing ... 70 5.4.1 Test System ... 70 5.4.2 Test Results ... 71 5.5 Chapter Summary ... 73
CHAPTER SIX: RESEARCH EVALUATION ... 75
6.1 Introduction ... 75 6.2 Hevner’s DSR Guidelines ... 75 6.2.1 Design as an Artefact ... 75 6.2.2 Problem Relevance ... 75 6.2.3 Design Evaluation ... 76 6.2.4 Contribution ... 76 6.2.5 Research Rigor ... 77
6.2.6 Design as a Search Process ... 77
6.2.7 Communication of Research ... 77
6.3 Chapter Summary ... 78
CHAPTER SEVEN: DISCUSSION & CONCLUSION ... 79
7.1 Introduction ... 79
7.2 Research Findings ... 79
7.2.1 Answers to Research Questions ... 80
7.3 Summary ... 81
7.4 Future Work ... 82
REFERENCES ... 83
APPENDICES ... 96
APPENDIX A: STORAGE ... 96
LIST OF FIGURES
Figure 2.1: Big data processes ... 13
Figure 2.2: Categories of analytics ... 14
Figure 2.3: Data processing paradigm ... 16
Figure 2.4: Lambda architecture layers ... 17
Figure 2.5: Lambda architecture ... 19
Figure 2.6: Mechanism of a probabilistic reasoning system ... 21
Figure 2.7: The abstract inclusion/exclusion evaluation process... 27
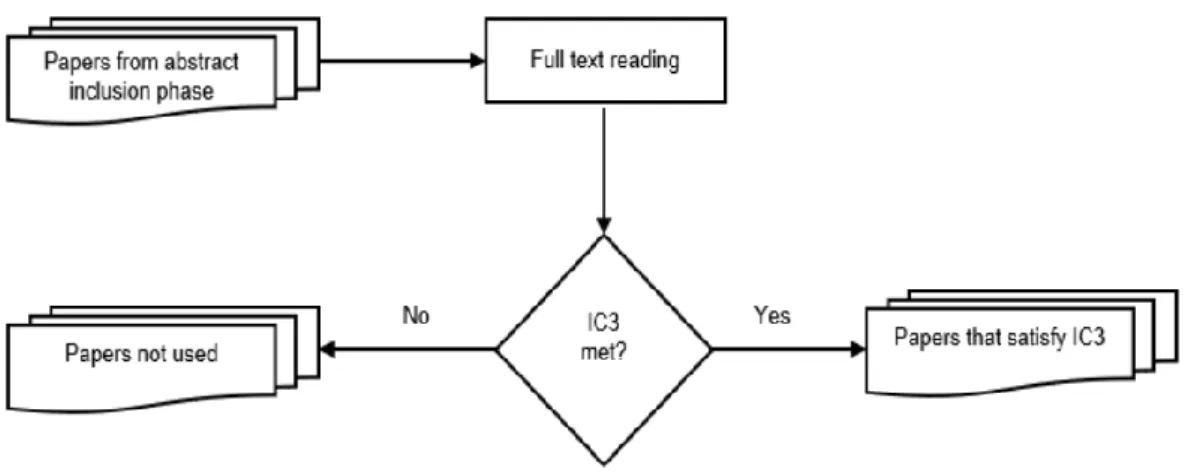
Figure 2.8: The full text inclusion/exclusion evaluation process ... 28
Figure 3.1: Research Pyramid ... 36
Figure 3.2: Information Systems DSR Framework ... 39
Figure 3.3: An adaptation of DSR framework ... 41
Figure 3.4: DSRM Process Model ... 42
Figure 4.1: Reasoning Framework ... 56
LIST OF TABLES
Table 2.1: Sources used in search strategy ... 25
Table 2.2: Search terms ... 26
Table 2.3: Modified search string according to specific library requirement ... 26
Table 2.4: Search string execution result ... 26
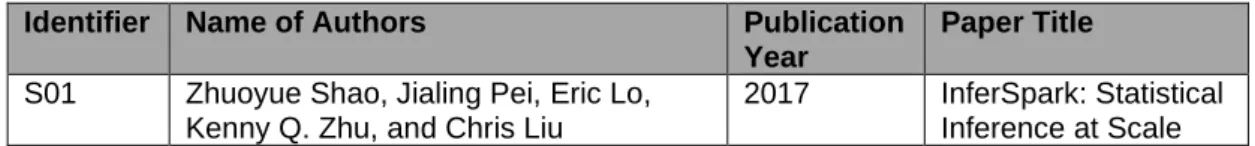
Table 2.5: Selected primary study ... 30
Table 2.6: Quality evaluation of selected primary study ... 30
Table 3.1: Research paradigms with associated methodology and methods ... 37
Table 3.2: DSR Publication Structure ... 45
Table 3.3: DSR Guidelines ... 47
Table 5.1: First Run Learning Time in Seconds ... 72
Table 5.2: Second Run Learning Time (on batch module) in Seconds ... 72
Table 5.3: Third Run Learning Time (on batch module) in Seconds ... 72
CHAPTER ONE
INTRODUCTION
1.1 Introduction
This chapter starts with a description of the research background and motivation for this study in Section 1.2, and then the research problem is listed in Section 1.3. Section 1.5 presents the research questions. The aim and objectives of this research are outlined in Section 1.5 and Section 1.6 discusses delineation and assumptions of this study. The proposed methodology for this research is described in Section 1.7. Section 1.8 ends this chapter with a descriptive structure of the thesis.
1.2 Background and Motivation
Data is a collection of facts or statistics in an unorganized form usually for calculation, analysis and/or planning. Data is limitless and ubiquitous. As McAfee & Brynjolfsson (2012) pointed out, individuals, businesses, institutions and organizations are accumulating and producing massive amount of data than they know what to do with as a by-product of business processes, website tracking, finance, accounting among others. This increasing amount of data generated on a daily basis usually originates from multiple sources like sensors and mobile devices, and in different formats.
Looking at data generated online, Fan & Bifet (2013, p. 1) wrote: “The web pages indexed by Google were around one million in 1998, but quickly reached one billion in 2000 and have already exceeded one trillion in 2008.” This can be credited to social media applications like YouTube, Twitter, Instagram, etc., that allow its users to generate huge amount of data. Most of these data are continuously generated as streams and are volatile. This flood of data is called Big Data and according to Hansen (2013), it represents a significant innovation in data management. Big data simple put is data that is excessively large, very fast and thus, tough for extant traditional data management tools to process (Madden, 2012).
Laney (2001) indicated high volume, velocity and variety, popularly called the 3Vs, as the three attributes that describe big data. This has formed the basis for most interpretations of big data. The cynosure of big data both in academia and industry has been on volume, albeit the significance of other Vs are recognised by many (Mishne et al., 2013).
Volume refers to the increasing size of generated data. Velocity in big data is the capacity to garner information or value in real-time from large volume of continuous
data from different sources. This continuous high volume big data is also called Fast Data and is defined by Baer (2013) as a subset of big data as it encapsulates the velocity characteristics of big data. Variety denotes the dissimilar formats in which data is generated. Data could be in raw, semi-structured and structured formats (Baer, 2013; Katal et al., 2013; Kim et al., 2014; Tyagi et al., 2015; Hashem et al., 2015; Landset et al., 2015).
The classic 3V definition of big data has been extended due to explosion of the social media to include other Vs. An example is veracity. Veracity is concerned with uncertainty in user generated data (Ularu et al., 2012; Jin et al., 2015).
The era of big data brought about the need for drastic revision and improvement in data processing as traditional, relational data management technologies could not fulfil the performance requirements of big data (Gandomi & Haider, 2015). The limitation prompted research from academia, government and industry over the last decade. As a result, technologies are being developed to practically improve big data processing. Most of these technologies are open-sourced. An example is the MapReduce.
MapReduce, initiated by Google, is a programming paradigm for concurrent and distributed processing of big data across multiple servers called clusters or grid with high fault tolerance (Lee et al., 2012). MapReduce fundamentally breaks down a big task into smaller tasks and processes them in parallel. The open-source Apache Hadoop supports the MapReduce paradigm. Hadoop is a highly scalable framework used for processing big data across several machines (Apache Software Foundation, 2016). Apache Hadoop infrastructure comprises two main modules namely Hadoop Distributed File System (HDFS) and MapReduce. The purpose of HDFS is to provide fast and distributed access to data (Fan & Bifet, 2013). According to Ularu, Puican, Apostu, & Velicanu (2012), Hadoop is now the effective standard framework for processing big data.
A notable amount of data is generated as data stream and require immediate processing to extract relevant value in real-time. The importance and benefits of analysing continuous stream of data in real-time cannot be understated (Lorentz, 2013). Organizations need to gain insight from big data so that information such as opportunities, threats and performances are quickly spotted (Russom, 2013). However, the MapReduce paradigm implemented in the majority of big data technologies was designed to handle high throughput with less attention to the
velocity characteristics of big data (Hashem et al., 2015). Liu, Iftikhar, & Xie (2014) also emphasized that Hadoop lacks adequate support for real-time data processing and current algorithms are ineffectual in the analysis of big data. Thus, the need for technologies to handle big data streams. This birthed Distributed Stream Processing Engines – DSPEs (Gedik et al., 2008). DSPEs process continuous volatile high-speed data as it arrives and provides approximate responses using probability. Some examples are Apache Storm and S4 (S. Chen et al., 2014).
There are other technologies that coexist with the MapReduce and streaming model to handle big data processing. It is worthwhile to mention Zookeeper (a server enabling very reliable distributed harmonization), and NoSQL databases (for handling scalability in data storage and distributed data management). These state-of-the-art technologies form the software ecosystem for big data applications and have drastically improved the capturing, storing and analysing of big data. However, these technologies exist independently to solve specific big data problems. The streaming model is unsuitable for static big data, and the MapReduce paradigm is ineffective with fast big data stream.
It is important to note that in order to provide insight and make sense out of big data, artificial intelligence and machine learning are used in the development of applications that empower computers to learn and identify complex patterns and knowledge hidden in data and automatically make intelligent predictions based on the data (Brown et al., 2011; Kraska et al., 2013).
A fundamental research area in machine learning that addresses uncertainty in data is called probabilistic reasoning. Probabilistic reasoning has proven useful in handling the veracity characteristics of big data (Dobre & Xhafa, 2014; Ghahramani, 2015). There are automated applications that use probabilistic reasoning to process data. These applications are known as Probabilistic Reasoning Systems (Zadeh, 2003).
Probabilistic reasoning systems use a probabilistic model and inference algorithm to perform computation on data. A probabilistic model is developed using Bayesian or Markov networks. This is usually a difficult task and requires extensive knowledge in these networks (Dobre & Xhafa, 2014). Again modelling real-life scenario as a probabilistic model is complex as a result of the difficulty (Sampson, 2015; Roy, 2018). This led to the concept of Probabilistic Programming.
Probabilistic programming makes it easier to develop complex probabilistic models using the powerful features of a programming language in probabilistic modelling.
1.3 Research Problem Statement
The current software ecosystem of big data technologies is appropriate for processing huge amount of both historic and real-time data independently, providing distributed processing across several servers. On one hand, the parallel and distributed batch computing is suitable for processing large volume of historic data. On the other hand, distributed stream processing frameworks tackle processing of big data streams. Again, data from diverse sources includes inconsistences and is often incomplete, thus introducing data uncertainty. Nevertheless, decision makers most often require analysis of real-time events (fast data stream) based on specific relevant history or experience (static big data) using probabilistic reasoning to enhance apt decision and meaningful action especially in times of uncertainty. Thus, a fully automated real-time probabilistic reasoning system to process both static and fast big data is imperative (Asrtikis et al., 2012; Fan & Bifet, 2013; Jagadish et al., 2014; Twardowski & Ryzko, 2014; Tyagi et al., 2015; Bhadani & Jothimani, 2016; Qiu et al., 2016).
1.4 Research Questions
Following the research problem statement, the principal research questions (RQs) are stated as follows:
RQ 1: What are the existing real-time big data solutions developed using probabilistic programming?
RQ 2: How can low latency be achieved when processing big data (both historic and real-time) using current open-source big data processing technologies and techniques in a cost-effective way?
1.5 Research Aims & Objectives
The sections on background and research problem presented above results in the primary aim of this study. The research aim is in two-fold and is summarized as follows:
Goal 1: Find existing real-time probabilistic reasoning systems implemented using probabilistic programming that process both historic and real-time big data.
Goal 2: Develop a probabilistic reasoning big data technology using probabilistic programming to process historic and real-time big data at the same time in a cost-effective and timely manner.
To achieve this aim, a list of objectives (OBJs) is outlined as follows:
OBJ 1: Perform a review of literature to identify existing real-time probabilistic big data solutions developed using probabilistic programming.
OBJ 2: Based on the result of objective 1, design a cost-effective probabilistic reasoning system that processes both historic and real-time big data using probabilistic programming.
OBJ 3: Achieve real-time response when processing both historic and real-time big data through the effective combination of current open-source big data processing tools and technologies.
It is crucial to understand each of the objectives outlined above as they contribute to the overall actualization of the research goals.
1.6 Delineation and Assumption of the Study
This research seeks to design a system for real-time big data processing and analysing using open-source big data technologies, machine learning algorithms and commodity hardware. Thus, attempting to provide decision makers with a probabilistic score or response that will assist in the process of decision-making especially in uncertain circumstances. Furthermore, due to the design characteristics of this research, this study will show a practical example on how DSR methodology is used in information technology research.
This is a technical research with very little or no fieldwork, thus there are assumptions on deployment and implementation environment. This study also assumes the availability of basic big data hardware infrastructure.
1.7 Research Methodology
One of the principal goals of this research is to develop a scalable software library that will efficiently process big data and produce a probabilistic score in real-time. In order words, this research will produce an artefact. Thus, this study will use a pragmatic approach based on design research paradigm as supported by Simon (1997).
The pragmatic approach gives researchers the flexibility to use any method or strategy corresponding to quantitative and/or qualitative research that best tackles the research problem. This provides a rich context to the study based on the complementary advantages of the pragmatic approach (Williams, 2007; Creswell, 2007; Tashakkori & Teddlie, 2010; Creswell, 2013).
Design science is considered a set of procedures used for research in technical fields such as computer science, architecture, information technology and engineering (Weber, 2010). Design science research (DSR) is technology-oriented and ventures into invention of artefacts that benefits human purposes. Hevner, March, Park, & Ram (2004) defined design as a series of actions or processes that results in a novel artefact or product. There are four potential outputs namely constructs, models, methods and instantiation, and two processes: build and evaluate in design science (March & Smith, 1995; Peffers et al., 2007).
Hevner et al. (2004) provided a framework for design science comprising environment (people, organisation and technology), knowledge base (theoretical foundations and methodology), and the specific research. These three elements are influenced by relevance and rigor. People, businesses and technologies form the problem space and present specific business needs that make the research applicable.
Furthermore, A. Hevner & Chatterjee (2010) and A. R. Hevner et al. (2004) proposed seven guidelines in design science research as follows:
1. Design as an artefact. 2. Problem relevance. 3. Design evaluation. 4. Research contribution. 5. Research rigor.
6. Design as a search process. 7. Communication of research.
These seven principles describe the process of conducting and evaluating research process in design science. In addition to the guidelines, Peffers et al. (2007) proposed a methodology applicable to design science research. This study will use the methodology described by Peffers et al.,(2007).
1.8 Organisation of the Thesis
Work done during this research is arranged and reported in seven chapters as explained below.
In the first chapter, a brief introduction expounding the context of the study is presented. The background to this study, the research problem, as well as the aims and objectives of this research are all contained in Chapter one. Furthermore, the research questions and scope of this study were also presented.
The second chapter presents background knowledge and theories associated with this research. It started with a brief introduction into the concept, history, definition and processing paradigms of big data. Chapter 2 also presents discussions around Lambda architecture, probabilistic reasoning, probabilistic reasoning systems and probabilistic programming. Chapter 2 ends with a systematic literature review highlighting the applicability of this research.
Chapter 3 is a discussion on design science research as the chosen research methodology for this study. The chapter begins with a brief explanation of research, research methodology and techniques then highlight the relevant methodology suitable for this research with backing reasons. According to the nature of this research, the design science research methodology was selected as a research methodology for this research.
In chapter 4, findings gathered from background knowledge, theories and the systematic literature review presented in chapter 2 were used to present the design concept of this research. The design concept was constructed in line with the design science research methodology discussed in chapter 3. The foremost contribution of the design concept is highlighted in chapter 4.
The fifth chapter presents a demonstration and assessment of the design concept described in chapter 4. The usefulness of the design presented in chapter 4 was demonstrated through the selection of a problem domain, then the development of a case study. The tools and technologies used in the development were described. Finally, chapter 5 presents the evaluation of the developed artefact in a simulated environment using real data.
Chapter 6 contains an evaluation of the research activities used in the advancement of the design concept presented in chapter 4. Each step of the research is measured against the documented authority to verify the validity of this research project as a design science research project.
The last chapter, chapter 7 presents a summary of each chapter, then revisits the aims and objectives of the research to present research findings and answers to the research questions listed in chapter 1. A summary of the research work is presented in chapter 7. Chapter 7 ends with the shortcomings of this study and potential subsequent research directions.
CHAPTER TWO
THEORY, BACKGROUND AND REVIEW
This chapter presents and reviews subjects that form the background theory for this thesis. This helps readers that are not familiar with the topics around this research to have an idea of what is necessary to comprehend the work presented in the later chapters of this thesis.
The first topic presented is discussions around big data in Section 2.1, and then Lambda architecture is explored in Section 2.2. Section 2.3 presents a brief description of probabilistic reasoning and systems that use the concepts as well as the emerging probabilistic programming idea. A systematic literature review focusing on probabilistic reasoning using probabilistic programming and big data is presented in Section 2.4. Finally, Section 2.5 summarizes this chapter.
2.1 Big Data
What is big data? First let us have a look at the definition of ‘big’. Merriam-Webster and the Cambridge online dictionaries define the adjective ‘big’ as large in size, number or amount (Merriam-Webster, 2016; Cambridge Dictionary, 2016). Consequently, the initial and sometimes greater part of what many think or assert as the exact meaning of big data is towards size (Gandomi & Haider, 2015). However, if we talk about the amount, number or size of data exclusively, this gives an opinion that data has always been small until recently. This clearly is a misrepresentation. Early mass storage systems have been around to handle large data sets. An example is the IBM 3850 MSS which was used by scientists to support the 1980 United States census databases – a ‘big’ data at that time (Jacobs, 2009). Databases have been used to collect and store relatively large data sets for over a century. A traditional database housing data of say 500GB in size would not be considered as significantly small today. Thus, how much of data can we refer to as big? Terabytes? Petabytes? Or perhaps Exabytes? How about Yottabytes? Again, do we have to consider the volume of data exclusively to understand or properly define big data? According to Mohanty et al. (2015), this question is yet to be answered, making the expression ‘big data’ a misrepresentation or inappropriate label of the concept and definition of big data (Boyd & Crawford, 2011).
2.1.1 Concept of Big Data
The notion of big data seems to be ambiguous with numerous research papers and articles on big data (Li et al., 2015). It has been publicized in a variation of ways such
as a contemporary variety of economic assets like gold, a marketing expression, a concise description of advancement in data technologies to better understand the world, and an insightful kit to tackle problems like crime and poverty (Lohr, 2012). These days, many people in different academic fields and professions talk about big data, even in boardrooms.
Organizations are saturated with data from burgeoning sources like clickstream, video data, sensors, etc. These data are generated by people, about people, things and how they interact and according to Davenport, Barth, & Bean (2012), organizations that utilize big data will enjoy the new capabilities and value of big data.
The epoch of big data is in progress. In sciences, big data refers to large data set that require super machines, even though there are many typical software running on desktop computers that can now process large data set. Danah Boyd & Crawford (2011) and Dannah Boyd & Crawford (2012) argued that even though the size of data generated today is quite large, volume is not the only fundamental feature of big data. As an example, data on a specific topic from social media such as Twitter is not nearly as large as prior data set not considered as big data. Again, Kitchin & Lauriault (2015) and MIKE 2.0 (2018) supported this fact, stating that not all voluminous data set are big data and some ‘small’ data set can be considered as big data.
Ward & Barker (2013) mentioned data storage and analysis as the two fundamental concepts of big data. Dannah Boyd & Crawford (2012) further asserts the idea of big data as a powerful tool to curb community ills and provide novel perception in divergent areas such as medicine, environmental sciences and terrorism.
2.1.2 Definition of Big Data
Big data is now a predominant term used in many industries and academia to illustrate a broad range of ideas in data science. As noted by De Mauro, Greco, & Grimaldi (2015), there are multiple definitions of big data because of the constant use of the term in different context and its rapid, inconsistent evolution. These definitions of big data are in many instances, divergent thus creating ambiguity in discourse relating to big data – some define big data on what it is, others define big data based on what it does (Gandomi & Haider, 2015).
One of the most common definitions of big data can be linked to a Meta (now Gartner) report by Laney (2001). Laney expressed an increase in the volume of data, variety of data and velocity at which data is acquired or generated. This postulation, popularly nicknamed 3Vs is associated with the concept of big data. Although Laney
made no direct reference to big data in the report, his assertion has been used as a key composition to the definition of big data (Ward & Barker, 2013; Gandomi & Haider, 2015). However, this model had been extended. An example is the addition of value as seen in the definition of big data by IDC in a paper titled Extracting Value from Chaos: “Big data technologies describes a new generation of technologies and architectures, designed to economically extract value from very large volume of a wide variety of data, by enabling high-velocity capture, discovery, and/or analysis.” (Gantz & Reinsel, 2011). More authors have added additional Vs such as veracity (Ularu et al., 2012; Demchenko et al., 2013; Assunção et al., 2015; Jin et al., 2015; Miloslavskaya & Tolstoy, 2016), variability (Fan & Bifet, 2013; Katal et al., 2013; Philip Chen & Zhang, 2014; Tyagi et al., 2015; Miloslavskaya & Tolstoy, 2016), and visibility (Miloslavskaya & Tolstoy, 2016). These definitions of big data outline the characteristics of big data.
Khan et al (2014) explained big data as numerous data generated, captured and processed rapidly, and difficult to classify in the traditional relational databases. In the opinion of Snijder, Matzat, & Reips (2012, p. 1), big data defines huge and complex data set that “become awkward to work with using standard statistical software.”. Similarly, Philip Chen & Zhang (2014) defines big data as an accumulation of enormous and heterogeneous data set thus making it an arduous task for traditional databases to process. These definitions of big data fall under the category of definitions that compare software tools for big data.
Data analytics is also relevant when defining big data. Dannah Boyd & Crawford (2012, p. 665) outlined “computational turn in thoughts and research” as well as tools and procedures used in the processing of big data. This class of definition highlights the influence of big data on society. The National Institute of Standards and Technology (NIST) defined big data, pointing out the architectural aspect of big data (NIST, 2018). Similarly, Oracle (Dijcks, 2012) defined big data with emphasis on infrastructure, thus presenting solutions to big data (Ward & Barker, 2013).
Another category of big data definition highlights the importance of computing power (Microsoft, 2013). This definition also introduced the concept of machine learning and artificial intelligence as related set of technologies that form a significant part of big data.
These existing definitions of big data show that the focus of big data is mainly on its characteristics (the Vs), specialised technologies and analytical methods used to
process big data. Thus, De Mauro et al. (2015, p. 103) proposed a consensual definition of big data: “Big Data represents the Information assets characterised by such High Volume, Velocity, and Variety to require specific Technology and Analytical Methods for its transformation into Value.”
2.1.3 Brief History of Big Data
Some believe big data is new and different from what has been. However, Barnes (2013) stated that big data did not start with Google or Apple but has been around. Big data is a combination of different elements, each with its own history, merging at our current moment. As mentioned in Section 2.2.1, data storage and analysis are two primary concepts linked with big data. These ideas are not new and predates the present trend. Investigations on the advancement of big data indicate that research into big data started in the 1970s (Ularu et al., 2012). However, Tyagi et al. (2015) claims that big data emerged for the first time in 1998 in a book titled Big Data and the NextWave of InfraStress by John Mashey and subsequently, the first academic paper on big data was in 2000 by Diebold. In 2012, the government of the United States of America publicized a national policy titled Big Data Research and Development Initiative to support education, collaboration and research into big data.
The history of big data is generally connected with the evolution of efficient storage and data management systems with respect to data size. Han Hu, Yonggang Wen, Tat-Seng Chua, & Xuelong Li (2014) divided the history of big data into four stages with respect to data volume. The first stage is the Megabyte to Gigabyte stage.
Megabyte to Gigabyte stage occurred between the late 1970s and early 1980s where the need to store data and perform analysis and reporting became apparent. This resulted in the database machine concept which involves specialized hardware and software integration to accumulate and examine data. Digital technology became more publicized in the late 1980s causing the volume of data to increase to terabytes. Database machines became insufficient to effectively store and manage data. This led to the Gigabyte to Terabyte stage where the “share-nothing” idea was suggested.
The share-nothing framework is made up of a group of database systems running on a networked cluster (DeWitt & Gray, 1992), each with its separate memory, processor and disk. According to Borkar et al. (2012) and M. Chen et al. (2014), Teradata Corporation developed the first commercialised database system based on the share-nothing architecture. Parallel database systems improved data storage and processing performance and thus the idea was welcomed. However, during the late
1990s, a boost in the use of Internet increased the size of data to petabytes and introduced unstructured or semi-structured data. Parallel databases could not effectively handle unstructured data even though they were suitable for structured data. Thus, internet companies like Yahoo and Google were faced with the challenge of indexing and querying the rapidly growing content of the web created by users. This was the Terabyte to Petabyte stage.
To tackle this challenge, Google developed the Google File System (GFS) to collect large data set, and a programming model called MapReduce that handles the processing of large data set (Dean & Ghemawat, 2008). GFS is a reliable, fault-tolerant and scalable distributed file system that runs on thousands of commodity hardware (Ghemawat et al., 2003). Yahoo and Facebook created the open-source version of MapReduce and GFS called Hadoop and Hadoop Distributed File System (HDFS) (Borkar et al., 2012). The multiplication of data sources such as sensors and mobile devices in the mid-2000s resulted in a deluge of data in different formats such as audio, video, files and images, mostly referred to as semi-structured and unstructured data. This required a new paradigm to effectively manage and process large-scale semi-structured and unstructured data. Thus, the NoSQL databases were revealed. Again, giant technology companies like Amazon and Google implemented their versions of NoSQL called Dynamo and Big Table respectively (Borkar et al., 2012).
The fourth stage in the history of big data is called the Petabyte to Exabyte stage. Data sources have continued to increase since year 2000. Han Hu et al. (2014) predicted that the volume of generated data will continue to multiply, stating that no technology has been developed to handle larger data set. However, current technologies can handle terabyte to petabyte of data.
2.1.4 Big Data Processing
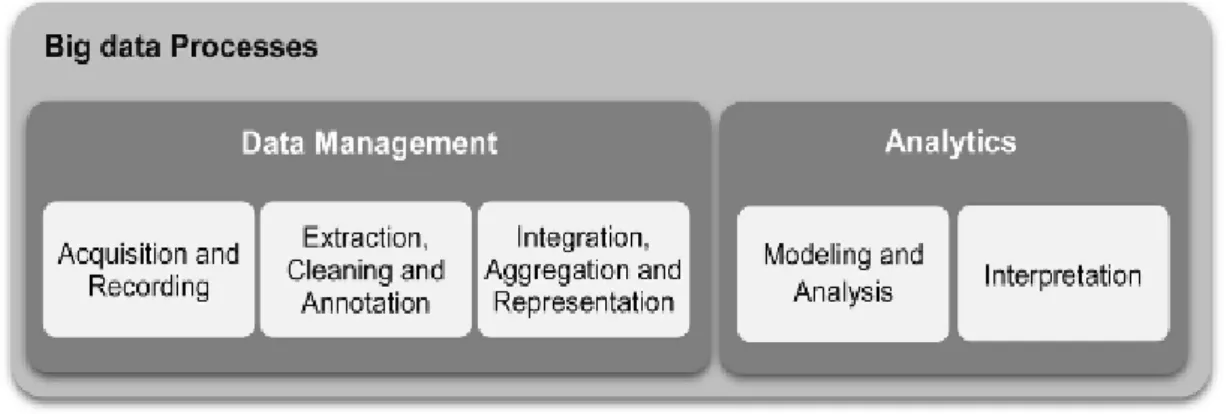
Big data require techniques and tools to capture, organize and analyse it to derive meaningful value. According to Philip Chen & Zhang (2014), these tools and techniques are developed using a combination of knowledge from different specialties like Mathematics, Computer Science and Statistics. Labrinidis & Jagadish (2012) explained five steps involved in the process of mining value from big data. These steps are further categorized under two main processes – data management and analytics, as shown in Figure 2.1.
Figure 2.1: Big data processes
(Gandomi & Haider, 2015: 141)
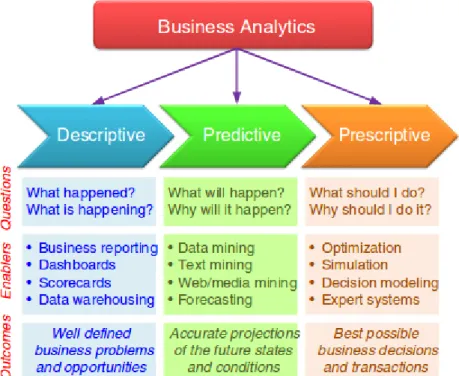
Data management is concerned with the tools, processes and technology used to gather, store and prepare data for the analysis phase (Chen et al., 2013). In the analysis stage, analysis algorithms are used to examine the data. This process is referred to as big data analytics. According to Assunção et al. (2015) and Delen & Demirkan (2013), big data analytics tools are grouped as descriptive, predictive and prescriptive (see Figure 2.2). Descriptive analytical tools discover patterns from historical data by modelling past actions (Fitz-enz, 2009). Predictive analytics uses statistical models and machine learning algorithms on both past (historic) and current data to attempt to forecast future trends (Shmueli & Koppius, 2010; Siegel, 2013; Zakir et al., 2015). Prescriptive analysis calculates actions and their corresponding influence on business activities using optimization (Evans & Lindner, 2012; Song et al., 2013).
Contemporary big data analytical tools mainly process big data in batch or stream (Barlow, 2013; Huang & Liu, 2014; Jambi & Anderson, 2017). Early solutions developed to process big data were based on batch processing. Batch processing is used to process very large volume of historic or static data, that is, data that has been collected and stored over time (Adhianto et al., 2010). Most batch processing tools were implemented using the MapReduce framework (Shahrivari, 2014).
The MapReduce framework comprises three components namely a distributed file system, a distributed NoSQL database and a MapReduce engine. The MapReduce engine provides a simple and effective programming model that offers parallel and distributed processing of large data set on clusters of commodity hardware. This programming model is highly scalable and fault-tolerant. MapReduce provides two elementary functions – map and reduce, that allows users to implement computation on big data. The input to the MapReduce engine is a list of key-value pairs. The map
function performs computation on the input to produce a set of zero or more intermediate key-value pairs. Subsequently, all intermediate values corresponding to an intermediate key are grouped and passed to the reduce function. The reduce function iterates through each intermediate key and its associated list of values and performs computation on each to produce results. Each reduce iteration usually produces zero or one output (Dean & Ghemawat, 2008; Dean & Ghemawat, 2010; Lee et al., 2012; Shahrivari, 2014; Bhadani & Jothimani, 2016). Lämmel (2008, p. 1) summarized the map-reduce process in five basic notions as follows: “(i) iteration over the input; (ii) computation of key/value pairs from each piece of input; (iii) grouping of all intermediate values by key; (iv) iteration over the resulting groups; (v) reduction of each group”.
Figure 2.2: Categories of analytics
(Delen & Demirkan, 2013: 361)
Apache foundation developed an open-source implementation of MapReduce framework, called Apache Hadoop, although Hadoop Started in Yahoo! (Bifet, 2013). Hadoop has two core components – HDFS and HBase (Fan et al., 2014). HDFS is a replacement of Google’s GFS while HBase is used instead of BigTable data store. There are other MapReduce implementation such as DISCO, however, according to Lee et al. (2012), Lin, Leu, & Chen (2015) and Xindong Wu et al. (2014) Hadoop is more popular. Hadoop has been extensively used and widely accepted as the standard for big data processing in academia and industry (S. Chen et al., 2014; Liu et al., 2014; Raghupathi & Raghupathi, 2014; Lin et al., 2017; Ramírez-Gallego et al.,
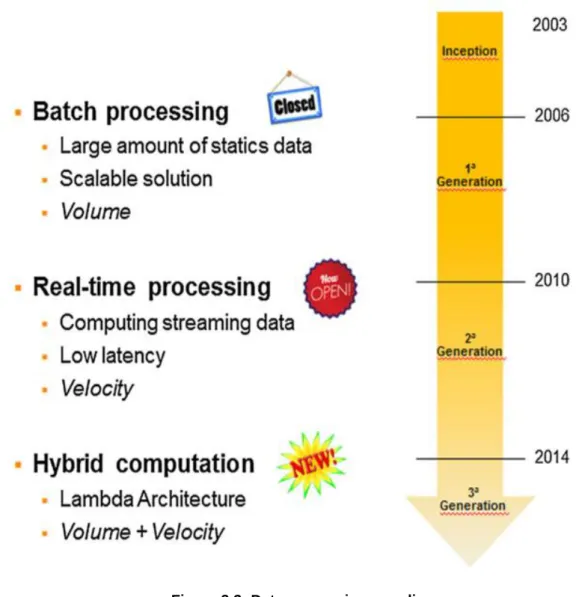
2018). The MapReduce paradigm is considered the first generation big data processing framework (Adhianto et al., 2010; Nair et al., 2017), and according to Adhianto et al. (2010), Hadoop marked the end of the first generation big data processing framework as shown in Figure 2.3.
Hadoop and MapReduce framework presents advantages such as scalability, ease of use, flexibility and fault-tolerance. Despite these advantages, MapReduce and Hadoop have some limitations (Khan et al., 2014; Bhadani & Jothimani, 2016). One of such is the high latency when processing data due to its batch processing nature (Taxidou & Fischer, 2013; Sagiroglu & Sinanc, 2013; Wu et al., 2015; Vakali et al., 2016; Mohapatra et al., 2016; Yang et al., 2017).
The long processing time associated with batch processing became unbearable to end-users. Users usually require response to queries to be in near time or real-time. Few examples can be seen in the case of crisis management, surveillance and the stock market where decisions need to be taken as quickly as possible based on results from processing events (Perera & Suhothayan, 2015). Thus, stream processing on big data became inevitable and birthed the second generation of big data processing frameworks (Adhianto et al., 2010; Gebara et al., 2015; Bajaber et al., 2016; Nair et al., 2017).
Stream (real-time) processing enables scalable computation on big data stream (Hirzel et al., 2017). This handles the velocity characteristics of big data and ensures low latency by processing small chunks of data (Adhianto et al., 2010; Perera & Suhothayan, 2015; Wang et al., 2016). According to Strohbach, Ziekow, Gazis, & Akiva (2015), data velocity means fast flowing data that must be processed in a negligible amount of time. Adhianto et al. (2010) explained that the concept of stream processing is closely related to that of batch processing. In stream processing, batch processing is done on small chunks of data stored in memory instead of a secondary data store. However, instead of one-time queries to stored data as in the case of batch processing, stream processing enables continuous evaluation of queries on new data to produce new responses (Margara et al., 2014).
To tackle the high latency in batch processing of big data, many open-source stream processing platforms were developed. Some examples are Apache Storm (Apache Software Foundation, 2015), Apache Samza (ApacheSamza, 2016), SQLstream (SQLstream, 2017), Apache Spark (Zaharia et al., 2010; Zaharia et al., 2016), Apache S4 (Apache Software Foundation, 2010), Apache Flume (ApacheFlume,
2016) and Apache Kafka (ApacheKafka, 2017). These processing frameworks enable real-time analysis and fast response to facilitate real-time decision making (Xindong Wu et al., 2014).
Figure 2.3: Data processing paradigm
(Adhianto et al., 2010: 2081)
Although stream processing provides low latency, a major pitfall or stream processing framework is that they do not output accurate responses as compared to batch processing platforms (Yang et al., 2017). Thus, using stream processing framework to replace batch processing would be insufficient in handling the problems of big data.
A single tool or technique may not serve as a panacea for all big data problems. The combination of batch and stream processing in one big data platform could suffice. Again, decision makers often need to make decisions based on historic (batch) data and real-time data (Twardowski & Ryzko, 2014; Kiran et al., 2015). Some researchers such as Adhianto et al. (2010), Jambi & Anderson (2017) and Zhou, Simmhan, & Prasanna (2013) endorsed the need to support batch and stream processing in a big
data platform. This structural combination is regarded as the hybrid computation (Miloslavskaya & Tolstoy, 2016) or third generation of big data processing framework (Adhianto et al., 2010). See Figure 2.3.
The need for a hybrid big data platform sparked research and resulted in models such as the Kappa architecture designed by (Kreps, 2014), the Liquid architecture developed by (Fernandez et al., 2015), and Lambda architecture introduced by (Marz & Warren, 2015).
2.2 Lambda Architecture
Marz & Warren (2015) proposed a new model called Lambda Architecture to handle large data set in real-time. This model supports the idea that neither batch nor stream processing alone could handle all big data problems. Thus, instead of a single technology, Lambda architecture explains the combination of different big data tools/technologies to provide a generic solution. According to Marz & Warren (2015), the architecture presents a common model to implement computation on arbitrary data set using arbitrary functions in real-time. Lambda architecture also describes a guideline that assists developers/designers in choosing the right technology to combine, and how to combine them (Twardowski & Ryzko, 2014).
Figure 2.4: Lambda architecture layers
(Adopted from Marz & Warren, 2015)
Astakhov & Chayel (2015, p. 4) defined Lambda architecture as “a data-processing design pattern to handle massive quantities of data and integrate batch and real-time processing within a single framework”. Köhler, Kaniovskyi, & Benkner (2015) also
defined Lambda architecture as a general-purpose blueprint to develop scalable and fault-tolerant big data systems. In the words of Vögler, Schleicher, Inzinger, & Dustdar, (2017, p. 5), Lambda architecture is “a generic, scalable, and robust data processing system, specifically designed to serve massive workloads and a wide range of use cases”. Thus the architecture promises scalability, extensibility, generalization and fault-tolerance (Zheng et al., 2017). Ganchev, Ji, & O’Droma (2016), Jambi & Anderson (2017) and Twardowski & Ryzko (2014) claims that Lambda architecture is widely used in academia and industry.
Lambda architecture proposes a three-layered big data system. As stated by Marz & Warren (2015), each layer handles a specific big data problem and is built on top of the functionality of the layer beneath it as shown in Figure 2.4. Data flows into the architecture and is concurrently added to and processed by the batch and speed layers.
The batch layer represents the core of the Lambda architecture. This layer acts as an immutable append-only data repository of unprocessed data. Here, periodical computational jobs usually implemented using a batch processing framework, processes the raw data (also known as the master data set) and produces batch views which are sent to the serving layer for queries. New data are stored in the batch layer and included in the next batch computation cycle. Results from batch computations are comprehensive and more accurate than those from the speed layer (Harrison, 2014; Hasani et al., 2014; Villari et al., 2014; Astakhov & Chayel, 2015; Tseng et al., 2016; Yang et al., 2017).
Real-time processing happens in the speed layer to balance the long-running batch job in the batch layer. Incoming data into the system is processed immediately in the speed layer. This enables real-time analysis using incremental model to produce up-to-date real-time views. Results from the real-time processing are usually approximations. Thus the real-time views are repeatedly discarded as soon as computation is done on the same data in the batch layer (Hasani et al., 2014; Villari et al., 2014; Kiran et al., 2015; Astakhov & Chayel, 2015; Yang et al., 2017).
The serving layer presents an integration of batch views and real-time views for queries (Yang et al., 2017; Jambi & Anderson, 2017). According to Astakhov & Chayel (2015), Hasani et al. (2014) and G. Liu, Zhu, Saunders, Gao, & Yu (2015), this layer is updated with batch views from the batch layer and enables fast and random access to the batch views when needed.
The combination of the speed and serving layers ensures low latency results that include computations on both batch data and real-time data (Huang & Liu, 2014; Liu et al., 2014; VANHOVE et al., 2016).
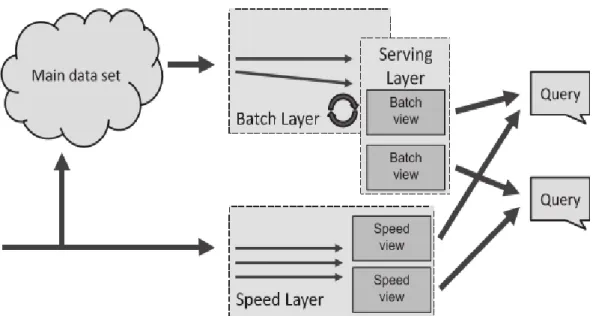
Figure 2.5: Lambda architecture
(VANHOVE et al., 2016: 298)
In summary, Lambda architecture can be mathematically expressed as follows: batch view = function(all data)
real-time view = function(real-time view, new data) query = function(batch view. real-time view)
Figure 2.5 shows a conceptual overview of all the layers of Lambda architecture.
2.3 Probabilistic Reasoning
As a matter of fact, all humans are decision makers. According to Kutty, Kumar Shee, & Pathak (2007), decision-making is the process of identifying and selecting the best option from a range of alternatives. All our actions are because of some decision. Decision-making is usually based on gathered information, values, beliefs and preferences.
In most cases, making decisions are usually straightforward. Some examples are deciding on a time to rest, or a specific food to eat or stopping your vehicle at a stop sign. On the other hand, some decision-making involves complex processes usually based on many sources of evidence (Yang & Shadlen, 2007). This is seen in the case of uncertainty where decisions are made based on the likelihood of unknown or
pending events such as the outcome of a medical diagnosis. According to (Tversky & Kahneman, 1975), answers with respect to the likelihood of events are conveyed in statements that typically starts with phrases such as “Suppose that…”, “In anticipation…”, “It is likely…”, “Usually…”, etc. In other words, these responses are in the form of probabilities (Zadeh, 2003).
The activity associated with decision-making that involves thinking and logical argument is known as reasoning (Merriam-Webster, 2018; Collins Dictionary, 2018). In certain situations, probability is used to express the degree to which an event is possible. Thus, probabilistic reasoning uses logic and probability to make decision-making easier in times of uncertainty.
Probabilistic reasoning also known as uncertain reasoning or probabilistic logic is the combination of probability theory and deductive logic to benefit from formal argument in uncertain situations (Szolovits & Pauker, 1978; Haenni, 2005; Luger & Chakrabarti, 2008; Alon, 2013). In the same manner, Pfeffer, (2016) defined probabilistic reasoning as the union of information/understanding of a particular situation with the laws of probability to discover hidden details that could be important in decision-making.
According to Gonzalez (2012), probabilistic reasoning defines the background of modern statistics and machine learning and is used to model noisy data, interpret complicated situations and express uncertainty.
Today, big data is gathered from different sources with disparate degree of consistency. This introduces errors and incomplete data that must be handled (Jagadish et al., 2014). Probabilistic reasoning or modelling is usually suitable for managing data uncertainty (Adar & Re, 2007; Chen et al., 2013; Wampler, 2013; Bendler et al., 2014; Ghahramani, 2015).
2.3.1 Probabilistic Reasoning System
Decision-making has become a mathematical science (Figueira et al., 2005). This has provided a formal thinking process expressed in mathematical terms to enable transparent and better decision-making (Saaty, 2008). This is also known as Probability Theory (Ghahramani, 2015).
Decision-making processes in many fields such as fraud detection, computer vision, data mining and weather forecasting have been automated. According to Zadeh
(2003), these automated applications use probabilistic reasoning and are referred to as probabilistic reasoning systems.
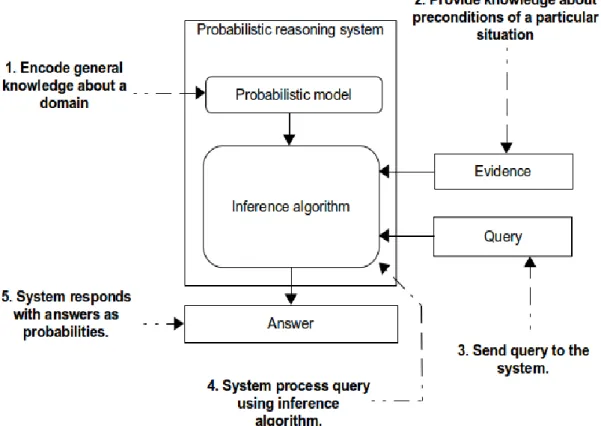
A probabilistic reasoning system comprises two main modules namely Probabilistic model and Inference algorithm (Pfeffer, 2016). See Figure 2.6. The probabilistic model is an encoding of comprehensive knowledge and relevant factors about a specific field in quantitative, probability theories such as Bayesian networks also called belief networks (Liu et al., 2010), hidden Markov models (Rabiner, 1989; Durbin et al., 1998) and stochastic grammar (Manning & Raghavan, 2009; De Raedt & Kersting, 2003; Ábrahám & Havelund, 2016; Williams, 2018).
Figure 2.6: Mechanism of a probabilistic reasoning system
(Adopted from Pfeffer, 2016: 6)
A specific information or fact about a situation in the domain is presented to the probabilistic reasoning system along with a property of the situation that needs to be determined. This fact is known as evidence. The inference algorithm uses the probabilistic model and the given evidence to provide response to queries as probabilistic score. This process is called probabilistic inference. The probabilistic model, evidence and responses to queries are all connected mathematically by the laws of probability (Pfeffer, 2016).
A probabilistic reasoning system can be used to predict future happenings, understand or deduce the cause of an event, learn from previous events to improve prediction and general knowledge of a domain. Just like any other machine learning system, a probabilistic reasoning system will produce accurate prediction based on the size of data (Ghahramani, 2015). Thus, prediction quality of a probabilistic reasoning system depends on how close the probabilistic model represents the real-world situations and the amount of data provided. Some examples of a probabilistic reasoning system are BayesiaLab (Conrady & Jouffe, 2013; Bayesia, 2018) and Netica (Norsys, 2013).
2.3.2 Probabilistic Programming
Probabilistic models in all probabilistic reasoning systems are expressed using representation language. A representation language is used to encode general knowledge of a domain in a probabilistic model. Bayesian networks and hidden Markov models are some examples of representation languages. These representation languages determine or influence the type of probabilistic model a probabilistic reasoning system can manage. The capability of a representation language to encode diverse knowledge in its models is known as the expressive power of the representation language (Pfeffer, 2016).
Designing a probabilistic model involves a combination of mathematical constructs, pseudo codes and natural language. This is usually an arduous task that requires extreme technical expertise (Luger & Chakrabarti, 2008; Dobre & Xhafa, 2014; Zhang et al., 2014). As a result, it is difficult to model many real-life circumstances, and thus expensive (Pfeffer, 2009; Sampson, 2015; Pfeffer, 2016; Roy, 2018). Furthermore, according to Goodman & Stuhlmüller (2014) probabilistic models are now more complicated thus they require new tools to develop and represent them. To fill this representational gap and develop new model representations, the machine learning and programming language communities started work on a research area called probabilistic programming (Hicks, 2014; Sampson, 2015).
The underlying concept of probabilistic programming is centred around the adoption of powerful features of programming languages in probabilistic modelling and inference (Dries et al., 2015). According to Pfeffer (2009, 2016), probabilistic programming provides a much easier procedure to express complex probabilistic models using a programming language. Thus, instead of expressing models in declarative mathematical notations such as Bayesian networks, models are
represented using executable functions or procedures (Ghahramani, 2015). Probabilistic programming enables easier composition of probabilistic models and automatic inference computation on the models to handle uncertainty (Prékopa, 2003; Acharya & Biswal, 2011; Goodman & Stuhlmüller, 2014; Hicks, 2014; Wood et al., 2014; Andrew D. Gordon et al., 2014; Dries et al., 2015; Narayanan et al., 2016; Gehr et al., 2016).
Several probabilistic programming systems or languages has been developed since the conception of research in this area. Some implementations are based on functional programming languages such as Church (Goodman et al., 2008), Anglican (Wood et al., 2014; Tolpin et al., 2016), IBAL (Pfeffer, 2007), and Venture (Mansinghka et al., 2014). BLOG (Milch et al., 2007), PRISM (Sato, 2008), and Markov Logic (Domingos & Richardson, 2007) are examples of probabilistic programming systems based on logic programming. Figaro (Pfeffer, 2009; Pfeffer, 2016) is based on object-oriented and functional programming. Other examples of probabilistic programming systems are BUGS (Lunn et al., 2009), Tabular (Andrew D Gordon et al., 2014), and Stan (Carpenter et al., 2016). According to Pfeffer (2016), these probabilistic programming systems are probabilistic reasoning systems that use programming languages as their representation language.
2.4 Probabilistic Programming System and Big Data: A Systematic Review Probabilistic reasoning is very useful in uncertainty and represents an underlying principle of machine learning. Organizations such as Amazon, Google and Microsoft use probabilistic reasoning to make sense of data resulting in various applications used for predictions, detection, diagnosis and recommendation (Pfeffer, 2016). However, as mentioned in Section 2.3.1, most of the available probabilistic reasoning systems are limited in the set of knowledge they can express in their models. This motivated research into probabilistic programming systems that combines two powerful concepts (probabilistic modelling/reasoning and programming language) to achieve easier representation of complex probabilistic and real-life situations into models.
The concept of probabilistic programming systems is quite new (Goodman & Stuhlmüller, 2014; Sampson, 2015; Pfeffer, 2016). However, researchers such as Lake, Ullman, Tenenbaum, & Gershman (2017), suggests that its potential in artificial intelligence systems is crucial. It is therefore necessary to find out if the concept of probabilistic programming has been used in big data processing. Thus, this section presents a systematic review of big data applications implemented using probabilistic
programming systems. The purpose of this review is to identify available big data solutions that used the concept of probabilistic programming systems in the big data space to handle big data problems. This review follows the guideline as proposed by (Kitchenham & Charters, 2007).
2.4.1 Systematic Literature Review (SLR) Questions
In systematic literature reviews, it is important to clearly specify review question(s) in order to provide the review scope. Kitchenham & Charters (2007) proposed the adoption of the Population, Intervention, Comparison, Outcome, Context (PICOC) criteria used in systematic literature reviews in the field of medicine to help in the formulation of review questions.
Population is concerned with the specific group affected by the research. Kitchenham & Charters (2007) explained that in software engineering, the population could be either a distinct software engineering role, a class of software engineer, an application area or a category of industry. In this review, the population falls under an application area which is big data processing technologies published in literature.
Intervention refers to the software tools that handles the issues in the population. Probabilistic programming system for processing big data is the intervention focus of this study.
Comparison addresses the software procedure used to compare the intervention. Comparison is achieved in this study by comparing the various probabilistic programming systems in the intervention. In this study, the outcome is to discover big data processing platforms that use the advantages of probabilistic programming systems.
Finally, the context describes the circumstances or conditions of the comparison. The context of this review is academia.
The goal of this systematic review is to collect and investigate all possible and effective big data solutions that used probabilistic programming as a reasoning framework to process big data. Accordingly, with reference to the goal and PICOC criteria, the following review questions (SLRQs) were formulated:
SLRQ1 What are the existing big data applications built on probabilistic programming systems to handle big data problems?
SLRQ3 What is the strength of the evidence in support of the different solutions found in RQ1?
SLRQ4 What implication(s) will findings from RQ1 to RQ3 have on this research?
2.4.2 Review Protocol
The purpose of the review protocol is to avoid or prevent a research’s bias that could negatively influence the goals and objectives of the systematic review process. Defining the review protocol is a significant step in the process of a systematic literature review (Kitchenham & Charters, 2007; Okoli & Schabram, 2010). This section specifies the methods used in this systematic review. The review protocol involves describing the search strategy, study selection criteria, quality assessment criteria, data collection, and data synthesis.
2.4.2.1 Search Strategy
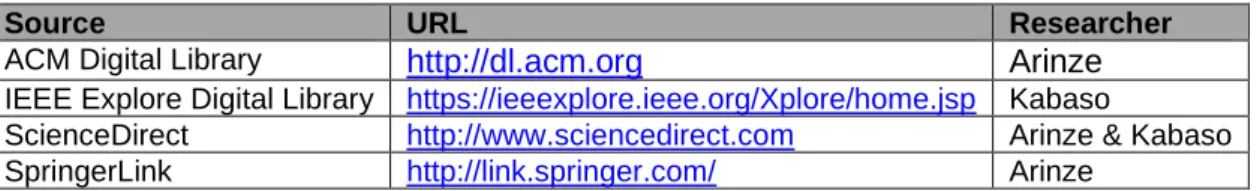
The search strategy was formed by first listing all probable sources that may provide relevant literature to the systematic review. Table 2.1 shows the list of selected digital libraries used. After the selection of digital libraries, a decision on how best to search for relevant studies on the selected digital libraries was specified by identifying search terms or keywords.
Table 2.1: Sources used in search strategy
Source URL Researcher
ACM Digital Library http://dl.acm.org Arinze
IEEE Explore Digital Library https://ieeexplore.ieee.org/Xplore/home.jsp Kabaso
ScienceDirect http://www.sciencedirect.com Arinze & Kabaso
SpringerLink http://link.springer.com/ Arinze
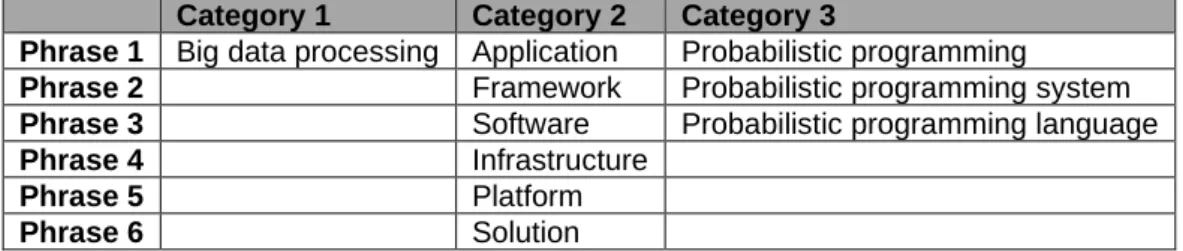
The second step of defining search string(s) was carried out by selecting the most relevant keywords based on the research questions and the research topic. Synonyms and different spellings of keywords were also used to formulate the search string. The selected keywords are as shown in Table 2.2. The search was performed on the digital libraries dating from January 2008 to April 2018. The digital libraries provide search functionalities where keywords or search strings can be entered. They also have the Advanced Search option that allows users to form search strings with conjunctions like AND and/or OR. This search took place between March and April 2018 using the final search string:
Final Search String (FSS): (Big data processing) AND (Application OR Framework OR Software OR Infrastructure OR Platform OR Solution) AND (Probabilistic