Proceedings of ASME Turbo Expo 2019: Turbine Technical Conference and Exposition GT2019 June 17 – 21, 2019, Phoenix, Arizona, USA
GT2019–91432
USING MACHINE LEARNING TO PREDICT CORE SIZES OF HIGH-EFFICIENCY
TURBOFAN ENGINES
Michael T. TongNational Aeronautics and Space Administration John H. Glenn Research Center
Cleveland, Ohio 44135
ABSTRACT
With the rise in big data and analytics, machine learning is transforming many industries. It is being increasingly employed to solve a wide range of complex problems, producing autonomous systems that support human decision-making. For the aircraft engine industry, machine learning of historical and existing engine data could provide insights that help drive for better engine design. This work explored the application of machine learning to engine preliminary design. Engine core-size prediction was chosen for the first study because of its relative simplicity in terms of number of input variables required (only three). Specifically, machine-learning predictive tools were developed for turbofan engine core-size prediction, using publicly available data of two hundred manufactured engines and engines that were studied previously in NASA aeronautics projects. The prediction results of these models show that, by bringing together big data, robust machine-learning algorithms and automation, a machine machine-learning-based predictive model can be an effective tool for turbofan engine core-size prediction. The promising results of this first study paves the way for further exploration of the use of machine learning for aircraft engine preliminary design.
Keywords: machine learning, core size, database, Python
INTRODUCTION
In today’s marketplace, rapid turnaround time of the investigation of new design concepts or technologies can be a powerful competitive advantage within the aircraft engine industry. To minimize risk, technological improvements of aircraft engine are generally made incrementally, drawing heavily from past experiences and lessons learned. Engine companies have generated and collected large amounts of data over the years. The big data, from various sources such as the database of currently manufactured engines and those of previously completed development projects, is a valuable resource of intelligence that can support new engine development. With increasing computational power, employing machine learning to mine these data can provide valuable insights and brings high levels of efficiency to engine preliminary design.
While the use of machine learning for aircraft engine preventive maintenance has been studied by a number of researchers [1 and 2], its use for engine design has not been explored. In this work, supervised machine-learning algorithms were employed to find patterns in the database of two hundred manufactured engines and engines that were studied previously in various NASA aeronautics projects. Models (or analytics tools) to predict core sizes of axial-compressor turbofan engines that are being considered were built. The objective was to determine if machine learning-based predictive analytics could be an effective tool for turbofan engine core-size prediction. To be able to predict engine core size rapidly and accurately in the design space exploration would facilitate engine core architecture selection in the early stages of engine development. In this work, engine core size (h) is defined as:
h = high-pressure compressor last-stage blade height The important aspect of this work was the extensive use of manufactured engine data (70% of the database). These engines span the era from the mid-1960s to mid-2010s. The database captures over half-a-century of engine technology improvements and lessons-learned, which injects realism to the predictive models.
TURBOFAN ENGINE CORE SIZE
The continuous drive for ever more efficient and quiet aircraft has resulted in the evolution of aircraft gas turbine engines from the earliest turbojet engines to today’s turbofan engines with bypass ratios (BPR) of 6 to 12. The overall pressure ratio (OPR)of gas turbines has increased over time to improve thermodynamic efficiency. It is likely that the trend toward higher BPR and OPR engines will continue in the foreseeable future. Despite its benefits, the combination of increasing BPR and OPR will shrink the core size of high-pressure compressor (HPC), which can lead to rapid decrease of HPC efficiency due to increased sensitivity to tip clearance and airfoil manufacturing tolerances. A rule of thumb for the current-state-of-the-art engine design is that the HPC last-stage blade height should not be less than 0.5 inch [3], to avoid this
efficiency penalty. Figure 1 shows the efficiency penalty vs. HPC last-stage blade height of a NASA N+3 technology reference turbofan engine [4].
Figure 1. HPC efficiency change vs. last-stage blade height of a NASA N+3 reference turbofan engine
MACHINE LEARNING ALGORITHMS
Machine learning is a branch of artificial intelligence that uses statistical technique and mathematical algorithms to enable a machine to learn from data, to analyze data patterns, and to make decisions with minimal human intervention. In this work, two machine-learning predictive models were developed for engine core-size classification, i.e. to label engine core size as acceptable, unacceptable, etc.. Three different supervised machine-learning classification algorithms were used in these models. They are: k-nearest neighbors (KNN), support vector machines (SVM), and artificial neural network (ANN). K-Nearest Neighbors (KNN) classifier
KNN algorithm [5, 6] estimates how likely a data point belongs to a certain group based on what group its k nearest neighbors are in, where k is an integer value specified by the user. Each data point is weighted by the inverse of its Euclidean distance from its nearest neighbors. The optimal k is computed iteratively and the k value that give the lowest misclassification errors over the training dataset is selected. A grid-search routine was used to determine the optimal k value. KNN was implemented via the Python Scikit-Learn [7] library class,
KNeighborsClassifier.
Support Vector Machine (SVM) classifier
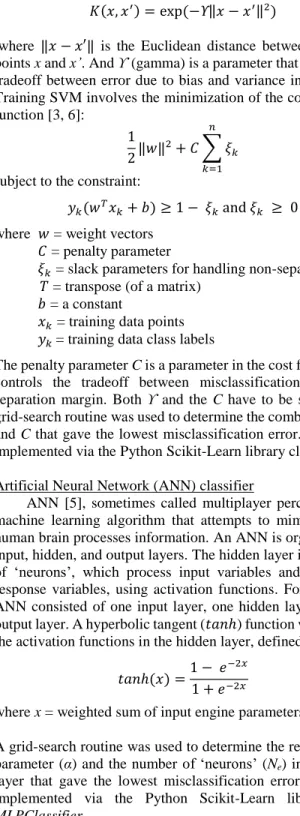
A SVM [5, 8] classifier performs classification by finding an optimal hyperplane that maximizes the margin between the two classes. The hyperplane is a linear separator for any dimension. For nonlinearly-separated classes, a data transformation by a kernel function would be required. Kernel is a mathematical function that performs nonlinear transformation of data so that they can be classified by a linear hyperplane. In this work, a Gaussian (or radial basis function) kernel was used. It is a similarity function that measures the “distance” between a pair of data points and is defined as:
𝐾(𝑥, 𝑥′) = exp(−ϒ‖𝑥 − 𝑥′‖2)
where ‖𝑥 − 𝑥′‖ is the Euclidean distance between two data points x and x’. And ϒ (gamma) is a parameter that controls the tradeoff between error due to bias and variance in the model. Training SVM involves the minimization of the cost (or error) function [3, 6]: 1 2‖𝑤‖ 2+ 𝐶 ∑ 𝜉 𝑘 𝑛 𝑘=1
subject to the constraint:
𝑦𝑘(𝑤𝑇𝑥𝑘+ 𝑏) ≥ 1 − 𝜉𝑘and𝜉𝑘 ≥ 0
where 𝑤 = weight vectors 𝐶 = penalty parameter
𝜉𝑘 = slack parameters for handling non-separable data
𝑇 = transpose (of a matrix) 𝑏 = a constant
𝑥𝑘 = training data points
𝑦𝑘 = training data class labels
The penalty parameter C is a parameter in the cost function that controls the tradeoff between misclassification error and separation margin. Both ϒ and the C have to be specified. A grid-search routine was used to determine the combination of ϒ and C that gave the lowest misclassification error. SVM was implemented via the Python Scikit-Learn library class, SVC. Artificial Neural Network (ANN) classifier
ANN [5], sometimes called multiplayer perception, is a machine learning algorithm that attempts to mimic how the human brain processes information. An ANN is organized into input, hidden, and output layers. The hidden layer is composed of ‘neurons’, which process input variables and output the response variables, using activation functions. For this work, ANN consisted of one input layer, one hidden layer, and one output layer. A hyperbolic tangent (𝑡𝑎𝑛ℎ)function was used for the activation functions in the hidden layer, defined as:
𝑡𝑎𝑛ℎ(𝑥) =1 − 𝑒
−2𝑥
1 + 𝑒−2𝑥
where x = weighted sum of input engine parameters
A grid-search routine was used to determine the regularization parameter (α) and the number of ‘neurons’ (Ne) in the hidden layer that gave the lowest misclassification error. ANN was implemented via the Python Scikit-Learn library class,
MLPClassifier. ENGINE DATABASE
The basic engine architecture in this study was an axial-compressor turbofan. The engine database consisted of 139 manufactured engines [9 to 15] and 61 engines that were studied previously in various NASA aeronautics projects. The NASA engine data were the system-study results for various
NASA aeronautics projects [16 to 22]. The engine database is shown in Appendix A.
PREDICTIVE MODELS
Both 2-class and 3-class models were developed to predict engine core sizes in terms of classes, using the three machine learning algorithms described in the previous section. Core sizes of all the manufactured engines were assumed to be 0.5 inch or larger. For the NASA engines, core sizes were classified according to the blade-height data obtained from the system studies. Python programming language was used to develop both models.
Input engine parameters for both predictive models are: OPR at sea level static condition
BPR at sea level static condition Sea level take-off thrust
The sea-level flight condition was chosen, to be consistent with the engine database (Appendix A). The database was built based on publicly-available engine data.
The output is:
Engine core size class label: 0, 1, or 2
2-class predictive model
This is a binary classification problem in machine learning. For this model, the engine core sizes were categorized into two classes: 0 and 1 (correspond to acceptable and unacceptable
core sizes), according to the engine core size (h), as shown in Table 1.
Table 1 – Categories of the 2-class model
Training and building the predictive models involved three steps: dataset preparation, preliminary training and cross-validation of the models, and building, training, and evaluation of the final model
Dataset preparation
The engine dataset was shuffled randomly (using pseudo-random number generator) and divided into two datasets: the training set and the testing set. The training set was used to train, cross-validate, and build predictive models. The testing set consisted of the remaining engines that were unseen by the predictive models, and was held out for the final evaluation of the predictive models. The training-testing dataset split is depicted in Table 2.
Preliminary training and cross-validation of the models During preliminary training, three predictive 2-class models were developed using KNN, SVM, and ANN algorithms, respectively. This was done to identify the algorithm with the best accuracy for training a classifier to distinguish acceptable
and unacceptable core sizes. The algorithm with the best performance was then selected to build and final-train the predictive model.
Table 2 - Training-Testing dataset split for the 2-class model Core size Training dataset
(no. of engines) Testing dataset (no. of engines) h ≥ 0.5” 116 38 h < 0.5” 34 12 Total 150 50
Within the training dataset (150 engines), a five-fold cross-validation procedure was used to conduct a preliminary evaluation and to fine-tune the models. The training dataset was randomly split into 5 groups: 4 groups were used to train the models and 1 group was used to cross-validate the models. This process was repeated 5 times so that each of the 5 groups got the chance to be used for training and validation. The performance measure was then the average of the values, in terms of the means and standard deviation, computed in the iteration loop.
Building, training, and evaluation of the final model The best algorithm is identified in the previous step was used to build and train the final predictive model. Cross-validation was no longer needed for this step, i.e., all 150 engine data were used to build and train the predictive model. The model was then used to predict the core sizes of the engines in the testing dataset (50 engines), and the results were compared with the testing dataset.
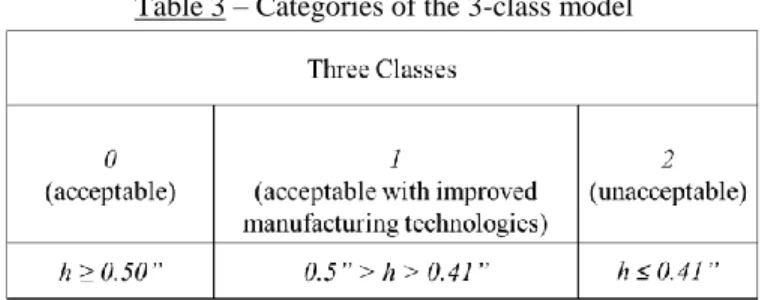
3-class predictive model
In this model, the engine core sizes were categorized into three classes: 0, 1, and 2 (correspond to acceptable, acceptable with improved manufacturing technologies, and unacceptable, core sizes) according to the engine core size (h), as shown in Table 3. The training-testing dataset split is depicted in Table 4.
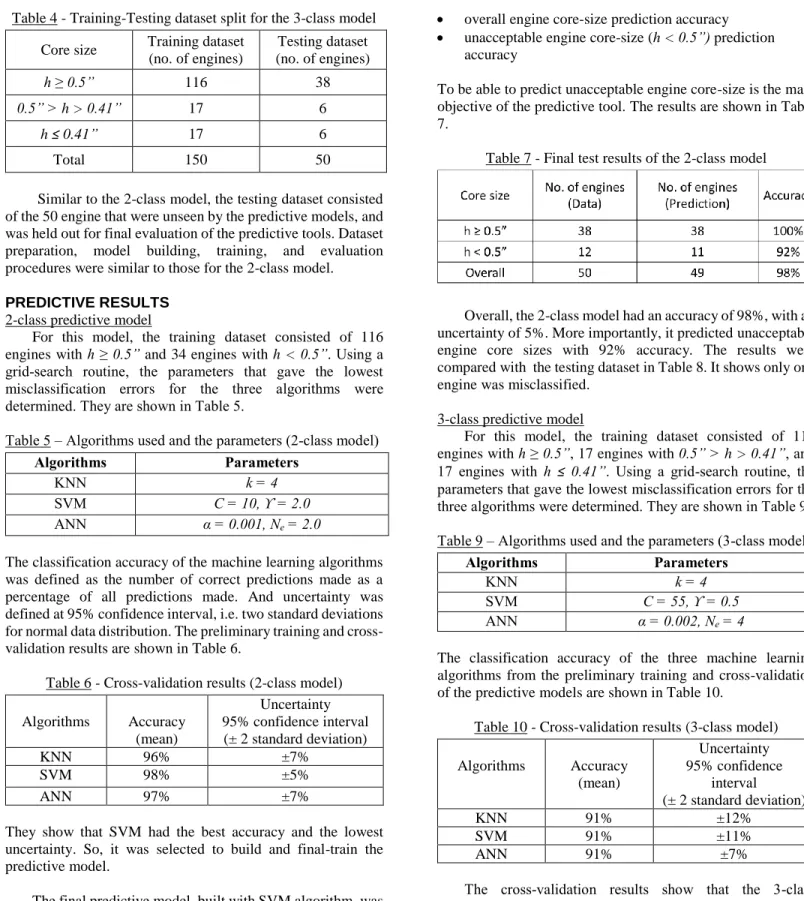
Table 4 - Training-Testing dataset split for the 3-class model Core size Training dataset
(no. of engines) Testing dataset (no. of engines) h ≥ 0.5” 116 38 0.5” > h > 0.41” 17 6 h ≤ 0.41” 17 6 Total 150 50
Similar to the 2-class model, the testing dataset consisted of the 50 engine that were unseen by the predictive models, and was held out for final evaluation of the predictive tools. Dataset preparation, model building, training, and evaluation procedures were similar to those for the 2-class model. PREDICTIVE RESULTS
2-class predictive model
For this model, the training dataset consisted of 116 engines with h ≥ 0.5” and 34 engines with h < 0.5”. Using a
grid-search routine, the parameters that gave the lowest misclassification errors for the three algorithms were determined. They are shown in Table 5.
Table 5 – Algorithms used and the parameters (2-class model)
Algorithms Parameters
KNN k = 4
SVM C = 10, ϒ = 2.0
ANN α = 0.001, Ne = 2.0
The classification accuracy of the machine learning algorithms was defined as the number of correct predictions made as a percentage of all predictions made. And uncertainty was defined at 95% confidence interval, i.e. two standard deviations for normal data distribution. The preliminary training and cross-validation results are shown in Table 6.
Table 6 - Cross-validation results (2-class model) Algorithms Accuracy (mean) Uncertainty 95% confidence interval (± 2 standard deviation) KNN 96% ±7% SVM 98% ±5% ANN 97% ±7%
They show that SVM had the best accuracy and the lowest uncertainty. So, it was selected to build and final-train the predictive model.
The final predictive model, built with SVM algorithm, was then used to predict the engine core sizes in the testing dataset (the 50 engines unseen by the model). Performance metrics for final model evaluation are:
overall engine core-size prediction accuracy unacceptable engine core-size (h < 0.5”) prediction
accuracy
To be able to predict unacceptable engine core-size is the main objective of the predictive tool. The results are shown in Table 7.
Table 7 - Final test results of the 2-class model
Overall, the 2-class model had an accuracy of 98%, with an uncertainty of 5%. More importantly, it predicted unacceptable engine core sizes with 92% accuracy. The results were compared with the testing dataset in Table 8. It shows only one engine was misclassified.
3-class predictive model
For this model, the training dataset consisted of 116 engines with h ≥ 0.5”, 17 engines with 0.5” > h > 0.41”, and
17 engines with h ≤ 0.41”. Using a grid-search routine, the parameters that gave the lowest misclassification errors for the three algorithms were determined. They are shown in Table 9. Table 9 – Algorithms used and the parameters (3-class model)
Algorithms Parameters
KNN k = 4
SVM C = 55, ϒ = 0.5
ANN α = 0.002, Ne = 4
The classification accuracy of the three machine learning algorithms from the preliminary training and cross-validation of the predictive models are shown in Table 10.
Table 10 - Cross-validation results (3-class model) Algorithms Accuracy (mean) Uncertainty 95% confidence interval (± 2 standard deviation) KNN 91% ±12% SVM 91% ±11% ANN 91% ±7%
The cross-validation results show that the 3-class predictive models were less accurate than the 2-class model. This is because of insufficient core-size data to train the model.
Table 8
Comparison of predicted results with testing dataset – Two-class model
The 3-class model is more complex and requires more data for training. The three algorithms show the same accuracy; however, the ANN algorithm had the lowest uncertainty. The final predictive model, built with ANN algorithm, was then used to predict the core sizes of the engines in the testing dataset (the 50 engines unseen by the model). By using the same metrics as that for the 2-class model, the overall results are summarized in Table 11.
Table 11 - Final test results of the 3-class model
Overall, the 3-class model using the ANN algorithm has an accuracy of 94%, with 7% uncertainty. Its prediction accuracy for undesirable engine core sizes (h < 0.5”) is 75% (average of 83% and 67%). The results are compared with the testing dataset, in Table 12. It shows three engines were misclassified. Comparing to the 2-class predictive model, the 3-class predictive model is less accurate because of insufficient training data. As shown in Table 4, there were only 17 engines with 0.5” > h > 0.41” and 17 engines with h ≤ 0.41” available for training.
CONCLUSIONS
Machine-learning predictive models were developed for turbofan engine core-size prediction, using the database of two hundred manufactured engines and engines that were studied previously in NASA aeronautics projects. The 2-class predictive model is very accurate; it has an overall accuracy of 98%, with 5% uncertainty. And it predicted unacceptable engine core sizes with 92% accuracy. The 3-class predictive model has an overall accuracy of 94%, with 7% uncertainty. It predicts undesirable engine core sizes with 75% accuracy.
To further improve the accuracy (and reduce the uncertainty) of the 3-class predictive model, the database needs to be expanded. The 3-class model is more complex and requires more data for training. However, the limitation of publicly available engine data is a challenge to overcome. Overall, the results show that by bringing together sufficient (big) high quality data, robust machine-learning algorithms and automation, machine-learning-based predictive model can be an effective tool for engine core-size prediction, which would facilitate engine core architecture selection in the early stages of engine development. The promising results of this first study paves the way for further exploration of the use of machine learning for aircraft engine preliminary design.
ACKNOWLEDGMENT
The work presented in this paper was supported by the NASA Advanced Air Transport Technology Project of the Advanced Air Vehicles Program.
Table 12
Comparison of predicted results with testing dataset – Three-class model
REFERENCES
[1] Microsoft Azure Machine Learning Team, “Predictive Maintenance for Aircraft Engines.”
https://blog.revolutionanalytics.com/2016/05/predictive-maintenance-r-code.html
[2] RT Insights Team, “How Rolls-Royce Maintains Jet Engines With the IoT.” October 11, 2016.
https://www.rtinsights.com/rolls-royce-jet-engine-maintenance-iot/
[3] Larsson, L., Gronstedt, T., Kyprianidis, K.G., “Conceptual Design and Mission Analysis for a Geared Turbofan and an Open Rotor Configuration,” GT2011-46451. Proceedings of ASME Turbo Expo 2011, June 6-10, 2011.
[4] Jones, S.M., Haller, W.J., Tong, M.T., “An N+3 Technology Level Reference Propulsion System,” NASA TM- 2017-219501, May, 2017.
[5] Ng, A., “Machine Learning,” Coursera online course lecture notes. https://www.coursera.org/learn/machine-learning
[6] “Nearest Neighbor Classifier,” CS231 lecture notes. Stanford University. http://cs231n.github.io/classification/#nn [7] Pedregosa et al., “Scikit-learn: Machine Learning in
Python,” The Journal of Machine Learning Research, 12, pp.
2825-2830, 2011.
[8] Ng, A., “Support Vector Machines.” CS229 lecture notes. Stanford University. http://cs229.stanford.edu/notes/cs229-notes3.pdf
[9] Daly, M., “Jane’s Aero-Engine,” 2017-2018. [10] Meier, N., “Civil turbojet/turbofan specifications.”
http://www.jet-engine.net/civtfspec.html. Accessed August,
2018.
[11] GE Aviation. https://www.geaviation.com/commercial
[12] Pratt and Whitney. https://www.pw.utc.com/products-and-services/products/commercial-engines
[13] Rolls Royce. https://www.rolls-royce.com/products-and-services/civil-aerospace
[14] CFM International. https://www.cfmaeroengines.com/
[15] International Civil Aviation Organization, “ICAO Aircraft Emissions Databank.” May, 2018.
[16] Guynn, M.D., Berton, J.J., Fisher, K.L., Haller, W.J., Tong, M., Thurman, D.R., “Engine Conceptual Study for an Advanced Single-Aisle Transport,” NASA TM-2009-215784, August 2009.
[17] Guynn, M.D., Berton, J.J., Fisher, K.L., Haller, W.J., Tong, M., Thurman, D.R., “Analysis of Turbofan Design Options for an Advanced Single-Aisle Transport Aircraft,” AIAA 2009-6942, September 2009.
[18] Guynn, M. D., Berton, J.J., Fisher, K.L., Haller, W.J., Tong, M., Thurman, D.R, “Refined Exploration of Turbofan Design Options for an Advanced Single-Aisle Transport,” NASA TM-2011-216883, January 2011.
[19] Guynn, M.D., Berton, J.J., Tong, M.T., Haller, W.J., “Advanced Single-Aisle Transport Propulsion Design Options Revisited,” AIAA 2013-4330, August 2013.
[20] Nickol, C.L. and Haller W.J., “Assessment of the Performance Potential of Advanced Subsonic Transport Concepts for NASA’s Environmentally Responsible Aviation Project,” AIAA 2016-1030, January 2016.
[21] Collier, F., Thomas, R., Burley, C., Nickol, C., Lee, C.M., Tong, M., “Environmentally Responsible Aviation - Real Solutions for Environmental Challenges Facing Aviation,” 27th International Congress of the Aeronautical Sciences, September, 2010.
[22] Welstead, J.R., Felder J.L., “Conceptual Design of a Single-Aisle Turboelectric Commercial Transport with Fuselage Boundary Layer Ingestion.” AIAA 2016-1027, January 2016.
Appendix A Engine database
Appendix A (cont’d) Engine database
Appendix A (cont’d) Engine database
SFW – NASA Subsonic Fixed Wing project ERA – NASA Environmentally Responsible Aviation project AATT – NASA Advanced Air Transport Technology project