Evolving IoT Botnets in the Wild
Morteza Safaei Pour
Antonio Mangino
Cyber Threat IntelligenceLaboratory Florida Atlantic University
Kurt Friday
Matthias Rathbun
Elias Bou-Harb
Cyber Threat IntelligenceLaboratory Florida Atlantic University
Farkhund Iqbal
College of Technological Innovation Zayed UniversityKhaled Shaban
Abdelkarim Erradi
Department of ComputerScience and Engineering Qatar University
ABSTRACT
The insecurity of the Internet-of-Things (IoT) paradigm continues to wreak havoc in consumer and critical infrastructure realms. Sev-eral challenges impede addressing IoT security at large, including, the lack of IoT-centric data that can be collected, analyzed and correlated, due to the highly heterogeneous nature of such devices and their widespread deployments in Internet-wide environments. To this end, this paper explores macroscopic, passive empirical data to shed light on this evolving threat phenomena. This not only aims at classifying and inferring Internet-scale compromised IoT devices by solely observing such one-way network traffic, but also endeavors to uncover, track and report on orchestrated “in the wild” IoT botnets. Initially, to prepare the effective utilization of such data, a novel probabilistic model is designed and developed to cleanse such traffic from noise samples (i.e., misconfiguration traffic). Subsequently, several shallow and deep learning models are evaluated to ultimately design and develop a multi-window convo-lution neural network trained on active and passive measurements to accurately identify compromised IoT devices. Consequently, to infer orchestrated and unsolicited activities that have been gener-ated by well-coordingener-ated IoT botnets, hierarchical agglomerative clustering is deployed by scrutinizing a set of innovative and effi-cient network feature sets. By analyzing 3.6 TB of recent darknet traffic, the proposed approach uncovers a momentous 440,000 com-promised IoT devices and generates evidence-based artifacts related to 350 IoT botnets. While some of these detected botnets refer to previously documented campaigns such as theHide and Seek,
HajimeandFbot, other events illustrate evolving threats such as
those with cryptojacking capabilities and those that are targeting industrial control system communication and control services.
CCS CONCEPTS
•Security and privacy→Embedded systems security; Net-work security; •Computing methodologies→Classification and regression trees;Neural networks.
Permission to make digital or hard copies of all or part of this work for personal or classroom use is granted without fee provided that copies are not made or distributed for profit or commercial advantage and that copies bear this notice and the full citation on the first page. Copyrights for components of this work owned by others than ACM must be honored. Abstracting with credit is permitted. To copy otherwise, or republish, to post on servers or to redistribute to lists, requires prior specific permission and/or a fee. Request permissions from [email protected].
ARES ’19, August 26–29, 2019, Canterbury, United Kingdom © 2019 Association for Computing Machinery. ACM ISBN 978-1-4503-7164-3/19/08. . . $15.00 https://doi.org/10.1145/3339252.3339272
KEYWORDS
Internet-of-Things, IoT botnets, network security, network tele-scopes, Internet measurements, deep learning
ACM Reference Format:
Morteza Safaei Pour, Antonio Mangino, Kurt Friday, Matthias Rathbun, Elias Bou-Harb, Farkhund Iqbal, Khaled Shaban, and Abdelkarim Erradi. 2019. Data-driven Curation, Learning and Analysis for Inferring Evolving
IoT Botnets in the Wild. InProceedings of the 14th International Conference
on Availability, Reliability and Security (ARES 2019) (ARES ’19), August 26–29, 2019, Canterbury, United Kingdom.ACM, New York, NY, USA, 10 pages. https://doi.org/10.1145/3339252.3339272
1
INTRODUCTION
With the escalating adoption of the Internet-of-Things (IoT) par-adigm in numerous realms such as critical infrastructure, home networks [2], transportation [11], and various others [8], an in-creasing number of devices are becoming directly Internet-facing. Although IoT devices can be deployed behind NAT gateways, a plethora of such devices are indeed directly connected to the In-ternet and/or employ port-forwarding for proper and simplified provisioning and management [16]. Such devices, unfortunately, continue to lack basic security protocols and measures, rendering them easy targets for exploitations and hence recruitment within coordinated IoT botnets [7]. Furthermore, there exists several IoT inherent factors such as their heterogeneous nature and limited processing resources, which further complicate addressing their security requirements. Additionally, despite much attention to IoT in the security community [25, 36, 41], subpar attention is being paid to IoT security aspects by their manufacturers and users, on top of an overwhelming lack of maturity of IoT-specific update procedures for patch management.
In this context, the broad topic of IoT security has been a partic-ular area of focus in the security community after it was revealed
thatMirai[5], via infecting more than 200,000 devices, was behind
the debilitating Distributed Denial of Service (DDoS) attacks of late 2016 - a direct result of such deficiencies. Indeed, this event demonstrated the sheer capabilities for maliciousness by way of instrumenting exploitable IoT devices. Moreover, the IoT botnet environment has been evolving and expanding to include several more players who ultimately compete for control of IoT devices by means of newly-disclosed vulnerabilities. In order to supersede the opposition, the removal of any existent malware on the given device is now amongst the attackers’ objectives. Additionally, such IoT-centric malware will additionally kill running services [5, 29] and
can perform checks to evade honeypots [35, 54]. Further exacerbat-ing the situation, an unfortunate by-product of this competition is the promotion of even more sophisticated methods of exploitation– versus that of the first generation ofMirai. These novel adversarial approaches frequently result in the exposure of ports and services other than that of Telnet [32], the most common attack vector associated within IoT. All-in-all, this race between adversaries ulti-mately leads to an extremely dynamic behavior which makes the tasks of inferring and attributing compromised IoT devices and their coordinated illicit activities incredibly daunting.
Moreover, acquiring IoT-centric empirical data to be curated and analyzed for maliciousness is problematic, given the large-scale de-ployments of such devices in Internet-wide realms. Broadly, a major challenge related to the inference of IoT botnets through the analy-sis of network traffic is the lack of sound data-driven artifacts to assert that the perceived activities are actually originating from IoT devices and not typical machines. One solution would be to corre-late such inferred probing IP addresses with databases gathered by services such asShodan[48] and/orCensys[49], which collect and index information pertaining to IoT devices via IP crawlers, active scanning based on open ports and available services, and banner grabbing. At the same time, while doing so provides large-scale and valuable information regarding Internet-facing IoT devices, the set of those identified is indeed incomplete. This issue is in large part due to the scope of said services being limited to only the devices that are reachable by their scanners; a vast number of the targeted services and ports end up filtered out by firewalls. Moreover, upon infection, IoT malware typically blocks ports and disables common outward facing services (i.e., Telnet, CWMP, ADB, etc.) [5, 29] or modify the banners, which further impedes the indexing of all the inferred IoT devices. To this end, it becomes highly desirable to employ learning techniques for predicting (i.e., fingerprinting) the device types of previously unknown IoT sources.
In light of the aforementioned information, in this work, we explore passive measurements rendered by analyzing darknet data (i.e., Internet-scale traffic targeting routable yet unused IP address) to shed light on the insecurity of the IoT paradigm at large. Addi-tionally, to motivate empirical (and operational) IoT cyber security initiatives as well as aid in reproducibility of the obtained results, we make the source codes of all the developed methods available to the research community at https://github.com/COYD-IoT/COYD-IoT. Specifically, we frame the contributions of this work as follows:
•Designing and implementing a darknet-specific, formal sani-tization model that is capable of identifying and filtering out darknet misconfiguration traffic to permit the effective stor-age and processing of network telescope data. The model is advantageous as it does not rely on arbitrary cut-off thresh-olds, provides different likelihood models to distinguish be-tween misconfiguration and other form of darknet traffic, and is independent from the nature of the source of the traffic. To the best of our knowledge, the proposed model presents a first attempt ever to systematically fingerprint and thus filter-out darknet misconfiguration traffic.
•Devising and developing an IoT-centric fingerprinting ap-proach rooted in machine/deep learning and active mea-surements that is capable of inferring Internet-scale com-promised IoT devices by exclusively operating on network
telescope data. Using more than 3 TB of recent darknet data, the results expose more than 400,000 compromised IoT de-vices from very well-known vendors.
• Designing and implementing an IoT-specific botnet infer-ence methodology based upon effective and lightweight data-driven features, and hierarchical agglomerative clustering. The outcome uncovers more than 300 IoT botnets in the wild, where more than 25 of them contain upwards of 1,000 ex-ploited bots. Additionally, the results shed light on evolving IoT botnets such as those possessing cryptojacking capa-bilities (which were shown to be coordinated by the same “player” due to the usage of the same key) and those that were inferred to be targeting industrial control systems. The remainder of this paper is organized as follows. In the next section, we review the literature to demonstrate the state-of-the-art contributions of this work. In Section 3, we detail the darknet pre-processing model, the studied machine/deep learning models for fingerprinting compromised IoT devices, in addition to elaborating on the the IoT-centric botnet inference methodology. Further, in Section 4, we execute and evaluate the proposed approach to report on its results and discuss the obtained findings. Finally, Section 5 summarizes the contributions of this paper, discusses a few limita-tions and pinpoints several topics which pave the way for future work.
2
RELATED WORK
In this section, we elaborate on three topics central to the contempo-rary IoT security landscape. The first point of emphasis focuses on network telescopes as powerful mechanisms to capture IoT-specific, illicit network traffic. The second of which encompasses efforts pertaining to IoT device fingerprinting and the detection of com-promised IoT devices. Finally, we enumerate the literature related to IoT-specific botnet analysis.
Network telescopes.A network telescope, or a darknet, is a set of deployed, routable, allocated, yet unused IP addresses to passively observe incoming Internet-scale traffic [23]. Given that these IP addresses are not associated with any services, traffic targeting them is thereby deemed as unsolicited [10]; originating from infected devices, victims of denial of service attacks, or misconfiguration. Network telescopes have been recurrently proven to be credible sources for the investigation of large-scale, Internet-wide activities such as that of probing [9, 17] and DDoS attacks [22, 34].
In a recent study [40], the authors revealed more than 120,000 Internet-scale exploited IoT devices, by correlating darknet traffic and Shodan databases to investigate IoT probing campaigns. Fur-ther, Torabi et al. [53] conducted large-scale correlations between passive measurements and IoT-relevant information to investigate and disclose malicious activities associated with more than 26,000 IoT devices. Moreover, by means of applying filters to network tele-scope data in order to discern Mirai-relevant traffic, Antonakakis et al. [5] were able to gather IoT-related information pertaining to roughly 1.2 million Mirai-infected IP addresses during 7 months, in addition to examining their associated detection-avoidance tech-niques. Cetin et al. [12] conducted empirical studies on IoT malware cleanup efforts and remediation rates in a medium-sized Internet Service Provider (ISP) leveraging darknet and honeypot sources.
While such contributions are noteworthy, several shortcomings can be noted. First, such works rely on a specific IoT malware signature (i.e., tcpSeq == dstIP) which indeed can not provide a comprehensive identification of all IoT bots since many do not follow this signature; our measurements have revealed that less than 25% of all the inferred IoT bots match this specific signature. Second, the majority of these and related works solely depend on databases gathered by Internet scanning services, which miss a large portion of the actual IoT bot population. In contrast, we propose herein an approach consisting of active and passive measurements, coupled with machine/deep learning techniques, which leads to a more comprehensive view of the IoT botnets’ populations.
IoT device fingerprinting.The vast majority of IoT inference methods utilized in previous works rely on text information in gathered banners and leverage regular expressions to find specific patterns, or using text summarization methods [47] as input to classifiers [2]. In turn, several research efforts have alternatively elected to attempt IoT device fingerprinting by observing network traffic. For instance, Meidan et al. [31] manually labeled network traffic generated by IoT devices and employed a supervised learning algorithm to classify IoT devices for a given organization’s network. Moreover, Miettinen et al. [33] leveraged network traffic generated by IoT devices during their setup process for capturing device-specific traits, and subsequently mapped these signatures to the device type by way of random forest classification. Thangavelu et al. [51] also leveraged machine learning in order to classify types of IoT devices, but managed to also do so with that not presented in the training set. With that being said, one shortcoming of the aforementioned procedures is that their scope is limited to local IoT networks and thus do not present an Internet-wide perspective. Further, their proposed techniques are not applicable on one-way scan flows arriving at network telescopes. Additionally, in contrast, we present a deep learning approach to distinguish compromised IoT devices from infected multi-purpose systems using features in sequences of TCP SYN packets.
IoT botnet analysis.Within the context of botnet analysis through tailored honeypots, Pa et al. [37] were able to infer several malware families by constructing a honeypot for the purpose of analyz-ing attacks against Telnet services. Furthermore, Guarnizo et al. [28] designed the IoT-centric Scalable high-Interaction Honeypot (SIPHON) which showed an ability to attract a tremendous amount of malicious IoT botnet-generated traffic through a combination of worldwide wormholes and a small number of IoT devices. More-over, Metongnon and Sadre [32] have recently reported on a large number of exploited IoT protocols, based on the analysis of net-work traffic from IoT-centric honeypots and netnet-work telescopes. Given the copious amounts of IoT hardware in the wild and their accompanying heterogeneity, we have to note that honeypot-based methodologies frequently fail when it comes to mimicking all vul-nerabilities for the vast assortment of IoT products and respective firmware which is essential to attributing IoT botnets. Additionally, the vantage points of honeypots are typically quite small, hindering their effectiveness in tracking Internet-scale IoT botnets as well as accurately estimating their population size. From another perspec-tive, Herwig et al. [29] have recently provided a comprehensive investigation related to theHajimeIoT botnet using active scanning
of Hajime’s peer to peer infrastructure and by leveraging a longitu-dinal collection of root DNS backscatter traffic. While such a study is interesting, the undertaken approach is designed to specifically investigate this IoT botnet based on its infrastructure and can not be generalized to other IoT botnets. That being said, the proposed work in this paper compliments previous contributions by devising and evaluating a generic approach to infer ongoing IoT botnets based on the orchestration artifacts in their scanning modules.
3
PROPOSED METHODOLOGY
This section details the proposed approach as depicted in Figure 1. Its core components include(i)data collection and dataset prepa-ration, which entails preprocessing, introduces the darknet sani-tization probabilistic model to filter out misconfiguration traffic along with the inference of Internet-scale probing activities and labeling their sources;(ii)the utilization of a deep learning binary classifier for fingerprinting compromised IoT devices; and(iii)the feature engineering process coupled with executing hierarchical agglomerative clustering to infer and report on IoT botnets. These steps are subsequently detailed.
P AS SIVE M EAS UREME NT Inferring Probing Activities Feature Extraction for IoT Classification A
C TIVE L ABE LI NG
Port Scanning and Banner Grabbing
Tagging/Labeling
Test and Training Dataset Preparation
DATACOLLECTION ANDDATASETPREPARATION MODELTRAINING Training the IoT/non-IoT Classifier Predicting the Label of Unknown Scan Flows Filter out non-IoT Scanners
CLUSTERING ANDIOT BOTNETDETECTION Feature Extraction for Data Clustering Correlation with other Datasets Clustering and Attribution Darknet Sanitization
Figure 1: The components of the proposed approach
3.1
Network telescope sanitization model
Although network telescope (darknet) data predominantly consists of malicious packets originating from probes, backscattered packets from victims of distributed denial of service attacks, and malware propagation attempts, it might also contain what is dubbed as mis-configuration traffic. The latter non-malicious packets frequently result from network/routing or hardware/software faults that were erroneously directed towards a darknet. Another prospect is it being an artifact of improper configuration during darknet deployment. Indeed, misconfiguration traffic impedes the proper functioning of cyber threat intelligence algorithms operating on darknet data, which often yields numerous undesirable false positives and false negatives. Additionally, its excessive existence is a sheer waste of valuable storage resources. As a result, given the lack of formalism in addressing this problem, the objective herein is to elaborate on a probabilistic model that is specifically tailored towards the pre-processing of darknet data by way of fingerprinting, and in turn, filtering out embedded misconfiguration traffic.
In a nutshell, the model formulates and computes two metrics, with the aim of capturing the behavioral perspective of misconfiguration flows as they target the darknet space. Regarding the natural ten-dencies associated with typical network flows, the model initially estimates the rareness of access of the destination. Secondly, to en-sure the inclusion of the unique characteristics of the given flow as well, the scope of access is considered, which accounts for the num-ber of distinct darknet IP addresses that a specific remote source has accessed. Subsequently, the joint probability is formulated, com-puted, and compared. If the probability of the source generating a
misconfiguration flow is higher than that of the source being mali-cious (or unsolicited), then that particular source is deemed to be generating misconfiguration traffic, flagged, and the corresponding flows are filtered out. In the following, we detail the notions of both rareness and scope of access.
LetD={d1,d2,d3,· · · }represent the set of darknet IP addresses,
withDi being a subset of those accessed by sourcesi. First, the model captures how unusual these accessed destinations are. The underlying idea in doing so stems from the fact that misconfigured sources target destinations seldom called upon by others [26]. Thus, the model estimates the distribution of a darknet IPdi as being accessed by such a source as
Pmisc(di)=Í ns(di)
∀dj∈Dns(dj)
, (1)
wherens(di)is the number of sources that have accesseddi; in contrast, a malicious darknet source will target a given destina-tion at random. Typically, defining a suitable probability distribu-tion to exemplify the randomness of a malicious source taking aim at a specific darknet destination is quite tedious; therefore, a simplistic assumption is often applied to resolve this potential headache. In this context, Durumeric et al. [19] demonstrated that sources probe their darknet targets following a Gaussian distribu-tion. By adopting that assumption, one can model the probability of a darknet destination being accessed by a malicious source as
Pmal(di)= 1
σ√2πe
−xdi−µ2.2σ2
whereσis the standard deviation,
µis the mean,σ2is the variance, andxis the location of the darknet destination following the aforementioned distribution. Recall that not only does the model capture how unusual the accessed destina-tions are, but it also considers the number of darknet destinadestina-tions accessed by a particular source, which we subsequently describe. Given a set ofDi darknet destinations accessed by a specific source
si, the model ultimately measures two probability distributions, namely,Pmisc(Di)andPmal(Di); the former being the probabil-ity thatDihas been generated by a misconfigured source and the latter originating from that with a malicious intent towards dark-netDi. For example, if the darknet addresses accessed bys1are
D1={di1,di2,di3},P(D1)equates to the probability ofs1 access-ing the specific combination of addresses{di1,di2,di3}given three targeted destinations, multiplied by the probability ofs1accessing any three destinations. In turn, we can generalizeP(D1)as
P(Di)=P(Di={di1,di2,· · ·,din} | |Di|=n) ×P(|Di|=n). (2)
For both a misconfigured and malicious source, the first term of equation (2) can be modeled as
P(Di ={di1,di2,· · · } | |Di|)= K1 Ö ∀dj∈Di
P(di) (3)
where K, acting as a normalization constant and solely being used as a means of summing the probabilities to 1, could be defined asK=n!( ||DD|−|!n)!×|D1|n. Please note thatKis a standard normal-ization constant that is often employed in Bayesian probability [27]. Moreover,nencompasses all sources in the data set, whereas|D|, as previously mentioned, represents the darknet IP space. Conse-quently, the likelihood that a source will target a certain number of darknet destinations (i.e., the second term of equation (2)) depends
upon whether it is malicious or misconfigured. Characteristically, misconfigured sources access one or few destinations while those with malicious intent target a larger pool. In accordance, we have modeled such distributions as
Pmisc(|Di|)= 1
(e−1)|Di|! (4)
Pmal(|Di|)= 1
|D|, (5)
where the term(e−1)in equation (4) ensures the distribution’s summing equates to 1. It should also be noted that equation (4) guarantees a significant decrease in the probability as the number of targeted destinations increases. In contrast, equation (5) captures that of a random number of darknet addresses being accessed by a malicious source. Thereby, via plugging in of equations (4) and (5) into (3), respectively, we can represent the probability of a source being either misconfigured or malicious, given a set of darknet destination addresses, as Pmisc(Di)= 1 K(e−1)|Di|! Ö ∀dj∈Di Pmisc(di) (6) Pmal(Di)= 1 K|D| Ö ∀dj∈Di Pmal(di). (7) It is imperative to observe that equations (6) and (7) provide two distinct likelihood models to distinguish between misconfiguration and malicious, darknet-bound traffic, which enables their simplified and systematic post-processing. As the proposed model generalizes and formalizes the concepts of misconfiguration and malicious darknet traffic, it does not make any assumptions regarding the nature of the sources from which the given types of traffic are originating. Thus, the method deems a source and its corresponding flows as misconfiguration traffic if lnPmisc(Di) −lnPmal(Di)>0. Indeed, given that the field of Internet measurements for cyber security heavily relies on processing network telescope data, we make the code available in the mentioned repository to the research and operations communities at large.
3.2
Data collection and dataset preparation
3.2.1 Inferring probing activities.After the sanitization of the mis-configuration traffic by leveraging the aforementioned pre-processing model, the objective herein is to dissect the malicious traffic to ex-tract probing flows as indicators of exploitation. This is achieved through a Threshold Random Walk (TRW)-based probing detec-tion algorithm [39]. Essentially, the algorithm looks for subsequent packets from the same source IP address for a duration of 300 sec-onds; if a threshold is reached prior to the packet’s arrival, the given counter is reset. If, on the other hand, the threshold has held and the duration has not expired, the counter will be incremented. If the counter reaches a threshold of 64 [46], the flow would be deemed as a probing event.
3.2.2 Features’ extraction for IoT classification.Following the amal-gamation of packets into flows, the firsttconsecutive packets are extracted from each. Given that the majority of the observed scan-ning traffic are TCP SYN scans, the applicable features would reside in the TCP and IP header fields (i.e., ToS, Total Length, Identifica-tion, TTL, Dst IP Address, srcPort, dstPort, TCP SEQ, TCP ACK SEQ, TCP offset, TCP DATA Length, TCP Reserve, TCP Flags, TCP
Win, TCP URP, TCP option, Packet Inter-arrival Time). Overall, along with the inter-arrival time of the consecutive packets within a flow,d=17 features are gathered for each packet. In turn, the data samples for each scanner IP address would consist of at×dmatrix. To elaborate on the model’s training procedure, we subsequently detail the labeling process.
3.2.3 Port scanning and banner grabbing. In order to annotate de-cidedly accurate labels for the training dataset, it was imperative to immediately perform the procedure herein upon detection of a scan activity to circumvent any potential complications due to the dynamic reallocation of the associated device’s IP address (i.e., DHCP). To accomplish this, we utilized the gigabit open-source Internet scanning tool ZMap [20] as well as the high-speed appli-cation scanner ZGrab [18], in tandem, to provide comprehensive results necessary for guaranteeing the versatility of the classifica-tion task. Specifically, ZMap was used to probe the 45 most frequent ports†of the IP addresses (that were previously inferred as probing sources) that were still found to be active. These ports are selected to cover most of the default ports of various devices (based on reports by ZoomEye [57] in order to maximize the number of cap-tured banners. Furthermore, via ZGrab, we were able to obtain banner fields and application handshakes from various protocols such as HTTP(s), CWMP, TELNET, SMTP(s), IMAP(s), POP3(s), SSH, FTP, SMB, DNP3, MODBUS, BACNET, FOX, Siemens S7 and SSL certificates. Additionally, we designed and developed two custom scanning modules to extract RTSP and SIP banners.
3.2.4 Tagging/Labeling.We amalgamated a comprehensive list of keywords related to major Internet-facing IoT devices and ven-dors. As previously noted, these are typically the devices that are most targeted by IoT botnets. This list consists of devices provided byNmapalong with results from ZoomEye Internet Scanner and ZTag, Censys’s tagging module. Although it is unrealistic to claim that we cover all IoT products from all vendors, we indeed em-ployed information from various sources and focused on widely deployed Internet devices. In addition, we implemented a pars-ing algorithm which extracts useful keywords from banners and SSL certificates such as the combination of letters, digits, “-” and “_” signs, which typically represent device models [24] to enrich our list of devices. We further considered devices running multi-purpose OSs as non-IoT, which were identified using keywords such as “Win64”, “Ubuntu”, “Microsoft IIS” and “CentOS”, etc. while we deemed other specialized devices as IoT where their OS types were indicated as being “embedded”, “RouterOS”, “FritzOS” etc.† We also filter out benign scanners that have targeted the network telescope based on an obtained list†from Greynoise.io and returned information in banners.
3.3
Model training for fingerprinting
compromised IoT devices
We propose herein a learning approach for the extraction of em-bedded features within unsolicited scan flows for the training of a binary classifier which distinguishes between traffic originat-ing from both malicious IoT and non-IoT devices. The underlyoriginat-ing methodology is based upon determining similarities in network traffic that are exclusively associated with IoT devices and their
†We make this list publicly available in the mentioned repository.
corresponding IoT malware in order to fingerprint flows originating from them. Additionally, it is known that IoT products manufac-tured by the same vendor possess a uniform, low-level architecture such as sharing a similar network card, operating system, etc., and happen to share the same TCP/IP stack information, including but not limited to TTL value and initial TCP window size, thus per-mitting the fingerprinting of IP addresses that Internet scanning services (i.e., Shodan) may have overlooked or could not identify.
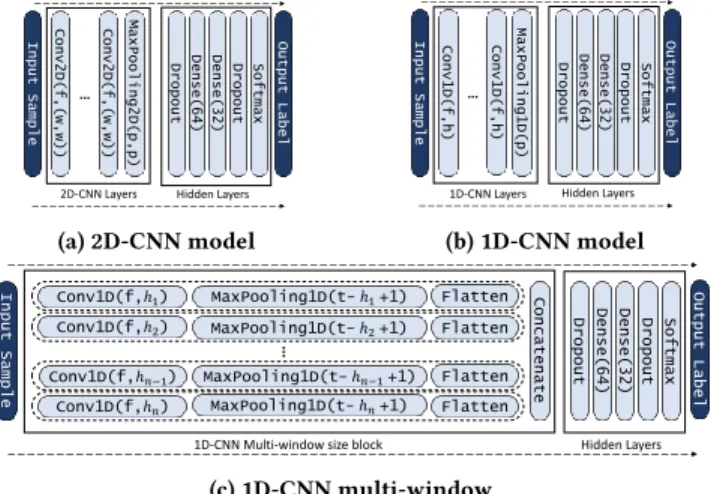
To select a suitable and a sound learning technique, we compare and contrast the performance of 5 models to permit the classification of compromised IoT devices in order to distinguish them from compromised, multi-purpose hosts. The first three are based on Convolutional Neural Networks (CNN), which are a category of deep learning models that use dynamic kernels to automatically extract features. To this end, we asses a two-dimensional CNN (2D-CNN), a one-dimensional CNN (1D-CNN) [15] and a multi-window one-dimensional CNN (MW-1D-CNN) [13] along with two “shallow” learning methods rooted in Random Forest (RF) models. In this context, an input sample consists of a matrix representa-tionXof a flow withtpackets and the number of extracted fields
dfrom a packet is considered, yieldingX∈Rt×d. Namely, theith packet in a given flow isxi ∈Rd. Convolution operations are also defined by applying local kernelsw∈Rh×won the input to extract spatially local correlations in the data. In terms of the 2D-CNN model, it containsLnumber of consecutive two dimensional con-volutional layers (withkkernels of sizew×w) and max pooling, followed by two dense hidden layers of sizes 64 and 32, respec-tively, and a Softmax classifier at the end (Figure 2a). The 1D-CNN model has a similar architecture to the 2D-CNN, but instead, the convolution kernels have a fixed kernel width equal to the input sample width (i.e.,h×d) (Figure 2b). Further, the MW-1D-CNN model mixes the outputs of various kernel heightshto capture the features. In turn, the output of the first layer of the proposed model is given byci =f(w·xi:i+h−1+b), wherexi:i+h−1defines the nota-tion for a sequence of packetsxi,xi+1, .,xi+h−1,brepresenting the bias, andf denoting the non-linear activation function. The filter is applied to each 2D sample instance to produce a feature map
c=[c1, . . . ,ct−h+1]. Subsequently, max pooling is applied over the feature mapc, taking the value maxc. We used kernelswof differ-ent window heightsh(h=[2,4,6, ...,hmax]) to enable the capture
Softm ax … Dropo ut Dense (32) Dense (64) Dropo ut Conca tenat e
Conv1D(f,ℎ1) MaxPooling1D(t-ℎ1+1) Flatten
Softm ax Dropo ut Dense (32) Dense (64) Dropo ut Conv2 D(f,( w,w ))
Conv1D(f,ℎ2) MaxPooling1D(t-ℎ2+1) Flatten
Conv1D(f,ℎ𝑛) MaxPooling1D(t-ℎ𝑛+1) Flatten Conv1D(f,ℎ𝑛−1) MaxPooling1D(t-ℎ𝑛−1+1) Flatten
Conv2 D(f,( w,w )) Max Po oli ng 2D( p, p ) Input Samp le Output Lab el Out pu t L ab el Inp ut Sa mp le Hidden Layers 2D-CNN Layers … Softm ax Dropo ut Dense (32) Dense (64) Dropo ut Conv1 D( f,h ) Conv1 D( f,h ) MaxPo oling 1D(p) Out pu t L ab el Inp ut Sa mp le Hidden Layers 1D-CNN Layers … Hidden Layers 1D-CNN Multi-window size block
(a) 2D-CNN model Softm ax … Dropo ut Dense (32) Dense (64) Dropo ut Conca tenat e
Conv1D(f,ℎ1) MaxPooling1D(t-ℎ1+1) Flatten
Softm ax Dropo ut Dense (32) Dense (64) Dropo ut Conv2 D(f,( w,w ))
Conv1D(f,ℎ2) MaxPooling1D(t-ℎ2+1) Flatten
Conv1D(f,ℎ𝑛) MaxPooling1D(t-ℎ𝑛+1) Flatten Conv1D(f,ℎ𝑛−1) MaxPooling1D(t-ℎ𝑛−1+1) Flatten
Conv2 D(f,( w,w )) Max Po oli ng 2D( p, p ) Input Samp le Output Lab el Out pu t L ab el Inp ut Sa mp le Hidden Layers 2D-CNN Layers … Softm ax Dropo ut Dense (32) Dense (64) Dropo ut Conv1 D( f,h ) Conv1 D( f,h ) MaxPo oling 1D(p) Out pu t L ab el Inp ut Sa mp le Hidden Layers 1D-CNN Layers … Hidden Layers 1D-CNN Multi-window size block
(b) 1D-CNN model Softm ax … Dropo ut Dense (32) Dense (64) Dropo ut Conca tenat e
Conv1D(f,ℎ1) MaxPooling1D(t-ℎ1+1) Flatten
Softm ax Dropo ut Dense (32) Dense (64) Dropo ut Conv2 D(f,( w,w ))
Conv1D(f,ℎ2) MaxPooling1D(t-ℎ2+1) Flatten
Conv1D(f,ℎ𝑛) MaxPooling1D(t-ℎ𝑛+1) Flatten Conv1D(f,ℎ𝑛−1) MaxPooling1D(t-ℎ𝑛−1+1) Flatten
Conv2 D(f,( w,w )) Max Po oli ng 2D( p, p ) Input Samp le Output Lab el Out pu t L ab el Inp ut Sa mp le Hidden Layers 2D-CNN Layers … Softm ax Dropo ut Dense (32) Dense (64) Dropo ut Conv1 D( f,h ) Conv1 D( f,h ) MaxPo oling 1D(p) Out pu t L ab el Inp ut Sa mp le Hidden Layers 1D-CNN Layers … Hidden Layers 1D-CNN Multi-window size block
(c) 1D-CNN multi-window
of varying dynamics specific to darknet packet flows (Figure 2c). We also devise two RF models, one that has been constructed using raw packet features while the other operates on feature statistics. We define feature statistics as the 5-tuple{min,1-quantile,median, 3-quantile,max}of each field in flows of packets, which overall produces 85 features. These statistics can be considered as an esti-mation of the probability distribution function related to each field of the packet sequence in each flow.
3.4
IoT botnets: features’ extraction and
campaign inference
Following filtering out non-IoT sources by employing the developed classifier, we conduct a thorough investigation of the individual scan flowsFlowI P, each comprising of at least 500 (t ≥500) sequen-tial packets originating from a particular unsolicited IoT device, and extract the corresponding feature setFI P =<PortsI P,πππI P, FlagI P, ARRI P>.PortsI Pis the grouping of the targeted transport protocols paired with their associated ports in ascending order (e.g.,PortsI Px ={TCP:23, TCP:80, TCP:8080}). In turn,πππI Pis the
corresponding discrete probability distribution function which rep-resents the frequency of appearance of each of these ports within the given flow of packets (e.g.,πππI Px =[0.15,0.70,0.15]). This is
relevant due to the fact that IoT devices typically possess a lim-ited supply of resources and as a result, in the midst of conduct-ing illicit scannconduct-ing activities, are often allocated to different ports and weighted based on the expected return. On the other hand, FlagI P is a boolean variable, holding a value 1 if the IoT device conducting the scanning has the signaturetcpSeq ==dstIPand 0 otherwise. This inference would provide some insights about a
Mirai-like behavior, possibly indicating a variant or a code-reuse
practice. Lastly, the Address Repetition Ratio, or ARRI P, is the ratio of the total number of packets sent by a specific source IP address over the number of unique destination IP addresses, and is defined as ARRI P= |F lowF lowF lowI P|
| {dst I P|dst I P∈F lowF lowF lowI P)} |. Such scenarios as
an ARRI P greater than one are a consequence of the sending of multiple packets to a particular destination in order to compensate for packet loss and/or the probing of multiple ports at each des-tination. Note that, each instance of the same probing campaign will exhibit an equivalent ARRI Pdue to the underlying IoT orches-trated probing machinery. Consequently, we hierarchically divide the IP addresses of the IoT scanners into separate groupsGGGibased on the givenPortsI P, FlagI Pand ARRI Pof their feature setFI P. Upon completion, we cluster members of each groupGGGi to iden-tify those scanning for the same set of ports but with a different probability distribution functionπππ. This enables us to leverage hierarchical agglomerative clustering [56], which determines the proximity matrix by calculating the distance between every pair of probability distribution functions {πππI P|IP∈GGGi} based upon the Jensen-Shannon Divergence (JSD) distance metric. JSD, defined in (8), is typically utilized to estimate the distance between two discrete distribution functions, and is the symmetrized version of the well-known Kullback-Leibler Divergence (KLD).
JSD(πππi||πππj)=1 2KLD(πππi||MMM)+ 1 2KLD(πππj||MMM), (8) whereMMM = 12(πππi+πππj). andKLD(PPP||QQQ) =−Í iPPP(i)log(QQQPPP((ii)))for discrete PDFPPPandQQQ.
We select hierarchical agglomerative clustering due to the fact that other clustering methods (such as K-means) are based on the assumption of equal cluster sizes which is not correct in this case while density-based techniques are computationally intensive with the increase in input data samples. Thereupon and proceeding in a bottom-up fashion, each observation forms its own cluster and begins moving up the distance-based hierarchy, subsequently merging with the clusters positioned along the way. To designate appropriate consolidation, we use a distance threshold (of 0.05) in which merging only occurs if the distance between the two given cluster centers falls beneath.
4
EMPIRICAL EVALUATION
The evaluation was executed using 3.6 TB of darknet traffic that was collected for a 24-hour period on Dec. 13th, 2018. This data was
provided by the Center for Applied Internet Data Analysis (CAIDA)
/8network telescope. While the datasetper seis subject to MOUs and thus cannot be shared as is, interested readers can request access to CAIDA’s real-time darknet data through DHS IMPACT [38]. Additionally, a 24-hour sample is available in the mentioned repository.
4.1
Results of the darknet sanitization model
By executing the proposed model of Section 3.1, the distribution of malicious and misconfiguration traffic with respect to the number of packets were found to be 88.21% and 11.21%, while in the matter of source IP addresses were 26.17% and 73.83%, respectively. Validation of such outcome revealed that close to 90% of the misconfiguration traffic defines packets that hit the/8network telescope only once, while the remaining appeared to be malformed packets. Further, it can be observed that even though the misconfiguration traffic is relatively low (11.79%), it is responsible for a large proportion of the source IP addresses (73.83%). These findings not only shed more light on the problematic nature of misconfiguration traffic with regards to Internet measurements via network telescopes, but consequentially emphasize the effectiveness of the proposed pre-processing model.
For the runtime specifics of the implementation which heavily relied on the Linux-derived libpcap C++ library, running on an Ubuntu 18.04 system with a quad core Intel Core i7-8550 at 1.80GHz processor, and 16GB of RAM, the developed approach was able to process close to 10 GB of darknet data in around 8 minutes. We believe this could be vastly improved by switching to SSD storage (since most of the delay was I/O related) and by adopting multithreading.
4.2
Results of datasets preparation
Regarding the data collection and dataset preparation steps of Sec-tion 3.2, and by immediately scanning back about 1.7M Internet scanners inferred through the network telescope, about 25.84% of them were found to have at least one open port. Further, amongst total 543,392 gathered banners, most of them were HTTP (54.11%), FTP (11.10%), SSL Certificate (10.50%), TELNET (10.19%), RTSP (7.00%), and CWMP (2.60%). Having completed this task, we were able to distinguish between 45,184 IoT and 7,763 non-IoT devices to design the training data set. At this juncture, the label and cor-responding metadata were incorporated intot ×dtraining and
test data matrices of IoT and non-IoT devices. We shuffled them and then performed normalization by way of the MinMax method, after which we computed and removed the mean from the data. Consequently, to evaluate the proposed model, we trained it using a prepared dataset captured in Nov. 2018 and then tested it using our dataset from Dec. 2018. The one month gap between the training and test datasets ensured that there exists no correlation between them for sound evaluation. The test dataset consisted of 34,974 IoT and 7,193 non-IoT sources.
4.3
Evaluating the IoT classification models
The proposed CNN models were implemented in Keras [14] over Tensorflow. To address the problem of class imbalance within the training dataset, cost-sensitive learning was applied [50]. The num-ber of epochs was found to be 30 to avoid over-fitting. Further, we performed a random search on subspaces of hyper-parameters as presented in Table 1, leveraging Hyperas [42], and selected the best model (out of 100 trials) with regards to the loss. Accordingly, the RF models were implemented and trained using the scikit-learn pack-age and the best model was retrieved based upon random search (using the RandomizedSearchCV method) in the search space as summarized in Table 2. In Tables 1 and 2, parameter ranges are reported withbegin:step:endformat. For evaluating the CNN models, we leverage an NVIDIA GeForce RTX 2070 GPU with 8GB of memory, 2304 CUDA cores and 288 Tensor cores to accommodate for parallelization.
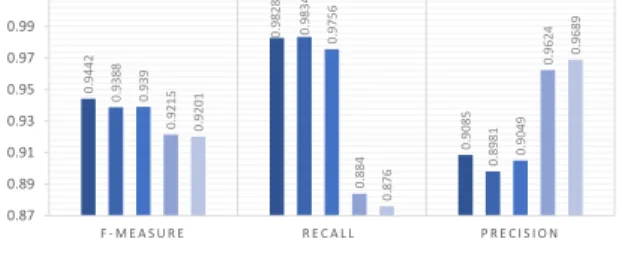
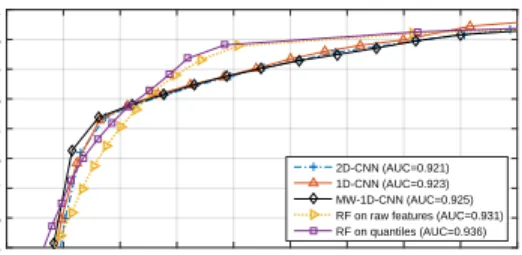
To compare the performance of the different models, we rely on typical metrics such as precision, recall and F-measure for the IoT class. We report the results in Figures 3 and 4. We can note that the AUC-ROC score for the RF model trained on quantiles is slightly higher than that of the other models. Further, both of the figures reveal that the CNN-based models result in higher recall and lower precision scores in contrast to the RF models. The outcome also shows that the multi window 1D-CNN (MW-1D-CNN) outperforms the 1D-CNN and the 2D-CNN; this is quite expected, since packet fields (unlike image pixels) lack temporal or spatial relationships with one another, and thus moving the kernels over the horizontal dimension would not lead to better learning. Furthermore, the multi-window 1D-CNN can capture varying dynamics being that only a portion of packets hit the /8 darknet.
Features’ importance.Although CNN models extract complex features, they are typically not interpretable. Nevertheless, to shed light on which features were most decisive in the learning process, and given that the RF models performed closely to the CNN models, we illustrate the features’ scores (derived from the RF model on quantiles) in Figure 5. Expectedly, the distribution of destination
Table 1: Tuned hyperparameters of the selected CNN models
Parameters Space 2D-CNN 1D-CNN MW-1D-CNN
Optimizer SGD, Adam, RMSProp RMSProp RMSProp RMSProp
Num. of kernels (k) 32,64,128 32 128 64
Kernel size (w×w) (2,2),(3,3) (2,2) -
-Kernel height (h) 2,4,8,16,32,64 - 64
-Max kernel height (hmax) 40:10:80 - - 80
Pool size (p) 2,3 2 3
-Batch size 128, 256 128 256 256
Activations Relu, Sigmoid, Tanh Sigmoid Tanh Sigmoid
Dropout U(0.1,0.3) 0.195 0.296 0.298
learning rate 0.001 0.001 0.001 0.001
Num. CNN layers (L) 1:1:4 4 3
-Table 2: Tuned hyperparameters of the RF models Parameters Space RF on raw fields RF on Quantiles Num. estimators 20:20:100 60 60
Max depth 4:4:20 12 12
Min samples leaf 2:10:102 52 52 Min samples split U(2,10) 6 4 Bootstrap True, False False False Criterion Gini, Entropy Entropy Gini
ports which typically reveals the scans’ intentions is indeed playing the most noteworthy role for fingerprinting IoT devices. This is closely followed by other fields such as total packet length and total header length, in addition to TCP/IP stack and OS-related fields such as TCP window size, option fields and TTL.
4.4
Inferring and characterizing compromised
IoT devices and campaigns
Given the aforementioned classification results, we selected the MW-1D-CNN model since it provided the highest true positive rate while strictly limiting the false positive rate to around 0.08 (Figure 4). We further re-trained the model on recent data from Dec. 2018 to accompany for any evolving dynamics. By applying the binary classifier on 24 hours of darknet data of Dec. 13th, it was
capable of fingerprinting 441,766 out of the 1,787,718 unique scan-ners to be originating from compromised IoT devices. Although previous works solely considered those with aMiraisignature as IoT-related [5], we inferred that in fact, they make up less than 25% of the IoT scanner population that the proposed model was able to uncover, leaving a whopping 75% to go about their malicious activ-ities without any semblance of an adequate attribution. Regarding the location of these exploited devices, Brazil (41.93%) was found to be hosting a significant portion, followed by Iran (10.17%), China (5.14%), Russia (3.59%), Egypt (3.36%), India (2.47%) and Turkey (2.32%). Furthermore, the top three Internet Service Providers (ISP) housing the largest number of compromised IoT devices were Vivo (134,021), TE Data (11,804) and Iran Telecom Co. (9,912). While the extensive presence of IoT scanners in and of itself gives pause for concern, a relatively significant proportion residing within the telecommunication and ISP sectors is rather expected; conversely, their existence within sectors including but not limited to critical sectors [30], is downright alarming. Indeed, amongst the inferred instances, quite a few were found to be located within that of med-ical infrastructures (87), government entities (86), manufacturing (99), and commercial businesses (38).
Along those lines, the lengthy list of 50 identified vendors re-veals a broad range of manufactures and device types that IoT botnets demonstrate preference for exploitation. Amongst them,
MikroTik(14,090),Aposonic(2,222),Huawei(732),Foscam(594)
andHikvision(417) are the topmost five targeted by the tagged
0. 944 2 0. 982 8 0.9085 0.938 8 0. 983 4 0. 898 1 0. 939 0. 975 6 0. 904 9 0. 921 5 0. 884 0.9624 0. 920 1 0.876 0.9689 0.87 0.89 0.91 0.93 0.95 0.97 0.99 F - M E A S U R E R E C A L L P R E C I S I O N MW-1D-CNN 1D-CNN 2D-CNN RF on raw features RF on quantiles
0 0.05 0.1 0.15 0.2 0.25 0.3 0.35 0.4 0.45 False Positive Rate
0.6 0.65 0.7 0.75 0.8 0.85 0.9 0.95 1
True Positive Rate
2D-CNN (AUC=0.921) 1D-CNN (AUC=0.923) MW-1D-CNN (AUC=0.925) RF on raw features (AUC=0.931) RF on quantiles (AUC=0.936)
Figure 4: AUC-ROC curves to evaluate the devised models
compromised devices. Routers (53.64%) and IP Camera/DVR (28.93%) continue to be the most frequently infected devices. Moreover, the most commonly targeted ports based upon the number of scanning packets were inferred to be 23 (%41.9), 80 (%23.9), 8080 (%19.7), 5555 (%4.9), 81 (%3.2), 2323 (%1.7) and 22 (%1.3). Intriguingly, we identified the presence of non-IoT targeted ports such as 2480 (Ori-entDB), 5984 (CouchDB), 3389 (RDP), 7001 (Oracle), 5900 (VNC) and 2004 (Drupal), as well as that of uncommonly used IoT ports 32764 (router backdoor), 37215 (UPnP in SOHO routers) and 52869 (UPnP in wireless chipsets).
Inferring and reporting on orchestrated IoT botnets.Amid the 441,766 IoT scanners that were detected on Dec. 13th, 2018,
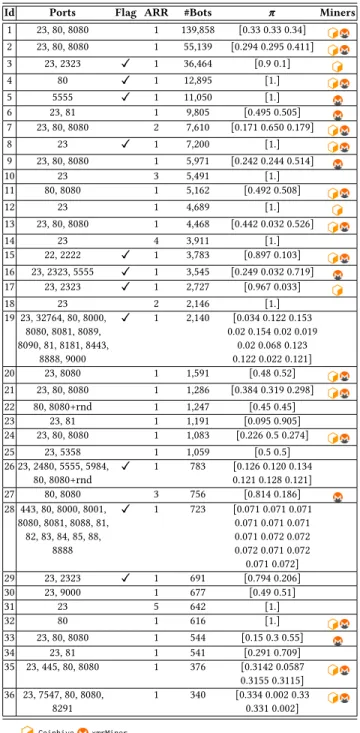
those that sent less than 500 packets were filtered out to exclude any of those that began at the end of the day, which can degrade the output of the probability distribution functionπππ. Subsequently, the respective features were extracted and the clustering method described in Section 3.4 was executed. It is worth mentioning that in roughly 40,000 scan flows, we witnessed a share of the scanning packets arriving at UDP ports. After thorough analysis of such occurrences, we deduced that they were resulting from associated bugs or attacks on p2p networks such as BitTorrent, which was in accordance with the observation made by [6]. As a result, in order to avoid the ill-effects of uncorrelated incidents, the identified packets were removed prior to clustering. Regarding the inferred campaigns, the proposed approach detected over 350 orchestrated IoT botnets. To this end, given that the size of each IoT probing cam-paign translates to its given severity, we summarize those botnets possessing more than 300 coordinated IoT bots in Table 3. Inter-estingly, in solely considering IoT scanners that targeted the set of ports {23, 80, 8080}, we detected 30 distinct botnets with differing distributions, Flag (i.e., Mirai-like signature/behavior), and ARR.
IoT botnets with cryptojacking capability.Aside from the dom-inant monetization method for IoT botnets of performing DDoS attacks, cryptojacking has become a noteworthy prevailing tech-nique. In essence, compromised routers have become responsible for injecting JavaScript crypto-currency miners into the HTTP pages requested by devices on their network. These JavaScript miners such asCoinhive[1] andxmrMiner[55], to name a few,
0 0.01 0.02 0.03 0.04 0.05 0.07 0.08 0.09 0.1 0.11 Total lenTCP Hdr lenTCP data lenTOS IP ID TTL Dst IPSrc P
ort Dst por
t
TCP SeqTCP ack seqTCP reser ve TCP flagsTCP winTCP ur
p Inter
arrival time Options Min Q1 Median Q3 Max
Figure 5: Ranking of features’ importance
strive for Monero altcoin in particular. To this end, we examined the HTTP requests’ responses to the IoT scanners, tagging those that contain thexmrMinerorCoinhiveJavaScript modules, and exporting their corresponding keys. By doing so, we were able to discover 1,134xmrMinerand 923Coinhiveinstances with 23 and 30 distinct keys, respectively. The campaigns designated as con-taining members with cryptojacking capabilities are pinpointed in Table 3. In addition, we uncovered large campaigns maintaining crypto miner instances with and without the presence of Mirai-like signatures. Moreover, 943 out of 1,134 devices, belonging to a total of 18 campaigns (#1, #2, #4, #5, #7, #8, #11, #13, #15, #16, #19, #20 #21, #24, #32, #33, #35 and #36), share the same xmrMiner-related key “4983e34ef01b4b579725b3a228e59e79". In other words, large portions of immense IoT campaigns could be reported to be attrib-uted to the same “player”. On top of that, upon exploring the key within Censys, 54,743Mikrotikswere shown to possess it. In total, these campaigns equate to approximately 250,000 compromised IoT devices–more than 54% of all the identified compromised devices.
A closer look at other campaigns of interest.Campaign #3 with 36,464 bots was inferred to be targeting ports 23 and 2323 with a proportion of 9:1, which is the same as instructed within
theMiraireleased code. Another interesting observation is related
to botnet #26 (of Table 3) where packets to random TCP and UDP ports were sent in addition to targeting the defined set of ports of {23, 2480, 5555, 5984, 80, 8080}. Additionally, this campaign targeted port 2480 (OrientDB) and 5984 (CouchDB), as well as other common IoT-related ports including 23, 5555 (ADB) and 8080. Upon further analysis, this behavior could be indeed attributed to the infamous
Hide and Seekbotnet [45].
In the context of port 32764 which is related to a backdoor vulner-ability [52], the proposed IoT botnet clustering approach revealed a campaign of substantial size (#19 in Table 3), consisting of 2,140 active IoT scanners with the following signature<{23, 32764, 80, 8000, 8080, 8081, 8089, 8090, 81, 8181, 8443, 8888, 9000}, Flag=1, ARR=1>. We did not come across any previously reported botnet families that scan such ports. As a result, we postulated that this campaign is either new or specific ports have been recently added to the target list of a previously known IoT botnet. Another aspect is that this is the only large campaign that exploited a relatively significant number ofNUUOproducts, which is a common indica-tor of theReaperIoT botnet. TheJenXbotnet [21], which scans ports 37215 and 52869, was also disclosed. Moreover, a botnet with <{2004, 80, 8080, 81}, Flag=0, ARR=2>was also discovered and consisted of 35 coordinated IoT scanners, all of which compromised QNAP NAS. This campaign strongly resembles that of theMuhstik
botnet [44], with the exception of the substitution of port 7001 with 81 in the target port set.
With the prevalence of IoT botnets, port 5555 (Android debug bridge) has become a popular target port. We found 23 IoT botnets that port 5555 is among their target port set. Based on the reports on ADB miner [3] and the similarity of its scanning module to
Mirai, we can attribute the inferred large IoT botnet (#5 in Table 3)
toMiraior its variantFbot[4]. Additionally, we foundxmrMiner
instances with the same previously noted key in the latter campaign and in campaign #16. Based off the set of target ports pertaining to campaign #25 (port 23, 5358), it seems to be highly likely attributed to that of theHajime[29, 43] IoT botnet. In total, this campaign
possessed 1,059 active IoT scanners (made up of IP cameras/DVRs). Furthermore, amidst the inferred campaigns exists those whose geo-distributions do not comply with that of the global distribution of infections. For instance, with respect to campaigns #13, #22 and #27, more than 98% of their infected IoT devices are located in Iran. In another instances, campaign #30 has upwards of 50% and 10% of compromised IoT devices located in USA and the UK, respectively, and the majority of the members of campaign #28 are located in North America (40%) and Europe (21%).
Table 3: Orchestrated IoT botnets in the wild
Id Ports Flag ARR #Bots πππ Miners
1 23, 80, 8080 1 139,858 [0.33 0.33 0.34] 2 23, 80, 8080 1 55,139 [0.294 0.295 0.411] 3 23, 2323 ✓✓✓ 1 36,464 [0.9 0.1] 4 80 ✓✓✓ 1 12,895 [1.] 5 5555 ✓✓✓ 1 11,050 [1.] 6 23, 81 1 9,805 [0.495 0.505] 7 23, 80, 8080 2 7,610 [0.171 0.650 0.179] 8 23 ✓✓✓ 1 7,200 [1.] 9 23, 80, 8080 1 5,971 [0.242 0.244 0.514] 10 23 3 5,491 [1.] 11 80, 8080 1 5,162 [0.492 0.508] 12 23 1 4,689 [1.] 13 23, 80, 8080 1 4,468 [0.442 0.032 0.526] 14 23 4 3,911 [1.] 15 22, 2222 ✓✓✓ 1 3,783 [0.897 0.103] 16 23, 2323, 5555 ✓✓✓ 1 3,545 [0.249 0.032 0.719] 17 23, 2323 ✓✓✓ 1 2,727 [0.967 0.033] 18 23 2 2,146 [1.] 19 23, 32764, 80, 8000, 8080, 8081, 8089, 8090, 81, 8181, 8443, 8888, 9000 ✓ ✓✓ 1 2,140 [0.034 0.122 0.153 0.02 0.154 0.02 0.019 0.02 0.068 0.123 0.122 0.022 0.121] 20 23, 8080 1 1,591 [0.48 0.52] 21 23, 80, 8080 1 1,286 [0.384 0.319 0.298] 22 80, 8080+rnd 1 1,247 [0.45 0.45] 23 23, 81 1 1,191 [0.095 0.905] 24 23, 80, 8080 1 1,083 [0.226 0.5 0.274] 25 23, 5358 1 1,059 [0.5 0.5] 26 23, 2480, 5555, 5984, 80, 8080+rnd ✓ ✓✓ 1 783 [0.126 0.120 0.134 0.121 0.128 0.121] 27 80, 8080 3 756 [0.814 0.186] 28 443, 80, 8000, 8001, 8080, 8081, 8088, 81, 82, 83, 84, 85, 88, 8888 ✓ ✓✓ 1 723 [0.071 0.071 0.071 0.071 0.071 0.071 0.071 0.072 0.072 0.072 0.071 0.072 0.071 0.072] 29 23, 2323 ✓✓✓ 1 691 [0.794 0.206] 30 23, 9000 1 677 [0.49 0.51] 31 23 5 642 [1.] 32 80 1 616 [1.] 33 23, 80, 8080 1 544 [0.15 0.3 0.55] 34 23, 81 1 541 [0.291 0.709] 35 23, 445, 80, 8080 1 376 [0.3142 0.0587 0.3155 0.3115] 36 23, 7547, 80, 8080, 8291 1 340 [0.334 0.002 0.33 0.331 0.002] Coinhive xmrMiner
A note on Industrial Control Systems (ICS).We also inferred an IoT botnet of 25 bots with the signature<{102, 8888, 993}, Flag=0, ARR=1>, probing Siemens S7 (heavily used in SCADA systems), IEC 61850 and ICCP (both are mostly used in utility/electric substations) on port 102. To provide additional insights, we also actively scanned each of the identified compromised IoT devices for ICS open ports on TCP and UDP 102 (S7), 502 (MODBUS), 20000 (DNP3), 47808 (BACNET) and 1911 (FOX) and found 100, 101, 465, 70 and 85 devices with open ports, respectively. We note that we have also inferred close to 40 devices having simultaneously all the above-mentioned ICS ports open, which we thought are related to ICS honeypots. Nevertheless, the appearance of compromised IoT devices within ICS setups is indeed alarming.
5
CONCLUDING REMARKS
This work compliments current IoT-centric research by offering a macroscopic, generic and passive methodology to infer Internet-scale compromised IoT devices and to report on ongoing IoT botnets. The work initially introduces a novel darknet-specific sanitization model that contributes to the field of Internet measurements at large. Subsequently, by devising a binary classifier based upon a CNN in conjunction with active measurements, the proposed work is capable of fingerprinting compromised IoT devices by solely operating on darknet traffic. Consequently, by automating the gen-eration of signatures related to the ports being probed coupled with their distribution in addition to other simplistic yet effective features, the proposed approach provides the capability to infer and track ongoing orchestrated botnets. The results demonstrate the significant security issue with the IoT paradigm by exposing more than 400,000 exploited IoT devices during only a 24-hour period, some of which have been deployed in critical sectors such medical and manufacturing. Additionally, the outcome provides evidence-based indicators related to ongoing IoT botnets such as those ofMirai,Hide and Seek, andReaper, to name a few. More interestingly, the results demonstrate evolving IoT botnets with cryptojacking capabilities, where many of those seem to be attrib-uted to the same mastermind by exposing the same employed key. As for future work, we will be attempting to address some of the limitations of the current research, such as the misidentification of two different IoT botnets which may possess the exact same feature set in addition to improving the tagging/labeling procedure. We will also be examining IoT-specific malware samples and devising formal methodologies between the traffic they generate from one side and the corresponding darknet traffic from the other side, to fortify the attribution evidence.
ACKNOWLEDGMENTS
This work was supported by a grant from the U.S. National Science Foundation (NSF) (Office of Advanced Cyberinfrastructure (OAC) #1755179).
REFERENCES
[1] 2018. Coinhive. https://coinhive.com/. (2018). [Online; accessed 01-March-2019]. [2] 2019. All Things Considered: An Analysis of IoT Devices on Home Networks. In28th USENIX Security Symposium (USENIX Security 19). USENIX Associa-tion, Santa Clara, CA. https://www.usenix.org/conference/usenixsecurity19/ presentation/kumar-deepak
[3] 360Netlab. 2019. ADB.Miner: More Information. https://blog.netlab.360.com/ adb-miner-more-information-en/. (2019). [Online; accessed 01-March-2019].
[4] 360Netlab. 2019. Fbot, A Satori Related Botnet Using Block-chain DNS System. https://tinyurl.com/yavvhf4v. (2019). [Online; accessed 01-March-2019]. [5] Manos Antonakakis, Tim April, Michael Bailey, Matt Bernhard, Elie Bursztein,
Jaime Cochran, Zakir Durumeric, J Alex Halderman, Luca Invernizzi, Michalis Kallitsis, et al. 2017. Understanding the Mirai Botnet. (2017).
[6] Karyn Benson. 2016.Leveraging internet background radiation for opportunistic network analysis. Ph.D. Dissertation. UC San Diego.
[7] Elisa Bertino and Nayeem Islam. 2017. Botnets and internet of things security. Computer2 (2017), 76–79.
[8] Elias Bou-Harb. 2016. A brief survey of security approaches for cyber-physical systems. In2016 8th IFIP International Conference on New Technologies, Mobility and Security (NTMS). IEEE, 1–5.
[9] Elias Bou-Harb, Mourad Debbabi, and Chadi Assi. 2016. Big data behavioral analytics meet graph theory: on effective botnet takedowns.IEEE Network31, 1 (2016), 18–26.
[10] Elias Bou-Harb, Mourad Debbabi, and Chadi Assi. 2016. A novel cyber security capability: Inferring Internet-scale infections by correlating malware and probing activities.Computer Networks94 (2016), 327–343.
[11] Elias Bou-Harb, Evangelos I Kaisar, and Mark Austin. 2017. On the impact of empirical attack models targeting marine transportation. In2017 5th IEEE International Conference on Models and Technologies for Intelligent Transportation Systems (MT-ITS). IEEE, 200–205.
[12] Orçun Cetin, Carlos Ganán, Lisette Altena, Takahiro Kasama, Daisuke Inoue, Kazuki Tamiya, Ying Tie, Katsunari Yoshioka, and Michel van Eeten. 2019. Clean-ing Up the Internet of Evil ThClean-ings: Real-World Evidence on ISP and Consumer Efforts to Remove Mirai. (2019).
[13] Yu Cheng, Fei Wang, Ping Zhang, and Jianying Hu. 2016. Risk prediction with electronic health records: A deep learning approach. InProceedings of the 2016 SIAM International Conference on Data Mining. SIAM, 432–440.
[14] François Chollet et al. 2015. Keras. https://keras.io. (2015).
[15] Ronan Collobert, Jason Weston, Léon Bottou, Michael Karlen, Koray Kavukcuoglu, and Pavel Kuksa. 2011. Natural language processing (almost) from scratch. Journal of Machine Learning Research12, Aug (2011), 2493–2537.
[16] Li Da Xu, Wu He, and Shancang Li. 2014. Internet of things in industries: A survey.IEEE Transactions on industrial informatics10, 4 (2014), 2233–2243. [17] Alberto Dainotti, Alistair King, Kimberly Claffy, Ferdinando Papale, and Antonio
Pescapé. 2015. Analysis of a /0 stealth scan from a botnet.IEEE/ACM Transactions on Networking (TON)23, 2 (2015), 341–354.
[18] Zakir Durumeric, David Adrian, Ariana Mirian, Michael Bailey, and J Alex Hal-derman. 2015. A search engine backed by Internet-wide scanning. InProceedings of the 22nd ACM SIGSAC Conference on Computer and Communications Security. ACM, 542–553.
[19] Zakir Durumeric, Michael Bailey, and J Alex Halderman. 2014. An Internet-Wide View of Internet-Wide Scanning.. InUSENIX Security Symposium. 65–78. [20] Zakir Durumeric, Eric Wustrow, and J Alex Halderman. 2013. ZMap: Fast
Internet-wide Scanning and Its Security Applications.. InUSENIX Security Symposium, Vol. 8. 47–53.
[21] IBM X-Force Exchange. 2018. JenX Botnet. https: //exchange.xforce.ibmcloud.
com/collection/JenX-Botnet-c47476c5e6fafd7df487cecd1110a761. (2018). [accessed 01-March-2019]. [22] Claude Fachkha, Elias Bou-Harb, and Mourad Debbabi. 2015. On the inference and
prediction of DDoS campaigns.Wireless Communications and Mobile Computing 15, 6 (2015), 1066–1078.
[23] Claude Fachkha and Mourad Debbabi. 2016. Darknet as a Source of Cyber Intelligence: Survey, Taxonomy, and Characterization.IEEE Communications Surveys and Tutorials18, 2 (2016), 1197–1227.
[24] Xuan Feng, Qiang Li, Haining Wang, and Limin Sun. 2018. Acquisitional rule-based engine for discovering Internet-of-Things devices. In27th{USENIX} Secu-rity Symposium ({USENIX}Security 18). 327–341.
[25] Aidin Ferdowsi and Walid Saad. 2018. Deep learning for signal authentication and security in massive internet-of-things systems.IEEE Transactions on Com-munications67, 2 (2018), 1371–1387.
[26] Matthew Ford, Jonathan Stevens, and John Ronan. 2006. Initial Results from an IPv6 Darknet13. InInternational Conference on Internet Surveillance and Protection. IEEE, 13–13.
[27] Andrew Gelman, John B Carlin, Hal S Stern, and Donald B Rubin. 2014.Bayesian data analysis. Vol. 2. Taylor & Francis.
[28] Juan Guarnizo, Amit Tambe, Suman Sankar Bunia, Martín Ochoa, Nils Tip-penhauer, Asaf Shabtai, and Yuval Elovici. 2017. SIPHON: Towards Scalable High-Interaction Physical Honeypots.arXiv preprint arXiv:1701.02446(2017). [29] Stephen Herwig, Katura Harvey, George Hughey, Richard Roberts, and Dave
Levin. 2019. Measurement and Analysis of Hajime, a Peer-to-peer IoT Botnet. (2019).
[30] Martin Husák, Nataliia Neshenko, Morteza Safaei Pour, Elias Bou-Harb, and Pavel Čeleda. 2018. Assessing Internet-wide Cyber Situational Awareness of Critical Sectors. InProceedings of the 13th International Conference on Availability, Reliability and Security. ACM, 29.
[31] Yair Meidan, Michael Bohadana, Asaf Shabtai, Juan David Guarnizo, Martın Ochoa, Nils Ole Tippenhauer, and Yuval Elovici. 2017. ProfilIoT: A Machine Learning Approach for IoT Device Identification Based on Network Traffic Anal-ysis. (2017).
[32] Lionel Metongnon and Ramin Sadre. 2018. Beyond Telnet: Prevalence of IoT Protocols in Telescope and Honeypot Measurements. InProceedings of the 2018 Workshop on Traffic Measurements for Cybersecurity. ACM, 21–26.
[33] Markus Miettinen, Samuel Marchal, Ibbad Hafeez, N Asokan, Ahmad-Reza Sadeghi, and Sasu Tarkoma. 2017. IoT Sentinel: Automated device-type identifi-cation for security enforcement in IoT. InDistributed Computing Systems (ICDCS), 2017 IEEE 37th International Conference on. IEEE, 2177–2184.
[34] David Moore, Colleen Shannon, Douglas J Brown, Geoffrey M Voelker, and Stefan Savage. 2006. Inferring internet denial-of-service activity.ACM Transactions on Computer Systems (TOCS)24, 2 (2006), 115–139.
[35] Marcin Nawrocki, Matthias Wählisch, Thomas C Schmidt, Christian Keil, and Jochen Schönfelder. 2016. A survey on honeypot software and data analysis. arXiv preprint arXiv:1608.06249(2016).
[36] Nataliia Neshenko, Elias Bou-Harb, Jorge Crichigno, Georges Kaddoum, and Nasir Ghani. 2019. Demystifying IoT Security: An Exhaustive Survey on IoT Vulnerabilities and a First Empirical Look on Internet-scale IoT Exploitations. IEEE Communications Surveys & Tutorials(2019).
[37] Yin Minn Pa Pa, Shogo Suzuki, Katsunari Yoshioka, Tsutomu Matsumoto, Takahiro Kasama, and Christian Rossow. 2016. IoTPOT: A Novel Honeypot for Revealing Current IoT Threats.Journal of Information Processing24, 3 (2016), 522–533.
[38] INFORMATION MARKETPLACE FOR POLICY and ANALYSIS OF CYBER-RISK & TRUST. 2019. https://impactcybertrust.org/. (2019).
[39] Morteza Safaei Pour and Elias Bou-Harb. 2018. Implications of Theoretic Deriva-tions on Empirical Passive Measurements for Effective Cyber Threat Intelligence Generation. In2018 IEEE International Conference on Communications (ICC). IEEE, 1–7.
[40] Morteza Safaei Pour, Elias Bou-Harb, Kavita Varma, Nataliia Neshenko, Dim-itris A Pados, and Kim-Kwang Raymond Choo. 2019. Comprehending the IoT cyber threat landscape: A data dimensionality reduction technique to infer and characterize Internet-scale IoT probing campaigns.Digital Investigation28 (2019), S40–S49.
[41] Morteza Safaei Pour and Mahmoud Salmasizadeh. 2017. A New CPA Resis-tant Software Implementation for Symmetric Ciphers with Smoothed Power Consumption: SIMON Case Study.ISeCure9, 2 (2017).
[42] Max Pumperla. 2019. https://github.com/maxpumperla/hyperas. (2019). [43] radware. 2018. Hajime Botnet Friend or Foe? https://security.radware.
com/ddos-threats-attacks/hajime-iot-botnet/. (2018). [Online; accessed 01-March-2019]. [44] Yegenshen Rootkiter. 2018. Botnet Muhstik is Actively Exploiting Drupal
CVE-2018-7600 in a Worm Style. https://blog.netlab.360. com/botnet-muhstik-is-actively-exploiting-drupal-cve-2018-7600-in-a-worm-style-en/. (2018). [Online; accessed 01-March-2019].
[45] Yegenshen Rootkiter. 2018. HNS Botnet Recent Activities. https:// blog.netlab.360.com/hns-botnet-recent-activities-en/. (2018). [Online; accessed 01-March-2019].
[46] Christian Rossow. 2014. Amplification Hell: Revisiting Network Protocols for DDoS Abuse.. InNDSS.
[47] Ramin Sahba, Nima Ebadi, Mo Jamshidi, and Paul Rad. 2018. Automatic text summarization using customizable fuzzy features and attention on the context and vocabulary. In2018 World Automation Congress (WAC). IEEE, 1–5. [48] Shodan. 2019. The search engine for Internet of things. http://shodan.io. (2019). [49] Censys Team. 2017. Internet-Wide Scan Data Repository.Retrieved(2017), 2017. [50] Nguyen Thai-Nghe, Zeno Gantner, and Lars Schmidt-Thieme. 2010. Cost-sensitive
learning methods for imbalanced data. InNeural Networks (IJCNN), The 2010 International Joint Conference on. IEEE, 1–8.
[51] Vijayanand Thangavelu, Dinil Mon Divakaran, Rishi Sairam, Suman Sankar Bhunia, and Mohan Gurusamy. 2018. DEFT: A Distributed IoT Fingerprinting Technique.IEEE Internet of Things Journal(2018).
[52] Sam Lloyd Thomas. 2018.Backdoor detection systems for embedded devices. Ph.D. Dissertation. University of Birmingham.
[53] Sadegh Torabi, Elias Bou-Harb, Chadi Assi, Mario Galluscio, Amine Boukhtouta, and Mourad Debbabi. 2018. Inferring, characterizing, and investigating Internet-scale malicious IoT device activities: A network telescope perspective. In2018 48th Annual IEEE/IFIP International Conference on Dependable Systems and Networks (DSN). IEEE, 562–573.
[54] Ivo Van der Elzen and Jeroen van Heugten. 2017. Techniques for detecting compromised IoT devices.University of Amsterdam(2017).
[55] xmrminer. 2019. Monero Web Miner. https://xmrminer.cc/. (2019).
[56] Dongkuan Xu and Yingjie Tian. 2015. A comprehensive survey of clustering algorithms.Annals of Data Science2, 2 (2015), 165–193.