CEDI
Working Paper No. 11-05
Optimal Leverage and Firm Performance:
an Endogenous Threshold Analysis
Fabrizio Coricelli, Nigel Driffield, Sarmistha Pal and Isabelle Roland
April 2011
CEDI DISCUSS
ION PAPER S
ERIES
Centre for Economic
Development & Institutions
Brunel University
West London
http://cedi.org.uk
An Endogenous Threshold Analysis
Fabrizio Coricelli, Paris School of Economics and CEPR Nigel Driffield, Aston Business School
Sarmistha Pal*
, Brunel University & IZA Isabelle Roland, London School of Economics
15 April 2011
Abstract: The paper aims to bridge the gap between the literature on optimal capital structure and
the literature on finance-output-growth nexus. On the basis of the trade-off theory of capital structure, we posit a non-linear relationship between leverage and productivity growth at the firm level. We test this hypothesis using both standard and IV threshold regression models, which in contrast to conventional estimates, allows us to endogenously determine optimal leverage despite firms’ temporary deviations from the optimum. Estimates for a sample of Central and Eastern European countries confirm a non-linear hump-shaped relationship between leverage and productivity growth, thus endogenously identifying an optimal leverage ratio. We show how our paper relates to and contributes to the literature on optimal capital structure and finance-output-growth literature.
Keywords: Trade-off theory; optimal leverage; TFP growth; non-linear relationship; threshold
regression; Instrumental variable.
JEL classification: G32, O16
*
Corresponding author Sarmistha Pal: [email protected]. An earlier version of the paper has been circulated as ‘Excess Leverage and Productivity Growth in Emerging Economies: Is there a threshold effect?. Financial support to Nigel Driffield and Sarmistha Pal from ESRC grant RES-062-23-0986 is gratefully acknowledged. We are very grateful to Sourafel Girma and Michael Henry for assistance with the estimation of the threshold model. We thank Yama Temouri for research assistance and Erik Berglof, Ralph de Haas, Bruce Hansen, Peter Sanfey, Ilya Strebulaev, Jeffrey Wooldridge, Jeromin Zettelmeyer and seminar participants at Aston Business School, UCL, EBRD and CICM conference, London for helpful comments and suggestions on an earlier draft. The usual disclaimer applies.
Optimal Leverage and Firm Performance:
An Endogenous Threshold Analysis
1. Introduction
Corporate leverage decisions are among the most important decisions made by firm executives, and have been the focus of intense scrutiny since Modigliani and Miller (1958). Financial conditions in the corporate sector not only affect firm performance but, as macroeconomists have long recognized, they can have a powerful effect on macroeconomic outcomes. The literature on “financial accelerators” is concerned with the role of financial conditions in amplifying shocks to the economy (see e.g. Bernanke et al. (1999)) while the literature on the finance-growth nexus (e.g., see Ang (2008) for a recent survey) is concerned with their contribution to long-term growth. The present paper aims to bridge the gap between the literature on optimal capital structure and the macro literature on finance-output-growth linkages. We employ endogenous threshold regressions to investigate the impact of leverage on total factor productivity (TFP) growth at the firm level, and the extent to which this varies across types of firms. Our focus on productivity growth as an index of firm performance is further justified in view of a recent McKinsey Global Institute Report (2010) which argues that productivity rather than profitability needs to be the focus of the companies during a period of public spending austerity in Europe because increased productivity will directly result in improved profitability. Estimates for a sample of Central and Eastern European countries suggest that TFP growth increases with leverage until the latter reaches a critical threshold that we label optimal leverage beyond which leverage becomes “excessive” and lowers TFP growth. We extend the existing work in this area by employing an instrumental variable (IV) threshold model following Kourtellos et al. (2009). In what follows, we show how our paper relates to and contributes to the literature on optimal capital structure and finance-growth literature.
Our paper builds upon trade-off theories of optimal capital structure, which explain firms’ choice of leverage by a trade-off between the benefits and costs of debt. The hypothesis goes back to Kraus and Litzenberger (1973) who weigh bankruptcy costs against the benefits of interest tax shields. The benefits of debt also include the mitigation of agency problems. In particular, debt has a
disciplining role due to the associated reduction in free cash flow (Jensen, 1986). The costs of debt include debt overhang (Myers (1977)), risk-shifting (Jensen and Meckling (1976)), bankruptcy costs (Warner (1977)), and asset fire sales (Schleifer and Vishny (1992)). The trade-off theory predicts that net benefits to debt financing rise for companies with low debt but decrease as leverage becomes high, implying that net benefits are a nonlinear function of leverage. The empirical literature tests this hypothesis (against the competing pecking order theory) by typically running cross-sectional or panel regressions of leverage on various firm-level, industry-level and market characteristics that determine optimal leverage (see Frank and Goyal (2009) for a review of the literature). While the literature has explored the relationship between leverage and firm value or performance (e.g., McConnell and Servaes (1995); Berger and di Patti (2006); Driffield, Mahambare and Pal (2007)), it has remained silent on the relationship between leverage and productivity. With both benefits and costs to leverage, we posit a hump-shaped relationship between leverage and productivity growth at the firm level. At low levels of leverage, higher leverage is likely to be associated with higher TFP growth as the benefits to leverage outweigh the costs and debt is used to finance productive investment. As leverage increases, the costs of debt become larger and erode the net benefits to leverage. Highly-levered firms not only suffer from a debt overhang problem, which reduces their incentives to invest in productive investment, their attention is also diverted from productivity improvements by the need to generate cash flow in order to service their debts.
Central and eastern European transition countries are an important case in point. The transition experience has long been described as a “natural experiment” (see for example, Eicher and Schreiber (2010)). While transition countries started the transition process from similar (though not identical) positions in terms of liberalisation, institutional reform has progressed in varying ways and to different degrees. Even after more than a decade of reforms, there is a growing feeling that the latter have failed to spur adequately the development of corporate financing opportunities. There is a striking proportion of firms in our sample with zero outstanding debt, including both short- and long-term debt. The “mystery of zero-leverage firms” (Strebulaev and Yang (2006)) is very pronounced in transition countries. This puzzle is augmented by another one: among those firms with outstanding debt, many tend to have very high, potentially excessive, leverage. Unlike much of the literature on developed countries, the literature on capital structure in developing and
transition countries has highlighted the importance of excess leverage (e.g. see Driffield and Pal (2010)). Second, many CEE countries have experienced rapid credit growth in recent years, in particular the Baltic States, Southern Eastern Europe and Ukraine. While the benefits of rapid credit growth have been recognized, the risks related to credit booms have been highlighted by the recent financial crisis, which has hit some CEE countries very hard. Assessing the sustainability of firm-level credit growth and developing appropriate policy tools remains one of the priorities of many policymakers and international organizations active in this region. In addition, the continued practice of soft budget constraints in this region may contribute to the negative impact of excessive
leverage on TFP growth1 in our sample. Soft budget constraints (SBCs) imply that government or
financial institutions are willing to provide additional financing to firms with negative NPV projects (see e.g. Dewatripont and Maskin (1995)). If firms take advantage of SBCs, borrowed funds may be used inefficiently rather than for productive investment. Research has indeed shown that one of the detrimental impacts of SBCs on the economy is a lack of R&D (Kornai (2001) and Brücker et al. (2005)). The sample thus provides sufficient inter-temporal and cross-sectional variation to be informative, without generating excessive heterogeneity.
Our estimates confirm that TFP growth increases with leverage until the latter reaches a critical threshold beyond which leverage becomes “excessive” and lowers TFP growth. We confirm the robustness of this result by estimating an IV threshold model using two different instruments following Kourtellos et al. (2009). This result points to the existence of an optimal leverage ratio where the net benefits of debt in terms of productivity gains are exhausted. Our paper reaches some qualitatively similar conclusions to Korteweg (2010). Using a different methodology and a market-based assessment of the net benefits to leverage, the author finds that as leverage increases, net benefits to leverage first increase and then decrease, and finally turn negative for distressed firms. In addition, our analysis sheds light on how optimal leverage varies with firm characteristics, particularly profitability and size. Our results provide support for the trade-off theory of capital structure. In particular, they highlight a positive (negative) relationship between profitability (size) and optimal leverage, unlike existing studies that use traditional cross-sectional or panel regressions. The threshold model allows us to determine optimal leverage despite firms’ temporary
deviations from the optimum in contrast to existing empirical evidence, which is based on observed leverage ratios (e.g. Korajczyk and Levy (2003)). Korteweg (2010) reaches similar conclusions.
Our paper also contributes to the burgeoning maco literature on finance-growth nexus. Best practice in the recent literature on finance and growth uses industry-level data to overcome endogeneity problems typical of analyses that rely on aggregate data and identify the channel through which finance affects growth. In their seminal contribution, Rajan and Zingales (1998) find that industries that are relatively more dependent on external finance grow disproportionately faster in countries with more developed financial markets. Our paper provides an alternative approach for studying the finance-growth nexus by directly linking firms’ financial structure to TFP growth. In addition, our paper is related to the literature on the macroeconomic risks associated with lending booms. Kiyotaki and Moore (1997) show how increases in corporate leverage lead to higher costs of external financing due to a higher default probability. This could lower investment and therefore output. Kiyotaki and Moore (1997) and Bernanke et al. (1999) show how high indebtedness in the corporate sector can induce severe slowdowns by amplifying and propagating adverse shocks to the economy. Our analysis provides a tool for policy-makers to identify the point at which corporate sector indebtedness becomes a cause for concern. Indeed, whether a firm is below or above the threshold can be seen as a measure of “sustainability” of a firm’s leverage. The recent financial crisis has highlighted the risks of lending booms and the associated buildup of excessive indebtedness. Policy makers need to be able to assess the sustainability of leverage, both in order to prevent similar crises in the future and to identify those firms or sectors of the economy that need to go through a deleveraging process following a crisis. The empirical literature on lending booms has generally focused on various aggregate measures of indebtedness such as various debt-to-GDP ratios (e.g. see Gourinchas et al. (2001)), or the growth rate of the domestic credit to GDP ratio as in the literature on banking and currency crises (e.g. see Kaminsky and Reinhart (1999)). Our paper extends this literature by looking at the sustainability of credit at the firm level.
The remainder of the paper is structured as follows. In Section 2, we describe the data set and the variables used in the empirical analysis. In Section 3, we discuss the empirical methodology and present our results. Section 4 summarizes our main results.
2. Data set and descriptive statistics
2.1. Sample and sources
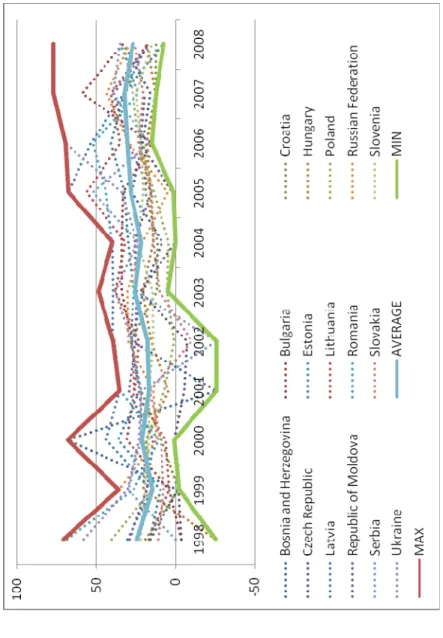
The empirical test of our central hypothesis is based on firm-level data for a group of Central and Eastern European (CEE) countries. Data used for the analysis is primarily taken from Orbis, a rich firm-level dataset, which is provided by Bureau van Dijk electronic publishing. Firm-level data have been supplemented by country-level institutional data from the European Bank for Reconstruction and Development (EBRD). Our sample consists of manufacturing firms from sixteen transition countries, namely, Bosnia and Herzegovina, Bulgaria, Croatia, the Czech Republic, Estonia, Hungary, Latvia, Lithuania, Poland, Republic of Moldova, Romania, Russia, Serbia, the Slovak Republic, Slovenia and Ukraine over the period 1999-2008. As can be seen from Figure 1, all these countries have on average experienced strong growth of domestic credit between 1998 and 2008. The effects of the Russian crisis, the bursting of the dotcom bubble and the financial crisis starting in 2007 visibly translated into a slowdown.
[Insert Figure 1 here]
2.2. Leverage measures and descriptive statistics
We use two different measures of leverage, generally dictated by data availability. First, we use the ratio of total debt (short-term and long-term debt) to total assets (abbreviated as TDTA). Second,
we use the ratio of total liabilities to total assets (abbreviated as TLTA)2. As can be seen from Table
1, there is a significant proportion of zero-leverage firms, without any outstanding debt, as well as a significant proportion of firms for which debt data is missing. This reflects the fact that many firms still do not have access to debt markets in these economies and instead make heavy use of internal finance, trade credit and other kinds of liabilities. Accordingly, the sample size is larger when leverage is measured by TLTA.
[Insert Table 1 here]
Table 1 shows the two average leverage ratios for each sample country. The table shows the average leverage ratios for two subsamples, “all firms”, including zero-leverage firms, and “non-zero debt firms”, excluding zero-leverage firms. Among all firms, the average ratios of total liabilities to total assets range between 0.33 (Moldova) and 0.47 (Poland, Romania), while average debt ratios range between 0.05 (Romania) and 0.20 (Latvia and Lithuania). Among non-zero debt firms, the average debt ratios are unsurprisingly higher in all the sample countries, ranging from 0.13 in Romania to
0.25 in Latvia3. Table 2 shows the percentile distribution of debt ratios in each country. One can
identify a general trend from these distributions; clearly, the debt ratios increase monotonically as we move from the lowest quartile to the top end of the distribution. In particular, debt ratios among the top 1% firms tend to be significantly higher than those for the median firms. Debt ratios for this group of firms exceed 50% in all but one country (Estonia). The maximum average leverage for this group is 89% in Croatia, closely followed by 85% in Latvia.
[Insert Table 2 here]
Table 2 also summarizes the distribution of debt by firm size. We split the sample between “small” and “large” firms, where small firms are defined as those in the first two quartiles of the distribution of total assets. The correlation between firm size and the debt ratio is mostly positive, although it is quite small in some cases. A large positive correlation is found in Bulgaria, Croatia, Moldova, Serbia, which is in line with the US and international cross-sectional evidence that large firms tend
to have higher leverage ratios than small firms4.
As mentioned earlier, institutional reforms in the financial sector have progressed at varying speeds across countries in our sample. Table 3 summarizes the average values of the EBRD banking sector reform index and stock market capitalization to GDP for the period 1999-2008. The extent of stock market capitalization as a share of GDP is generally limited in most of the sample countries, especially in Bulgaria, Latvia, Romania and the Slovak Republic. Therefore, firms’ external
3 We have also experimented with alternative leverage measures, namely, debt and liability ratios net of cash-flow, which yield comparable results to those presented here.
4
financing opportunities may depend crucially on the size and efficiency of the banking sector. The extent of banking sector reforms varies widely across countries as can be seen from Table 3.
[Insert Table 3 here]
Although a full investigation of the role of institutions is beyond the scope of this paper, we will include these two “institutional” variables in the threshold regression. It can be argued that a more efficient banking sector is better able to screen out bad loans while a better developed stock market not only offers an alternative source of external finance, but also contributes to improved corporate governance practices. Given the variation in the extent of institutional reforms across our sample countries, it may be important to control for the quality of financial institutions when assessing the effect of leverage on TFP growth.
3. Empirical model of leverage and productivity growth
We use the threshold regression framework of Hansen (2000) in order to test the hypothesis of a
non-linear relationship between leverage and productivity growth5
. As a robustness check, we account for the potential endogeneity of leverage using an instrumental variable (IV) threshold model following Kourtellos et al. (2009). Finally, we look at the relationship between the identified threshold and firm characteristics, namely profitability and size.
3.1. Total factor productivity estimates
TFP estimates are generated using the well-known Levinsohn-Petrin method (Levinsohn and Petrin (2003)). This method allows us to address a potential endogeneity problem which arises because firms anticipate shocks to productivity and accordingly adjust inputs throughout the production process. Appendix 1 explains how the Levinsohn-Petrin method helps to address this problem.
5
In order to identify the non-linear effects of leverage on total factor productivity growth, one could use a fixed-effects regression of total factor productivity growth on leverage and its non-linear terms, after controlling for other
covariates. However this conventional method does not allow one to endogenously determine the existence and significance of a threshold beyond which TFP growth is negatively affected by further increases in debt.
3.2. A threshold regression model
The current approach to threshold analysis was pioneered by Hansen (2000). The fundamental advantage of this approach is that the threshold model endogenously determines the existence and significance of one or more breaks (and the corresponding confidence intervals around the values), if one believes there exist nonlinearities in relationships between variables. In this case, we investigate the threshold values in the relationship between leverage and tfp growth, which in turn enables us to obtain a direct estimation of optimal leverage (despite allowing for firm’s temporary
deviations from the optimum). Denoting the leverage of the i-th firm in year t by Lit, the simplest
threshold model of TFP growth for the period [t, t+1] is given by
ǻTFPit+1 = Į1 Lit + ȕ’Xit+ Ȟit if Lit Ȗ (3a)
ǻTFPit+1 = Į2 Lit + ȕ’Xit+ Ȟit if Lit >Ȗ (3b)
where Ȟit is an error term and J is the threshold parameter to be estimated. Xit is a set of lagged
explanatory variables, including: firm size (dummy for small and medium firms that includes firms in the first two quartiles of total assets), age (dummy for young firms established in or after 1995), the share of intangible assets in total assets (IFATA), foreign ownership (a dummy indicating whether the firm is foreign-owned), lagged TFP to account for convergence effects (Barro (1998)), and sectoral dummies. As mentioned above, we also include two variables that capture the quality of financial market institutions: the EBRD index of banking sector reforms and stock market capitalization as a share of GDP. The use of lagged explanatory variables helps us to minimize the potential endogeneity bias of our estimates. However, if there is a lot of persistence in the data, this is unlikely to be a sufficient remedy. Therefore, we deal explicitly with endogeneity problems by estimating an IV threshold model following Kourtellos et al. 2009 in section 3.6. Combining (3a) and (3b), we can write:
ǻTFPit+1 = ȕ’ Xit +Į1 Lit I(LitȖ) + Į2 Lit I(Lit >Ȗ)+ Ȟit (4)
I(.) is an indicator function, indicating whether the leverage of the i-th firm at time t is less than,
and identically distributed with mean zero and finite variance. Depending on whether the actual
leverage is smaller, equal to, or larger than the threshold value (J ) to be estimated, observations
are divided into two “regimes” where the regimes are distinguished by different regression slopes,
1
D andD2. Let Sn(ȕ, Į(J)) represent the sum of squared errors for equation (4), where n is the
sample size. Given that the parameters Į depend on the threshold parameterJ, we denote them by
Į(J ). Because of this dependence, Sn(.) is not linear in the parameters but rather a step function
where steps appear at some distinct values of the threshold variable J. However, conditional on a
given threshold value, say J =J 0, Sn(.) is linear in ȕ and Į. Accordingly, Sn(ȕ, Į(J 0)) can be
minimised to yield the conditional OLS estimates ȕˆ(J 0) and Įˆ(J0). Among all possible values for
the leverage threshold, the estimate of the threshold corresponds to that value of Į, which
minimises the sum of squared errors Sn(ȕ,Į(J0)) for J =J 0. This minimisation problem is solved
by a grid search over 393 leverage quantiles {1%, 1.25%, 1.50% … 98.75%, 99%}. Once the
sample splitting value of J is identified, the estimates of the slope parameters are readily available.
If a threshold is identified, i.e. Į1 Į2, one can form a confidence interval for the particular
threshold valueJ . This amounts to testing the following null hypothesis:
H0: Ȗ= Ȗ0
Under the normality assumption, the likelihood ratio test statistic is routinely used in standard econometric applications to test for particular parametric values. But Hansen (2000) shows that
LRn(Ȗ) does not have a standard chi-square distribution in the threshold model. The correct
distribution function and the appropriate asymptotic critical values need to be obtained from the bootstrapped standard errors (see Girma (2005) for further details).
On the basis of the trade-off theory of capital structure, we expect a single threshold, which is equivalent to an optimal level of leverage where TFP growth is maximized. However, the confidence interval around the point estimate allows us to identify three bands of leverage. Suppose
that the limits of the confidence interval around Ȗ0 are given by J 1 (lower limit) and J 2 (upper
limit). The first band corresponds to a leverage ratio below the lower limit (i.e. leverage J1),
the second to an intermediate leverage ratio (i.e. J 1< leverage J2), and the third to “excessive”
ǻTFPit+1 = Į1 Lit I(LitȖ1) + Į2 Lit I(J1<LitJ 2) +Į3 Lit I(Lit >J 2)+ ȕ’ Xit +Ȟit (5)
The final step in our estimation strategy is to establish the asymptotic distribution of the slope
coefficients. Although these parameters depend on the estimated threshold limits J 1 and J 2,
Hansen (2000) demonstrates that this dependence is not of first-order asymptotic importance. Consequently, the usual distribution theory (i.e. asymptotically normal) can be applied to the estimated slope coefficients so that one can use the asymptotic p-values to test whether there is a
significant threshold effect, i.e. whether Į1= Į2= Į3=0. Rejection of this null hypothesis would
confirm the presence of a significant threshold effect. 6
3.3. Baseline threshold estimates
The threshold estimates of model (5) are summarized in Tables 4 and 5 for all firms and non-zero debt firms respectively. The tables report the coefficient estimates for all the explanatory variables (except sectoral dummies), including the slope coefficients for the three bands of leverage identified by the 95% confidence interval around the threshold. Despite some variation depending on the sample and the measure of leverage, the confidence interval estimates seem quite robust. The upper threshold limits are 0.386 for the debt ratio and 0.403 for the liability ratio for all firms. For indebted firms, the corresponding ratios are 0.397 and 0.429 for the debt and liability ratios
respectively7
. The initial value of TFP is insignificant, indicating the absence of convergence effects. Importantly, the slope coefficients for the three endogenously identified bands of leverage are all significant, irrespective of the sample and measure of leverage used. The slope coefficients provide
evidence that moderate leverage (leverage J2) boosts TFP growth (Į1and Į2 are positive), while
excessive leverage (leverage>J 2) lowers it (Į3 is negative), after controlling for firm-level, sectoral
and market characteristics.
6 This procedure is explained in detail in Girma et al. (2003) and Girma (2005).
7Although average observed TLTA is higher than average observed TDTA (see Table 1), the upper threshold limit for the liability ratio is only slightly higher than for the debt ratio (about 39-40% for debt and 40-43% for liabilities), after controlling for all other factors.
[Insert Tables 4 and 5 here]
The marginal effect of leverage on TFP growth decreases as leverage increases from the lower band through the intermediate one to the upper band where the effect finally becomes negative. In other words, at low levels of leverage an increase in leverage has a large positive impact on TFP growth. This impact diminishes as leverage increases and ultimately turns negative. Based on the estimates of Table 5, a firm with a debt ratio (liability ratio) of 0.2 (i.e. below the lower threshold), for example, reaps net benefits from leverage in the form of 4.24% (10.13%) extra TFP growth compared with an unlevered firm. For a firm with a debt ratio (liability ratio) of 0.37 (in the mid-range), the net benefits amount to 3.14% (3.73%) of extra TFP growth. Finally, a firm with a debt ratio (liability ratio) of 0.5 (i.e. an overlevered firm) has negative net benefits amounting to 23.56% (17.96%) of forgone TFP growth compared with an unlevered firm.
Clearly leverage is not the only factor affecting TFP growth. Among the firm-specific factors, firm size, share of intangible assets and ownership are significant determinants of TFP growth. In general, TFP growth is significantly higher for small and medium sized firms, foreign firms (this is significant at 10% level for indebted firms only) and firms with large intangible assets. The role of institutional factors is also worth highlighting here. A higher efficiency of the banking sector (as captured by a higher index of banking sector reforms) significantly increases TFP growth. The marginal effect of banking sector reforms is about 10% for all firms and 5-6% for indebted firms. In comparison, the marginal effect of market capitalization is small (about 1% for both samples), but positive and statistically significant too. These estimates confirm the beneficial role of better financial institutions on TFP growth in our sample.
3.4. Optimal leverage and firm characteristics
We test the robustness of our estimates by splitting the sample between more and less profitable firms and subsequently focusing on a subsample of large firms. In addition to confirming the robustness of the threshold, these robustness checks allow us to investigate the relationship between optimal leverage and firm characteristics. The trade-off theory predicts a positive relation between optimal leverage and profitability. An increase in earnings increases the tax advantage to
debt and reduces the expected costs of distress and bankruptcy, and hence results in an increase in leverage (Strebulaev (2007)). In addition, the trade-off theory predicts a negative relation between optimal leverage and size (e.g. Kurshev and Strebulaev (2006)). However, previous studies using cross-sectional or panel regressions tend to find a negative (positive) relation between profitability and leverage (size) (see e.g. Frank and Goyal (2009)). These conflicting results may be driven by the fact that studies typically rely on the implicit assumption that firms are always at their optimal
capital structures. By contrast, the threshold model allows us to determine optimalleverage despite
firms’ temporary deviations from the optimum and may therefore enable us to examine the empirical validity of the theoretical relationships.
We use two alternative measures of profitability, namely a firm’s profit margin and return on capital employed (ROCE). We split the sample based on the median values of those two profitability measures, i.e. a less (more) profitable firm is defined as one with a profit margin or ROCE below (above) the median profit margin or ROCE (approx. 0.04 for both measures). The threshold estimates for more and less profitable firms (indebted firms only) are presented in Table 6.
[Insert Table 6 here]
These estimates confirm the significant adverse effect of excessive leverage (beyond the upper threshold) on TFP growth and the positive benefits to leverage below that point. Interestingly, the estimated threshold parameters differ significantly for more or less profitable firms. The upper and lower threshold values of the debt and liability ratios are significantly higher for more profitable firms. For example, the upper (lower) threshold limit is approx. 60% (47%) for more profitable firms as opposed to approx. 30% (20%) for less profitable firms when profitability is measured by the profit margin. In addition, Table 6 shows that the negative effect of excessive leverage on TFP growth is significantly higher in absolute value for less profitable firms. In other words, more profitable firms are able to sustain significantly higher level of debts without hurting their productivity growth. This suggests a positive relationship between profitability and optimal leverage in line with the trade-off theory and the empirical results of Korteweg (2010). Previous studies using cross-sectional or panel regressions tend to find a negative relation between
profitability and leverage (see e.g. Frank and Goyal (2009)). This is because high profits mechanically lower observed leverage ratios and previous studies rely on the implicit assumption that firms are always optimally levered. Strebulaev (2007) shows formally that cross-sectional regressions will produce misleading results on the relation between leverage and profitability. Specifically, he shows that even if firms in simulated economies follow the prescriptions of the dynamic trade-off theory, higher profitability lowers the current leverage of a firm unless it refinances in that period. Hence, the presence of frictions that result in firms diverging from their optimal capital structures may complicate empirical work on the trade-off theory. By contrast, the
threshold model allows us to determine optimalleverage despite firms’ temporary deviations from
the optimum.
Finally, we focus on the subsample of relatively larger firms, defined as firms with total assets above the sample median. Again, we restrict our attention to non-zero debt firms. The confidence
interval for the debt ratio is 0.263-0.4468, against 0.312-0.397 for all non-zero debt firms. The
upper threshold is larger than in the full sample, indicating that large firms are able to carry more debt. However, the lower threshold, 0.263, is significantly lower for large firms than in the full sample. This suggests that on average debt starts hurting the productivity of large firms earlier. In other words, the net benefits to leverage in terms of productivity gains fade away earlier for large firms, suggesting a negative relationship between size and optimal leverage. Again, this contradicts the results of prior studies that tend to find a positive relation between firm size and leverage and our descriptive statistics in section 2.2. This is in line with Kurshev and Strebulaev (2006) who show that despite having a relatively higher optimal leverage ratio, small firms have lower observed ratios on average because they wait longer between refinancings.
3.5. Incidence of excess leverage
We use the leverage threshold estimates to calculate the percentage of firms above the upper threshold for the debt ratio (TDTA) in each of our sample countries. We obtain these estimates for all non-zero debt firms, but also for more and less profitable non-zero debt firms (where
8For brevity, we do not report the full results. There was no significant threshold for smaller firms, i.e. firms with total assets below the median.
profitability is based on the profit margin). The results are summarized in Table 7.
[Insert Table 7 here]
There is evidence of a significant proportion of firms in most of our sample countries with debt ratios in excess of the upper debt threshold. There is also pronounced inter-country variation: considering all non-zero debt firms, the proportion of firms with excessive leverage is the highest in Russia (above 20% of firms), closely followed by Bulgaria (about 19% of firms). In contrast, the proportion of non-zero debt firms with excessive leverage is the lowest in Hungary (little less than 3%), closely followed by Slovakia (little above 3%). These results combined with the finding that many firms have zero leverage (see section 2.2) highlight the presence of a double puzzle, the puzzle of zero-leverage firms and the puzzle of overlevered firms. In columns 2 and 3 of Table 7, we split the sample to focus on more and less profitable firms. The figures suggest that the proportion of firms with excessive leverage is higher among relatively less profitable firms in most sample countries. This result may point to an inefficient allocation of corporate loans in the CEE region. However, Korteweg (2010) finds that the degree of overleverage is higher for low-profit firms in a US sample, so this may not be a phenomenon that is limited to transition countries.
3.6. Instrumental variable threshold estimates
One criticism of the Hansen (2000) approach is that often the variable of interest is one subject to the decision making process of the firm, and is therefore endogenous. Typically, the literature has resorted to employing lags to resolve this problem, but in panel data with a good deal of persistence, this is unsatisfactory. As such the threshold estimates may be biased or rendered inconsistent by the endogeneity of leverage. Therefore, we check the robustness of our estimates by estimating an IV threshold model following Kourtellos et al. (2009). The authors show how to obtain a consistent estimate of the threshold parameter using an instrumental variable, when the threshold variable is endogenous. Using a similar set of assumptions as in Hansen (2000) and Caner and Hansen (2004), they demonstrate that these IV estimators are consistent if the threshold variable is potentially endogenous.
This methodology of course requires one to identify appropriate instruments, in this case variables that are correlated with debt ratios, but uncorrelated with firm level productivity. The data suggests that there is a good deal of inter-industry variation in debt levels, we therefore employ the industry median debt ratio. In addition, we also employ the fitted value of the debt ratio obtained
from the estimates of equation (A2) in Appendix 29
. To check for the validity and relevance of our IVs, we look at their correlation with the firm-level debt ratio and TFP growth. First, both median and fitted debt ratios are strongly correlated with the actual debt ratios. In particular, the correlation between the firm-level debt ratio and the industry median debt ratio (fitted debt ratio) is 0.5515 (0.8091). In addition, both IVs are uncorrelated with the error term in the TFP growth equation. This can be seen from the low correlation between the IVs and the estimated error from the TFP growth equation (5). In particular, the correlation between the industry median debt ratio and the estimated residual is 0.0578 and the correlation between the fitted debt ratio and the residual is 0.0945 in the sample of all firms.
The IV threshold estimates for the debt ratio (TDTA) are summarised in Table 8 for all firms and indebted firms. They confirm the non-linear effects of leverage on TFP growth: while moderate leverage boosts productivity growth, excessive leverage (beyond the upper threshold limit) hampers productivity growth. The estimated confidence interval is 0.318-0.382 for all firms and 0.354-0.427 for indebted firms. The corresponding figures from the non-IV threshold model were 0.330-0.386 and 0.312-0.397 for all firms and indebted firms respectively. In other words, estimates of the upper threshold limits (0.382 and 0.427) obtained from the IV model for all firms are within 2 percentage points of the IV estimates (0.386 and 0.397), suggesting that the non-IV estimates only slightly underestimate the true parameters. It is also worth noting that the non-IV threshold estimates are roughly the same irrespective of the choice of IV.
[Insert Table 8 here]
When leverage is instrumented using median leverage (fitted leverage), a firm with a debt ratio of
9Note that the variables that explain the fitted debt ratio in equation (A2) are not exactly the same as those determining TFP growth in equation (5). In particular, the log of total assets and the inflation rate are included in equation (A2), but not in equation (5). In addition, equation (5) includes initial TFP and also different bands of leverage depending on the
0.2 (i.e. below the lower threshold) reaps net benefits from leverage in the form of 12.43% (12.57%) extra TFP growth compared with an unlevered firm. For a firm with a debt ratio of 0.37 (in the mid-range), the net benefits amount to 2.83% (3.16%) of extra TFP growth. Finally, a firm with a debt ratio of 0.5 (i.e. an overlevered firm) has negative net benefits amounting to 14.29% (13.50%) of forgone TFP growth compared with an unlevered firm. The estimates for the mid-range are very similar to those obtained in Table 5, i.e. around 3%. By contrast, the estimated gains for underlevered firms are higher when leverage is instrumented for, i.e. approx. 12% versus approx. 4%. Also, the estimated costs for overlevered firms are lower when leverage is instrumented for, i.e. around 14% versus approx. 24%. Hence, despite the robustness of the threshold estimates, it appears that the endogeneity of leverage affects the estimated coefficients for the two most extreme bands of leverage.
Table 9 provides an overview of all the debt ratio threshold estimates that we have obtained so far. All the results point to the existence of a non-linear relationship between leverage and TFP growth. The presence of a single threshold in each case is compatible with the theory of optimal capital structure, where the threshold is associated with maximum TFP growth. The threshold estimates vary with firm characteristics, in particular profitability and size, in a way consistent with the trade-off theory of capital structure. The estimates are robust to the potential endogeneity of leverage.
3.7. Threshold estimates for 2000-2006
Given that the sample period 1999-2008 includes two crises, namely the Russian crisis of 1998-99 and the recent financial crisis of 2007, that had impact on the CEE region, we also estimate both the standard and IV threshold models for the subsample of “normal years” 2000-2006. The corresponding threshold estimates are summarized in Table 9.
[Insert Table 9 here]
They appear to be in line with those for the full sample 1999-2008 irrespective of whether we consider all firms or only indebted firms. For example, the IV estimate of the lower threshold is 0.32 in the full sample of all firms as opposed to 0.34 in the 2000-2006 sample. The IV estimate of the upper threshold is 0.382 in the full sample of all firms as opposed to 0.371 in the 2000-2006
sample. In conclusion, the results do not appear to be driven by the choice of sample period.
4. Conclusions
The paper aims to bridge the gap between the literature on optimal capital structure and the wider macro literature on finance-growth nexus. On the basis of the trade-off theory of capital structure, we posit a non-linear relationship between leverage and productivity growth at the firm level. We test this hypothesis using a threshold regression model following Hansen (2000). Estimates for a sample of Central and Eastern European countries confirm that TFP growth increases with leverage until the latter reaches a critical threshold beyond which leverage becomes “excessive” and lowers TFP growth. This result points to the existence of an optimal leverage ratio where the net benefits of debt in terms of productivity gains are exhausted. Despite some variation depending on the sample and the measure of leverage, the estimates seem quite robust. The estimates of the slope coefficients for the three bands of leverage (low, intermediate and excessive) suggest that the productivity gains (costs) to leverage are substantial for underlevered (overlevered) firms.
We examine the link between the endogenously determined leverage thresholds and firm characteristics, in particular profitability and size. Our results highlight a positive (negative) relationship between profitability (size) and optimal leverage, unlike existing studies that use traditional cross-sectional or panel regressions. In contrast to existing empirical evidence based on observed leverage ratios, the threshold model allows us to endogenously determine optimal leverage despite firms’ temporary deviations from the optimum. Korteweg (2010) reaches similar conclusions.
Using the leverage threshold estimates, we find evidence of a significant proportion of firms with debt ratios in excess of the upper debt threshold. Our results suggest that the proportion of firms with excessive leverage is higher among relatively less profitable firms in most sample countries. This result may point to an inefficient allocation of corporate loans in the CEE region. However, Korteweg (2010) finds that the degree of overleverage is higher for low-profit firms in a US sample, so this may not be a phenomenon that is limited to transition countries.
Following Kourtellos et al. (2009) we confirm the robustness of our threshold estimates by estimating an IV threshold model using two different instruments for firm-level leverage, namely the industry median debt ratio and a fitted value of the debt ratio. Our results suggest that the baseline estimates only slightly underestimate the true parameters. However, whether one uses the baseline model or the IV estimation matters for the estimated magnitude of the benefits to leverage. The slope coefficients are sensitive to the estimation method for the lower and upper bands of leverage. Finally, we show that our results are robust to the choice of sample period, by excluding from our sample two crisis episodes that significantly affected the CEE region.
References
Ang, J. B., 2008, A survey of recent developments in the literature of finance and growth, Journal
of Economic Surveys, 22, 536–576.
Barro, Robert, 1998, Determinants of Economic Growth: A Cross-Country Analysis, MIT Press. Berger, A. and di Patti, E. B., 2006, Capital structure and firm performance: a new approach to
testing agency theory and an application to the banking industry, Journal of Banking and
Finance, 30, 1065-1102.
Bernanke, Ben S., Mark Gertler, and Simon Gilchrist, 1999, The financial accelerator in a quantitative business cycle framework, Handbook of Macroeconomics, in: J. B. Taylor & M. Woodford (ed.), Handbook of Macroeconomics, edition 1, volume 1, chapter 21, pages 1341-1393
Brücker, H. Schröder, P.J.H. and Weise C., 2005, Can EU conditionality remedy soft budget
constraints in transition countries?, Journal of Comparative Economics, 33, 371-386.
Driffield, N. and S. Pal., 2010, ‘Evolution of Capital Structure in East Asia: Corporate Inertia or
Endeavours?, Journal of the Royal Statistical Society (Series A), 173, 1–29.
Dewatripont, Mathias and Eric Maskin, 1995, Credit and Efficiency in Centralized and
Decentralized Economies, The Review of Economic Studies, 62, 541-55.
Eicher, T.S. and T. Schreiber, 2010, Structural policies and growth: Time series evidence from a
natural experiment, Journal of Development Economics, 91, 169-179.
Flannery, M.J. and K. Rangan, 2006, Partial adjustment toward target capital structures, Journal of
Financial Economics, 79, 469-506.
Frank, Murray Z., and Vidhan K. Goyal, 2009, Capital Structure Decisions: Which Factors are
Reliably Important? Financial Management,38, 1-37.
Girma, Sourafel, 2005, Absorptive Capacity and Productivity Spillovers from FDI: A Threshold
Regression Analysis, Oxford Bulletin of Economics and Statistics, 67, 281-306.
Girma, Sourafel, M. Henry, R. Kneller and C. Milner, 2003, Threshold and Interaction Effects in the Openness-Productivity Growth Relationship: The Role of Institutions and Natural Barriers GEP working paper 2003/32, Nottingham.
Gourinchas, Pierre-Olivier, Rodrigo Valdes, and Oscar Landerretche, 2001, Lending Booms:
Latin America and the World, Economia, Spring, 1, 47-99.
Griffith, R., 1999, Using the ARD establishment level data to look at foreign ownership
and productivity in the United Kingdom, Economic Journal, 109, 416-42.
Hansen, Bruce E., 2000, Sample splitting and threshold estimation, Econometrica, 68, 575–603.
Jensen, Michael C., 1986, Agency costs of free cash flow, corporate financing, and takeovers,
American Economic Review 76, 323-329.
Jensen, Michael C., and William H. and Mecklin, 1976, Theory of the firm: Managerial behavior,
agency costs, and ownership structure, Journal of Financial Economics, 3, 305-360.
Kaminsky, G. and C. Reinhart, 1999, The Twin Crises: The Causes of Banking and
Balance-of-Payments Problems, American Economic Review, 89, 473-500.
Kiyotaki, N. and J. Moore, 1997, Credit Cycles, Journal of Political Economy, 105, 211-248.
Konings, J., Rizov, M and Vandenbussche, H., 2003, Investment and financial constraints in transition economies: micro evidence from Poland, the Czech Republic, Bulgaria and
Romania, Economics Letters, 78, 253-258.
Korajczyk, Robert A., and Amnon Levy, 2003, Capital structure choice: Macroeconomic
Kornai, J., 2001, Hardening the budget constraint: the experience of the post-socialist countries,
European Economic Review, 45, 1095-1136.
Korteweg, Arthur, 2010, The Net Benefits to Leverage, Journal of Finance, 65, 2137-2170.
Kourtellos, A., T. Stengos and C. Tan, 2009, THRET: Threshold Regression with Endogenous
Threshold Variables, Journal of Econometrics (forthcoming)
Kraus, Alan, and R. Litzenberger, 1973, A state-preference model of optimal financial leverage,
Journal of Finance 28, 911-922.
Kurshev, Alexander, and Ilya A. Strebulaev, 2006, Firm size and leverage, Working paper, Stanford University.
Levinsohn, J. and Petrin, A., 2003, Estimating production functions using inputs to control for
unobservables, Review of Economic Studies, 70, 317-341.
McKinsey Global Institute. 2010. Beyond Austerity: A path to economic growth and renewal in
Europe’, October.
Myers, Stewart C., 1977, Determinants of Corporate Borrowing, Journal of Financial Economics,
5,147-75
Olley, S. and A. Pakes, 1996, The Dynamics of Productivity in the Telecommunications
Equipment Industry, Econometrica, 64, 1263-98.
Rajan, Raghuram and Luigi Zingales, 1995, What Do We Know About Capital Structure? Some
evidence from international data, Journal of Finance, 50, 1421-1460.
Rajan, Raghuram and Luigi Zingales, 1998, Financial dependence and growth, American Economic
Review, 88, 559-586.
Schleifer, Andrei, and Robert W. Vishny, 1992, Liquidation values and debt capacity: A market
equilibrium approach, Journal of Finance, 47, 1343-1366.
Strebulaev, Ilya, and Baozhong Yang, 2006, The Mystery of Zero-Leverage Firms, Working Paper, Stanford Graduate School of Business, Stanford University
Strebulaev, Ilya, 2007, Do Tests of Capital Structure Theory Mean What They Say?, Journal of
Finance, 62, 1747-1788.
21 e 1: Cross-country variation in leverage 19 99-2 008 A ll firm s Non-zero debt fi rms TLTA TDTA TLTA TDTA Country Fir ms Total obs. Ze ro de bt (%) Mi ssing debt (% ) Mean SD Mean SD Mea n Mean Bosnia a n d H e rzegovina 1 46 13 62 19 .5 20 .7 0 .36 0 .27 0 .11 0. 14 0. 38 0 Bulgar ia 2 32 20 34 16 .7 27 .6 0 .42 0 .24 0 .13 0. 16 0. 45 0 Croatia 1 35 12 64 5 .8 87 .7 0 .39 0 .23 0 .08 0. 14 0. 42 0 Czech Republic 71 6 42 10 .7 38 .3 0 .41 0 .20 0 .12 0. 13 0. 44 0 Estonia 10 94 2.1 40. 4 0 .40 0 .24 0 .16 0. 14 0. 45 0 Hungar y 22 2 03 8 .9 53 .2 0 .39 0 .18 0 .10 0. 12 0. 39 0 Latvia 26 2 39 12 .1 34 .3 0 .45 0 .24 0 .20 0. 22 0. 52 0 Lithuania 30 2 81 3 .2 49 .1 0 .46 0 .19 0 .20 0. 17 0. 48 0 Poland 1 59 14 67 16 .4 52 .1 0 .47 0 .19 0 .10 0. 13 0. 52 0 R e publi c of Moldov a 1 95 18 06 21 .0 46 .5 0 .33 0 .25 0 .11 0. 17 0. 43 0 Ro m a n ia 2 36 20 62 44 .9 26 .8 0 .47 0 .23 0 .05 0. 10 0. 52 0 R u ssian Federa tion 6 56 60 21 15 .4 34 .5 0 .46 0 .25 0 .15 0. 18 0. 50 0 Serbia 7 42 69 25 15 .1 13 .2 0 .40 0 .26 0 .12 0. 16 0. 42 0 Slovak Rep ublic 1 24 11 37 5 .7 33 .0 0 .44 0 .21 0 .12 0. 12 0. 45 0 Slovenia 56 5 26 1 .3 78 .9 0 .40 0 .18 0 .18 0. 16 0. 43 0 Uk ra in e 3 91 14 43 17 .1 2. 6 0 .42 0 .25 0 .14 0. 16 0. 45 0 All 3 231 27 50 6 16 .9 31 .1 0 .42 0 .25 0 .12 0. 16 0. 45 0 : TLTA is t he ratio of t otal liabilities to to ta l as sets and TDTA is t he ratio of total debt (bo th short and long -r un) to to ta l asse ts.
Tabl e 2: Distri buti on of d e bt amon g firms wi th posi tive d e bt 19 99 -200 8 i n our sa mple Lever age percentil e s Average leverage by size Country 25% 50 % 75% 90 % 95% 99 % Small La rge Corr(size, leverage) Bosnia and Herzegovi na 0.0 3 0.07 0.1 9 0.32 0.42 0. 61 0. 11 0.12 0.02 Bu lg ar ia 0.0 4 0.12 0.2 4 0.42 0.51 0. 68 0. 08 0.19 0.13 Cr oatia 0.0 3 0.11 0.1 9 0.33 0.46 0. 89 0. 04 0.15 0.20 Czech Republic 0.0 4 0.12 0.2 1 0.32 0.39 0. 62 0. 11 0.13 0.02 Estoni a 0.0 2 0.18 0.2 8 0.36 0.44 0. 48 0. 16 0.20 0.09 Hungary 0.0 1 0.07 0.1 7 0.29 0.44 0. 54 0. 09 0.10 0.01 La tvia 0.0 7 0.19 0.3 5 0.62 0.71 0. 85 0. 22 0.15 -0 .17 Li thua nia 0.0 7 0.19 0.3 2 0.45 0.53 0. 66 0. 20 0.20 0.05 Pola nd 0.0 5 0.12 0.2 2 0.33 0.40 0. 59 0. 11 0.11 0.03 Republic of Moldova 0.0 4 0.13 0.3 0 0.46 0.56 0. 72 0. 06 0.18 0.21 Romania 0.0 4 0.08 0.1 7 0.28 0.34 0. 55 0. 04 0.06 0.12 Russ ia n Fed eration 0.0 5 0.13 0.2 9 0.47 0.58 0. 75 0. 14 0.17 0.01 Serbia 0.0 3 0.09 0.2 1 0.38 0.49 0. 69 0. 09 0.17 0.17 Sl ova k R e p u bli c 0.0 4 0.10 0.1 8 0.29 0.35 0. 58 0. 10 0.16 -0 .01 Sl oven ia 0.0 5 0.16 0.3 2 0.42 0.47 0. 73 0. 21 0.18 -0 .13 Ukraine 0.0 3 0.11 0.2 5 0.41 0.51 0. 71 0. 13 0.12 -0 .01 Note : Size is measured by tot al as se ts. “S mall firms” ar e defined as f irms in th e first two q u ar tile s of t he dist ri bu tion of tota l assets.
3: Quality of Fina nci al I n stit utions, 199 9-200 8 Country
Stock market capitali
za tion Banking reform index na 44 .5 4 2. 53 ia 15 .7 4 3. 38 oatia 32 .6 2 3. 7 23 .9 7 3. 74 a 30 .0 3 3. 85 25 .1 0 4 tvia 9 .4 3. 58 thuania 18 .1 8 3. 34 and 23 .8 7 3. 46 d ova 26 .9 2 2. 56 ia 13 .0 4 2. 91 ia 59 .4 9 2. 15 23 .2 1 2. 09 ia 7. 09 3. 41 ia 26 .1 7 3. 3 21 .5 4 2. 46 31 .0 8 2. 65 : Bank ing reform inde x: Av
erage EBRD inde
x of banking sec to r reform (1 to 4.3 , with a higher number indica ting a b etter score) ; Sto ck market alization: Aver ag e stock market capitalization in per cen t of GDP. Source : E B RD
Tabl e 4: Threshol d estimat es for total f actor producti vity growth, all firms (1) Deb t ratio (2) L iabil ity ratio Variabl e Coef ficient t-stati stic Va riable Coeff ic ient t-statisti c In it ia l TFP 0 .1094 0 .8432 Init ia l TFP 0 .135 7 0 .8421 TDTA>0 .386 -0 .0 24 7*** -3 .4 23 6 TLTA >0.40 3 -0.1676 ** -2 .2 95 1 0.330<TDTA<0 .3 86 0 .0966* ** 2 .5993 0.339< TLTA <0.403 0. 05 75 * * 2 .0061 TDTA<0 .330 0 .3249* 1 .7 3 7 TLTA <0.33 9 0. 33 49 * * 2 .4239 Small/Medium firms 0 .1644* ** 3 .2732 Small/Med ium firms 0. 12 73 *** 2 .8871 Young firm s -0 .0027 -0 .0 86 6 Young firm s -0 .0 05 7 -0 .1 39 3 Foreign firms 0 .2965 1 .4025 Forei gn firms 0 .341 5 1 .3094 Intangible assets 0 .2535* ** 4 .4287 Intang ib le assets 0. 20 4* ** 3 .0401 Bank Re form 0 .0963* * 2 .3 8 3 Bank reform 0. 09 41 *** 2 .7301 Market capitalization 0 .0085* ** 3 .7362 Market capitaliz ation 0. 00 95 *** 4 .0223 Intercept 0 .4183* 1 .8 1 7 Intercept 0 .436 8 1 .2236 Sector dummies yes Sector dummies Yes R-square 0 .0395 R-square 0 .043 6 95% CI for Ȗ 0 .33 0-0. 38 6 95 % CI for Ȗ 0. 339-0.40 3 Observatio ns 72 76 Observatio ns 7 276 Note : *** p-val u e<0. 01, ** p-va lue<0.05 , * p-value < 0.1
e 5: Threshold estimat es for total f actor producti vity growth, firms wi th outstanding debt > 0 ria ble (1) Debt ra ti o Coefficient t -stati stic Va riable (2) Liab ility rati o Coeffi c ient t-stat istic ia l TFP 0 .1246 1. 434 Init ial TFP 0. 16 06 1 .05 25 A> 0. 39 7 -0 .4 71 1*** -4.4027 TLTA >0.40 6 -0 .3591 ** * -4 .1 58 2 .3 97 0 .0848* ** 4. 0394 0.366< TLTA <0.429 0. 10 07 ** 2 .28 09 A< 0. 31 2 0 .2121* ** 3. 9798 TLTA <0.36 6 0. 50 63 ** * 4 .91 96 fi rm s 0 .2827* ** 3. 2036 Small/Med ium fi rm s 0. 21 83 ** * 3 .75 66 s -0 .0 18 4 -0.6056 Young fir m s -0 .0104 -0 .3 22 4 gn firms 0 .4598* 1. 7453 Forei gn firms 0. 47 22 * 1 .83 67 ib le assets 0 .1461* ** 3. 0295 Intang ib le assets 0. 11 03 ** * 3 .43 44 0 .0584* 1. 7651 Ba nk effi ciency 0. 04 98 ** 2 .29 09 ita lizat ion 0 .0144* 1. 9062 Market cap italizat ion 0. 00 79 ** * 4 .50 8 0 .3079 1. 4412 Intercept 0. 25 03 0 .58 69 Yes Sector dummies Ye s 0 .038 R-square 0. 06 09 % CI for Ȗ 0.312-0 .397 95 % CI fo r Ȗ 2 0. 36 6-0. 4 29 ns 7 276 72 76 : *** p-value< 0.01, ** p-value<0.05 , * p-value<0.1
Tabl
e
6: Thr
eshold estima
tes for TFP growth
fo
r
pr
ofi
table and non-p
rofi tabl e firms (indebted fi rms only) profi t margi n < 0.0 4 p rof it margin > 0.0 4 ROCE < 0.04 ROCE > 0.0 4 Variable Coeffi c ient t-stat Coeff icient t-stat Coefficient t-stat Coef ficient t-stat In it ia l TFP 0 .0 2 82 0. 1882 0 .2513 0 .8 9 98 0. 0111 0 .0785 0. 2218 1. 02 TDTA > Ȗ2 -0.5383 ** * -2.8 71 -0 .0 20 5*** -3 .7 415 -0 .6 52 2*** -3 .1 14 2 -0 .1 92 4** -2 .5415 Ȗ1 < TDT A < Ȗ2 0.7244* * 2. 4022 0 .074* 1 .8 9 06 -0.0035 -0 .0 12 2 0 .1114* ** 2. 98 TDTA< Ȗ1 0.297*** 3. 4799 0.1978* 1.7 3 39 0.5892** 2.2228 0. 19 43 * 1. 74 Small/medi um fi rm s 0 .0 8 51 0. 9762 0 .1 9 94 *** 3 .2 6 01 0 .0995* ** 2 .9089 0 .099 8 ** 2. 47 Young firm s -0 .259 5** -2.1802 0 .0105 0 .16 56 -0 .1 51 2** -2 .0 04 6 0. 0091 0. 18 Foreign firms 0 .1 2 95 0. 4785 0 .61** 2 .2 6 18 0. 1606 0 .6445 0 .6175* ** 2. 99 Intangible assets 0. 16 92 ** * 3. 0924 0 .2 0 01 *** 2 .6 7 32 0 .0977* ** 3 .0465 0 .3336* ** 4. 40 Bank e fficie ncy 0. 24 76 ** * 2. 8049 0 .0343 1. 47 1 0. 2102 1 .4692 0. 0243 1. 08 Market cap ita li zat ion 0 .0 1 23 1. 3506 0 .0 1 08 *** 3 .7 1 78 0. 0075 0 .7625 0 .0066* ** 4. 58 Sector dummies Yes Ye s Yes Yes Intercept -0 .4 456 -0.6346 0 .5858 1 .4 9 61 -0.3274 -0 .357 0. 3975 1. 07 R-square 0 .05 43 0 .0 5 9 0 .06 0 .076 95% CI for Ȗ 0.207-0.314 0. 46 9-0.6 01 0 .3 3 7-0. 502 0 .4 7 7-0. 69 5 Note : *** p-val u e<0. 01, ** p-va lue<0.05 , * p-value < 0.1
e
7: Distributi
on of firms
above
the
upper threshold limits
Non-zer o deb t firm s A ll fi rms Profi tabl e firms Non-profita ble firms (by profi t margi n)
(by profit margi
n) Debt rati o Ȗ2 > 0. 39 9 De b t ratio Ȗ2 > 0.577 Debt ratio Ȗ2 >0.30 1 Herzegovina 0 .1519 0 .0 1 46 0. 04 67 ia 0 .1886 0 .0 2 04 0. 08 56 oatia 0 .1042 0 .0 1 27 0. 05 40 0 .1088 0 .0 1 07 0. 05 65 a 0 .0841 0 .0 1 44 0. 04 56 0 .0290 0 .0 0 04 0. 01 45 tvia 0 .1276 0 .0 0 82 0. 11 52 thuania 0 .1119 0 .0 1 98 0. 02 63 and 0 .0625 0 .0 0 69 0. 01 04 0 .0875 0 .0 0 04 0. 08 75 ia 0 .1129 0 .0 0 90 0. 00 63 an Federati on 0 .2008 0 .0 5 15 0. 04 48 0 .1014 0 .0 0 74 0. 07 13 ia 0 .0322 0 .0 0 92 0. 01 15 ia 0 .0934 0 .0 0 83 0. 06 03 0 .0830 0 .0 1 02 0. 04 62
Tabl e 8: IV threshold estimates Al l firm s Firms wi th de bt > 0 IV Med ian debt F itted debt Med ian debt Fitt ed d e bt Variable coef f t-stat coef f t-stat
coeff t-stat coeff
t-stat In it ia l TFP 0.204 269* 1.6877 0.301256 * 1.79094 0 .0 91 5 0 .89 9 0. 12 4 0. 85 22 TDTA > Ȗ2 -0 .3 72 046** -2.1963 8 -0.2700 78 ** -2 .4 01 1 -0 .2858 ** * -6 .7 81 4 -0 .2699 ** * -5.9029 Ȗ1 < TDT A < Ȗ2 0. 49333 1* ** 3. 03 80 4 0 .6 4 74 52*** 9 .23256 0. 07 65 *** 2 .8038 0. 08 55 *** 3. 02 21 TDTA< Ȗ1 0 .13292 2* * 2. 54 92 3 0 .3 2 26 25*** 9 .34825 0. 62 13 *** 2 .6709 0. 62 86 *** 2. 68 79 Small/Medium firms -0 .2 59 07*** -9.1703 3 0 .09292 2 1 .24081 0. 13 85 *** 3.8485 0. 15 3* ** 3.039 Young firm s -1.00E -01 -0.02 7 -0.84 7 963 -0.66 6 17 -0 .0 24 7 -0 .448 -0 .0 25 2 -0.4645 Foreign firms 0.057 01** 2.0105 0.2 0 56 78*** 3.03257 0 .358 9 1 .3891 0 .498 8 1. 57 98 Intangible assets 0. 56622 5* ** 2. 92 24 4 2. 14 71 5*** 3 .04656 2. 33 61 *** 4 .5525 2. 11 05 *** 4. 03 77 Bank r e form 0. 38662 7* ** 10 .0 10 9 0. 15 44 5*** 8 .66049 0 .042 5 1 .4815 0. 05 6 1. 23 26 Market cap it al 4.09E-02*** 4. 72 08 1 2. 39 E-0 2 1 .13267 0. 00 76 *** 4 .1359 0. 00 82 *** 3. 96 99 Intercept 0. 03 69 24 0 .29 71 23 -0 .3 15 614 -1 .0 83 41 0 .312 6 0 .7482 0 .389 9 0 .71 Sector dummies Ye s Yes yes yes R-square 0. 04 0 .035 0. 04 5 0. 04 95% CI for Ȗ 0. 31 8-0.38 2 0.318-0 .382 0. 35 4-0.42 7 0.354-0 .427 Note : *** p-value<0.01, ** p-value<0.05 , * p-value<0.1
e 9: A summary of threshol d estimat es Debt ra tio thresholds Lower li mi t Upp er li mit All f ir m s 0 .33 6 0 .38 6 Non-zero-debt fi rms 0 .31 2 0 .39 7 All fi rms (IV) 0 .31 8 0 .38 2 Non-zero-debt fi rms (IV) 0 .35 4 0 .42 7 All fi rms (20 00 -2006) 0 .34 2 0 .37 7 Non-zero-debt fi rms (2 000-200 6) 0 .32 8 0 .37 6 All fi rms (IV) (20 00 -2006 ) 0 .32 3 0 .37 1 Non-zero-debt fi rms (IV) (2000-20 06) 0 .36 6 0 .40 8 Non-zero debt f irms onl y More profit able firm s 0 .46 9 0 .60 1 Less profi tabl e firms 0 .20 7 0 .31 4 More pr ofita ble firms(200 0-2 006) 0 .47 2 0 .59 9 Less profi ta bl e firms(2 000-2 006) 0 .24 8 0 .30 1 La rg e firms 0 .26 3 0 .44 6
30 Figure 1: Percentage c h anges in dom estic cr ed it i n the CE E region 19 98-20 08 So u rce: EB R D
Appendix
1
ul ation of TFP approach for est imating TFP is based on t he exis ti ng litera ture (see e. g., G riffi th 1999) . Th is ess en tially involv es estimating t he following unct io n: (A1) ubscripts i, and t refer to firm and year; yit , k it , lit , a n d m itrepresent the logarithm
of a fi rm’s ou tp ut ( sales ) an d th e product io n inpu ts: capital d as th e bo ok value of fixe d asse ts ), lab or (n umb er of
employees) and material costs
respectively. We estima te it H fro m (A1) as TFP an te log(TFP) . To deflate mone tary v alue s we use the cons umer pric e in de x due to the lack of av ailab le industr ial price defl ato rs for many sample coun tries .
of the most commo
n econometric prob lems wi th the es timation of TFP is endogenei ty . Typically, the regress ors will be cor rel ated with th be caus e firms change their fact or inpu ts in the ant ici pa tion of TFP ch ang es. If
that is the case,
th en profit max imi zation implies that t ion of the
error term is expected
to infl uence th e decision o n factor inp u ts. Co nsequen tly the OLS e stimat es could be i nconsistent . Therefor so hn -Petr in co rrectio n . Lev ins ohn an d Pet rin (2 0 03 ) extend Olley and Pakes (1996 ) b y u
sing material inpu
ts as a p roxy t o co nt le productiv ity shocks.
Ap
pend
ix 2: Estimation
of a
fitted debt ratio
Our app roach is based on the exist ing literature , wh ich ide ntifi es a number of firm-spe cific fact or s that de te rmine cor por ate leve rag e ( e.g. see Rajan an d Zingales , 1 995; F lannery an d Rangan , 2 006 ; D
riffield and Pal,
20 10). Fo ll o w ing o ur d is cuss ion in section 2, we also in clu de so me country spec ific instit utional variab les, name ly an inde x of banking se ct or r eforms ( th at c aptures b ank in g sector e ffic iency) and st oc k market capit alization as share of GDP . Accor dingly , w e estimate th e followin g leverage
equation for fir
m i in year t ( t=199 9… 2 008) : Leverage it = ȕ0 + ȕ1 log(assets) it -1 + ȕ2 Age it-1 + ȕ3 (Intangible Fixe d Assets /Tota l Asse ts)it -1 + ȕ5 (EBIT/Total Assets) it -1 + ȕ6 Inflation it -1 + ȕ7 (Bank efficiency) ȕ8 (S tock mark et capitalization) i t-1 + ȕ9 Industry Me dian Lev erage t1 + Ȟi + uit (A2) where EBIT s tand s for e arn ings b efore interest a nd tax es, Ȟi is a fir m-speci fic fixed e ffect and uit
is the error term
10 . Th e firm-specific fixed effects accoun t fo r various un obser ve d
firm-specific factors that
may also influe nce lev erage. We use pa ne l dat a fixed effects t o es tim ate eq uati on (A 2) , us both deb t and liability ratio s as alternativ e measures o f leverag e. In order to mi tig ate a potent ia l simu ltaneity b ias, we foll
ow the general convention
(e. g., see Dri ffield and Pal (20 10) ) and u se (o ne y ear) lagg ed explanatory variable s. Fo r simult an eity to b ias the est imates, al l f ir m s n eed t o c or rec p red ict productivit y o n e year in ad va n ce, which we ru le o ut .
The fixed effects es
timates are su
mmarized in Table A1 belo
w. I n g en eral, more profi ta ble firms te nd to ha ve low er lev erage. Foreig n fir ms
and firms in industries
wit
h hig
her median lev
erage tend to h ave h igh er l ev erag e. bank reform coefficien t is p o sitive but remains insig nificant. Th e coefficient on stock mark et ca pit alization to GDP is h owever posit ive a n d significa
for both meas
ures of le
vera
ge, thus hig
hlighting a
leve
rage premium
for firms oper
ating in co un tries with b etter stock mark et d ev elopme nt. 10 Not e tha t we do
not have data
on market-t o-book ra tios. In a lte rn ative specifica tions , the growth of tot al assets w as included and always found t o be insi gn ifica nt . Fi xe d as a sha re of
total assets are
also e
xcluded from (A2)
because there could also be a pr oblem of mult icollinear it y w
ith the shar
e of int
angible fixed a
e A1 : Determi nants of Leverag e :
Fixed effects esti
ma tes of debt a n d l iabi li ty ratio s, 19 99 -20 08 VAR IABLES De bt ra tio L iabili ty ra tio Total assets 0.00170 -0.01 33 (0 .0 03 60) ( 0.0131) Sm al l/m e d ium firm s -0 .02 56*** -0.01 05 (0 .0 05 79) ( 0.00918) Young firm s 0.00103 -0.00 0113 (0 .0 01 22) ( 0.00240) Foreign 0 .0736* ** 0 .107** * (0 .0 06 77) ( 0.0178) Median debt 0 .257** * (0 .0 59 3) Median liab il it y 0 .189* ( 0.103) Sha re o f in ta ng ib le asse ts 0.0501 -0.11 0 (0 .0 33 9) ( 0.0694) P ro fit ab il it y -0 .05 35** -0.16 6*** (0 .0 22 8) ( 0.0479) Inflation -0 .00 0343 -0.00 368*** (0 .0 00 224) ( 0.000883) Ma rket ca p italiz ati on 0 .00070 2* ** 0 .00086 9* (0 .0 00 196) ( 0.000441) Banki ng reform s 0 .00526 0 .0217 (0 .0 07 50) ( 0.0332) Constant 0 .0129 0 .410** (0 .0 74 7) ( 0.176) Observati o ns 9 310 1 0433 R -squared 0 .090 0 .132 Num b e r o f f irm s 2 243 2 379 : Robust standar d erro rs in p arent he ses; * ** p-value<0.01, * * p -valu e<0.05, * p-v alu e<0 .1