2018
Automatic incident detection
Lakshay Ahuja
Iowa State University
Follow this and additional works at:
https://lib.dr.iastate.edu/etd
Part of the
Computer Sciences Commons
This Thesis is brought to you for free and open access by the Iowa State University Capstones, Theses and Dissertations at Iowa State University Digital Repository. It has been accepted for inclusion in Graduate Theses and Dissertations by an authorized administrator of Iowa State University Digital Repository. For more information, please [email protected].
Recommended Citation
Ahuja, Lakshay, "Automatic incident detection" (2018).Graduate Theses and Dissertations. 16779.
by
Lakshay Ahuja
A thesis submitted to the graduate faculty
in partial fulfillment of the requirements for the degree of MASTER OF SCIENCE
Major: Computer Science
Program of Study Committee: Samik Basu, Major Professor
Anuj Sharma Soumik Sarkar Gurpur Prabhu
The student author, whose presentation of the scholarship herein was approved by the program of study committee, is solely responsible for the content of this thesis. The Graduate College will ensure this thesis is globally accessible and will not permit alterations after a degree is conferred.
Iowa State University Ames, Iowa
2018
TABLE OF CONTENTS Page LIST OF TABLES . . . iv LIST OF FIGURES . . . v ACKNOWLEDGEMENTS . . . vi ABSTRACT . . . vii CHAPTER 1. INTRODUCTION . . . 1 1.1 Problem Statement . . . 3 1.2 Contributions . . . 3 1.3 Organization . . . 4
CHAPTER 2. REVIEW OF LITERATURE . . . 5
2.1 Performance Measures . . . 6
2.1.1 Detection Rate (DR) . . . 6
2.1.2 False Alarm Rate (FAR) . . . 6
2.1.3 Mean Time To Detect (MTTD) . . . 7
2.2 Statistical Algorithms . . . 7
2.2.1 Standard Normal Deviate (SND) . . . 7
2.2.2 Inter-Quartile Distance (IQD) . . . 9
2.3 Pattern Recognition Classifiers . . . 11
2.3.1 Decision Trees . . . 11
2.3.3 Entropy Impurity Index and Information Gain . . . 13 2.3.4 Random Forests . . . 14 2.4 Our Approach . . . 15 CHAPTER 3. METHODOLOGY . . . 18 3.1 Data Collection . . . 18 3.2 IQD Algorithm . . . 19
3.3 Decision Tree Algorithm . . . 22
3.4 Random Forests Algorithm . . . 23
CHAPTER 4. EXPERIMENTS AND RESULTS . . . 26
4.1 Experiments . . . 26
4.1.1 Data Sets . . . 26
4.1.2 Experiment 1: IQD algorithm on Speed Data . . . 27
4.1.3 Experiment 2: IQD algorithm on Speed and Occupancy data . . . 28
4.1.4 Experiment 3: Decision Trees . . . 28
4.1.5 Experiment 4: Random Forest Trees . . . 29
4.1.6 Comparison of the algorithms . . . 29
CHAPTER 5. TIMELI - INTELLIGENT TRANSPORTATION SYSTEM . . . 31
CHAPTER 6. CONCLUSION . . . 33
6.1 Overview of Contributions . . . 33
6.2 Future Work . . . 33
LIST OF TABLES
Page
Table 2.1 Mango Dataset . . . 12
Table 4.1 Sample Sensor Occupancy and Speed data for different wavetronix sensors in Iowa . . . 27
Table 4.2 Sample dataset for the congestion data . . . 27
Table 4.3 Experiment 1 Results . . . 27
Table 4.4 Experiment 2 Results . . . 28
Table 4.5 Experiment 3 Results . . . 29
Table 4.6 Experiment 4 Results . . . 29
LIST OF FIGURES
Page
Figure 1.1 Congestion on I-74 . . . 2
Figure 2.1 Mean Speed of Historical Data vs Single Day Speed . . . 8
Figure 2.2 SNDs calculated by (7) for all different links for 5-minute period of each day. [Source (7)] . . . 9
Figure 2.3 IQD Speeds vs SND Speeds . . . 10
Figure 2.4 A node of a decision tree . . . 12
Figure 2.5 Decision tree to classify a mango as Sweet and Not-Sweet . . . 13
Figure 2.6 IQD Limiting Values for Speed and Occupancy both . . . 16
Figure 2.7 Speed patterns for different days . . . 17
Figure 2.8 Occupancy patterns for different days . . . 17
Figure 3.1 INTRANS generated alerts for congestion detected on I-74 . . . 19
Figure 3.2 Study region for this research . . . 20
Figure 3.3 Varying speed patterns for different period of the day . . . 21
Figure 3.4 Algorithm Flow to detect congestion using IQD method using only speed. . 22
Figure 3.5 Algorithm Flow to detect congestion using IQD method using speed and occupancy. . . 25
Figure 5.1 TIMELI 3 Monitor View Layout . . . 31
ACKNOWLEDGEMENTS
I would like to take this opportunity to express my thanks to those who helped me with aspects of conducting research and writing of this report.
I would like to express my gratitude to Dr. Anuj Sharma for his guidance and support through-out the course of this research, and to Dr Samik Basu for guiding me on how to conduct research. I would also like to thank my committee members Dr. Gurpur Prabhu and Dr.Soumik Sarkar for their help and support.
ABSTRACT
Congestion has become a major threat to a country’s economy. It not only causes loss in terms of man-hours and fuel costs, but also causes frustration among the public. It has become important for traffic operators to clear off congestion in a timely manner to resume the normal flow of traffic. This research focuses on evaluating congestion detection algorithms to implement them in an Intelligent Transportation System to detect congestion in real time. We have evaluated statistical based algorithms as well pattern recognition based algorithms to detect non-recurrent congestion on I-74, Davenport, Iowa, USA. Inter-Quartile Distance based algorithms and Supervised Learning based Decision Tree and Random Forest Classifiers are compared and evaluated in this study.
CHAPTER 1. INTRODUCTION
Economy of a nation depends heavily upon its normal transportation flow with people travelling to and from work, services and merchandise being rendered on time, and residents being connected to business and markets (22). Any disruption in the normal traffic flow or in other words any congestion events not only hampers a country’s growth in terms of loss of man hours and fuel costs but also cause major frustrations among the public. U.S. Department of Transportation (USDOT) defined congestion as one of the single largest threats to the Nations economic prosperity and way of life (1). The cost of congestion for the top 471 urban areas of United States was calculated to be around $160 billion, which included 6.9 billion hours of wasted time and 3.1 billion gallons of wasted fuel (2). Furthermore, a 2007 study (3) showed that the implementation of improved traffic management procedures in 272 out of 439 urban areas resulted in reduction of 143.3 million hours of incident-related congestion and $3.06 millions in cost. With growing number of vehicles on road, it has become very important to detect congestion and clear it off. This study explores mechanisms to automatically detect traffic congestion on US Interstates. On interstates, any flow of traffic in which the speed drops below 45 mph can be considered a traffic congestion (11).
Traffic congestion can be broadly divided into two categories Recurrent and Non-Recurrent
Congestion. Recurrent congestion can be defined as the usual congestion a person experiences on a daily basis, usually during peak hours in the morning and evening. The peak hours vary differently for different interstates, depending upon the most frequently travel times, business undertaken on the road etc. For example an interstate connecting two cities might experience congestion during the morning and evening time when people travel to and from office and an interstate connecting 2 states might experience recurring congestion during the night time as more and more trucks travel between states to deliver different services. Non-recurrent congestion can be defined as the extra travel delay caused by unexpected incidents like traffic accidents, lane blockage, debris, road work,
bad weather etc. Because of the randomness of non-recurrent congestion, it becomes hard to know about this congestion beforehand. Therefore, although authorities can make policies and contain the effects of recurring congestion, it becomes difficult to address non-recurrent congestion.
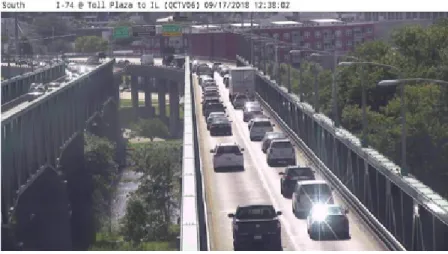
Figure 1.1: Congestion on I-74
A number of congestion detection algorithms have been proposed since the early 1970s (4) (5) (6). These algorithms have depended upon traffic flow theory and statistical analysis of historical data, pattern recognition and more recently artificial intelligence (7). This research work focuses on detecting non-recurrent congestion in which the speeds and occupancy patterns vary from the historical speed and occupancy patterns. Any reference to detection of congestion in this report refers to detection of non-recurring congestion. Figure 1.1shows a typical congestion on Interstate-74 in Davenport, Iowa. I have evaluated and improved Inter Quartile Distance (IQD) algorithm (8) (9), and tested Decision Tree and Random Forest Classifiers to automatically detect congestion on Interstate I-74, Davenport, Iowa. This algorithm is implemented in the TIMELI (10) software, which is being developed by us at Institute of Transportation (INTRANS), Iowa State University (ISU). TIMELI already has a congestion detection module which detects congestion using an IQD method proposed by Pranamesh et al. (8).
Various research has been done on real-time speed and volume data produced by electronic sensors placed on road and through image analysis of traffic images produced by camera on various
intersections. Various algorithms like SND, IQD, MAD, STSS have been proposed to detect con-gestion using the speed and occupancy data. In this study, we explore IQD algorithms which are based on SND and Classification algorithms like Decision Trees and ensemble learning algorithm like Random Forest Trees to detect congestion. IQD algorithm is being used in TIMELI to detect incidents and in this research, we improve the implemented IQD algorithm by using the ’occupancy’ feature along with speed feature of the data feeds. Currently, only speed feature of the traffic data feeds has been tested and used in TIMELI. We also evaluate a congestion detection algorithm using Decision Trees and Random Forests and compare these algorithms.
1.1 Problem Statement
In this research, our problem statement is to find an algorithm to effectively detect congestion on US Interstates. We focus on finding a better algorithm to detect congestion on roads as com-pared to already implemented algorithm in TIMELI. Our problem formulation is two-fold a) We evaluate and improve an unsupervised learning algorithm to detect incidents in real time. We need unsupervised algorithms in cases we dont have historical data for congestion delays on specific roads to train supervised learning models. b) We train and evaluate supervised classification algorithms based on Decision Trees and Random Forests to automatically detect congestion, by using historical speed, occupancy, volume and congestion data. These algorithms are implemented in TIMELI to show congestion detection in real time.
1.2 Contributions
One of our contributions in this research is to improve an already implemented IQD algorithm in the TIMELI software. We do this by using the occupancy feature of the road segments along with the already used speed feature. Next, we implement decision tree classifier and random forest classifier to detect congestion on roads. We compare the accuracy of unsupervised and supervised
algorithms and implement the best algorithm in an ITS to detect incidents in real time. To
1. Improve an already implemented unsupervised algorithm in an ITS developed by us in IN-TRANS.
2. Compare the performance of supervised and unsupervised learning algorithms on the same dataset.
3. Develop an ITS software to detect incidents in real time.
1.3 Organization
This thesis is organized as follows:
Chapter 2 explains the concepts of SND, IQD, Decision Trees and Random Forests and discusses the previous work done to detect congestion using these models.
In Chapter 3, we discuss our methodology implemented to detect congestion using these algo-rithms.
In chapter 4, we present and compare our results.
Chapter 5 concludes the results and outcome of the thesis, and also discuss the future course that can be taken in continuation of this work.
CHAPTER 2. REVIEW OF LITERATURE
Early detection of traffic congestion can reduce the impact of congestion in form of lesser number of secondary crashes and reduction in travel delays. Since 1960s, automatic congestion detection algorithms have seen a number of advancements (12). However, high false alarm rates and complex calibration procedures have made these algorithms ineffective and not useful (10) (13). Due to these factors, the Traffic Management Centers, for a long time depended upon human-based incident detection methods which include phone calls, passing motorists, and first responder patrols (14) (15). However, around 17% of freeways often experience congestion levels at or above capacity, and with the increasing size of freeway transportation networks which human-based resources are incapable of monitoring, there is a new shift of focus to AID (Nowakowski et al. 1999).
In the past few decades, there have been various algorithms developed to automatically detect congestion on roads. These include statistical algorithms, pattern-based algorithms, and more recently artificial intelligence-based algorithms.
Statistical algorithms make use of the probe data collected through electronic sensors to de-tect deviations in the speed and occupancy patterns of particular road segments. Some of these algorithms include Standard Normal Deviate (SND) (7), Bayesian Algorithms (4) (16), and IQD denoising based algorithms (8) (9). In TIMELI, I have implemented IQD based congestion de-tection algorithm (explained in Section 2), and I will be evaluating and improving the use of this algorithm in this research.
Pattern recognition-based algorithms try to classify a traffic pattern as a congestion or a non-congestion based on the identification of patterns of some features associated with non-congestion and
non-congestion. Decision Tree based California algorithms developed as early as 1960s and 1970s
(16) (17) fall in this category. In this research, we have tried to improve these algorithms with the use of Random Forests which is an ensemble learning technique making use of decision trees.
Artificial Intelligence based algorithms make use of artificial neural networks (18), convolu-tional neural networks (19) and wavelet transformations (20) among others. Although artificial intelligence-based algorithms have shown promise, studies (21) (22) (23) have shown that pattern recognition-based algorithms such as decision trees perform better than neural networks on the real-world datasets.
In this research, we have focused on statistical and pattern recognition-based algorithms and we will discuss about these algorithms in detail in this section. In addition to these algorithms, it is im-portant to understand the performance measures to evaluate these algorithms. These performance measures are discussed next in this section.
2.1 Performance Measures
2.1.1 Detection Rate (DR)
Detection Rate is defined as the ratio of total congestion events detected to the total number of actual congestion events. A high detection rate implies a good congestion detection algorithm. Equation 2.1 mathematically summarizes the detection rate
DR= Total numbers of congestion events detected
Total number of actual congestion events. ∗100 (2.1)
2.1.2 False Alarm Rate (FAR)
False Alarm Rate (FAR) is defined as the ratio of the number of congestion events detected which were not actual congestion events to the total number of inputs given to the algorithm. Equation 2.2 summarizes the definition of FAR
F AR= Total number of false alarm cases
2.1.3 Mean Time To Detect (MTTD)
MTTD is defined as the total time used to detect incidents to the total number of incidents detected. Equation 2.3 represents the MTTD
M T T D= Total time used to detect incidents
Total number of incidents detected.∗100 (2.3)
2.2 Statistical Algorithms
Statistical algorithms use speed and occupancy probe data to detect deviations in the speed and occupancy patterns of particular road segments. These algorithms rely upon the mean and median values of these historical time-series data to detect any deviation in the real-time data stream. Some of these algorithms include SND, IQD and Bayesian Algorithms. In this paper we focus on IQD algorithm, which is derived from SND.
2.2.1 Standard Normal Deviate (SND)
Standard Normal Deviate can be defined as the difference of a variable from its mean divided by the standard deviation. It can be mathematically represented by Equation 2.4.
|xk−x0|
σ > c (2.4)
where xk is the real-time data stream value, x0 is the mean of the data stream taken over a
period of time,σ is the standard deviation, and c is the limiting value or threshold. x0 +cσ would
represent the threshold speed in this equation.
If the SND is more than the limiting value or threshold, then the variable is said to deviate from the normal pattern of the dataset. SND was first proposed by Dudek et. al (4) and was implemented by Texas Transportation Institute. Dudek et al. (4) reported a congestion detection rate of 92% and a false alarm rate of 1.3% during the peak periods (7). (7) found that SND was able to detect a very high percentage of non-recurrent vehicle congestion in an interstate test corridor. A limiting value of 1.5 was chosen in this research, and SND for every 5-minute period for
everyday was calculated (Figure 2.2). All speeds less than the SND computed thresholds speeds are
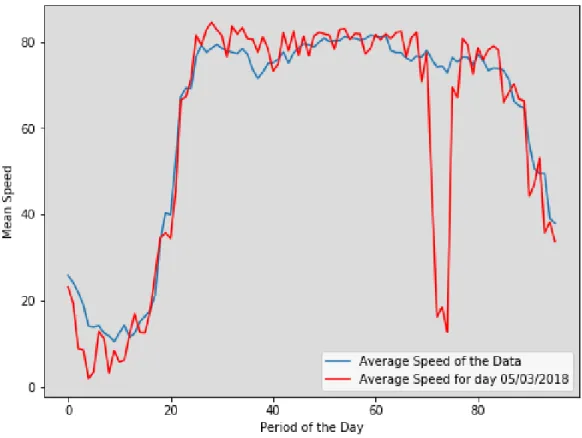
considered to be non-recurrent congestion. Figure 2.1represents a graph of mean speed computed
for 15-minute period for the dataset spanning May 18 to June 18 vs mean speed computed for 5-minute period for a single day for a single sensor. A sudden drop in the mean speed for a single day over 5:45pm to 7:00pm (period 71-76) would be considered a non-recurrent congestion if it is less than the allowed threshold speed limit for SND speed values. Balke et al (24) conducted similar research using the SND algorithm to detect outliers (traffic incidents) in the traffic data stream to find incident free travel time conditions.
Figure 2.1: Mean Speed of Historical Data vs Single Day Speed
Although SND produces good detection rates and low false alarm rates, it is impacted heavily by the presence of outliers (8). Outliers can inflate the standard deviation values resulting in lower threshold values and thus, lower detection rates. This phenomenon is called masking. A solution is to remove all the data related to congestion events before calculating the mean and standard
Figure 2.2: SNDs calculated by (7) for all different links for 5-minute period of each day. [Source (7)]
deviation. But this is a case of semi-supervised learning and is impossible when incident related data is not present. Pranamesh et al. (8) proposed an algorithm based on Inter-Quartile Distance (IQD), which is an alternative derived from SND algorithm which removes the masking effect of SND algorithm and produces higher detection rates.
2.2.2 Inter-Quartile Distance (IQD)
As stated above, SND is prone to outliers that can result in high standard deviations, resulting in lower detection rates. To solve this problem, Pranamesh et al. (8) (9) used an Inter Quartile Distance based method, which do not suffer from masking problem, to detect congestion. In IQD, instead of mean value of the historical data stream, median is computed and instead of standard
deviation, IQD score is taken as the measure of variation from normal pattern. IQD can be
mathematically represented by Equation 2.5.
|xk−x
0
where xk is the current data stream, xis the median of the data stream taken over a period of time, is the Inter-Quartile Score, and c is the limiting value or threshold. x+cQwould represent the threshold speed in this equation.
Inter-Quartile Score Q, can be defined as
Q= x<0.75>−x<0.25>
1.35 (2.6)
where, x0.75 is the upper quartile representing the 75th percentile and x0.25 is the lower quartile
representing the 25th percentile. We have used the constant 1.35 to make the equation unbiased estimator of standard deviation. This value is used by Pranamesh et al. in (9).
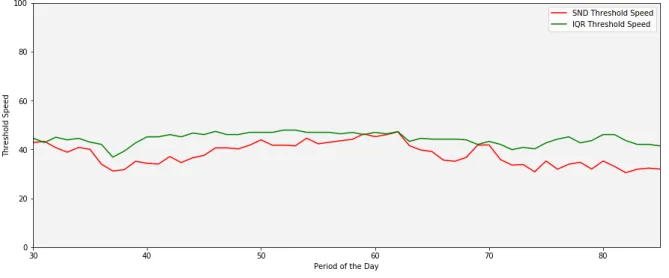
Figure 2.3: IQD Speeds vs SND Speeds
If the IQD Score for a variable is less than the limiting value or threshold, then variable is said to deviate from the normal pattern of the dataset. As noted in (8), IQD method do not suffer the problem of masking suffered by SND method, but they suffer from a different phenomenon called swamping. If more than 50% of the values of the data stream are same, there are high chances that x0.75 and x0.25 values are equal. This would make the Qvalue zero. Thus, any speed value,
different than the median value, will be considered a non-recurrent congestion. This will result in high number of False Alarm cases. This phenomenon in which the IQD score becomes zero is known as swamping. However, according to FHWA, a necessary condition for congestion is that
the average speed should be less than 45 mph, thus congestion would never be reported in cases where IQD score is zero and speeds are more than 45 mph.
As mentioned in the section above, IQD do not suffer from the masking. This results in improved False Alarm Rates and comaparable Detection Rates as compared to SND based algorithms. We have used IQD-based approach in our study.
2.3 Pattern Recognition Classifiers
2.3.1 Decision Trees
A decision tree is structure-based predictor, that predicts a class associated with an instance of a dataset. It is based on a sequential decision process which starts at the root node of the tree to a leaf node, where the leaf node is a target class. At each node, the tree splits the dataset into different branches based on a set of splitting rules, where each branch contains similar data points, or in other words, a node divides the data points in different branches, reducing the dissimilarity of the data. This process repeats itself until a leaf node is reached, which represents data points which cannot be separated any further based on any dissimilarity or any splitting rule. These data points are assigned a class.
To understand decision trees, let us take a dataset X, such that,
X ={x1, x2, x3· · ·, xn}wherexi∈Rm
where xi is a dataset consisting of m features. Each feature is evaluated and compared against
a threshold value at a tree node based on which a branch is selected, and next feature is evaluated
in the next node. This procedure continues until the leaf node is selected. Figure 2.4represents a
node of a decision tree.
For example, lets say we are given a dataset for mangos where we have to classify if a mango is sweet or not. The dataset is represented by Table 2.1, where color and soft are the features of the dataset and sweet is the class or the label value.
Figure 2.4: A node of a decision tree
Table 2.1: Mango Dataset
Color Soft Type
Yellow Yes Sweet
Other No Not Sweet
Yellow No Not Sweet
Other No Not Sweet
Other Yes Not Sweet
Yellow Yes Sweet
Yellow No Not Sweet
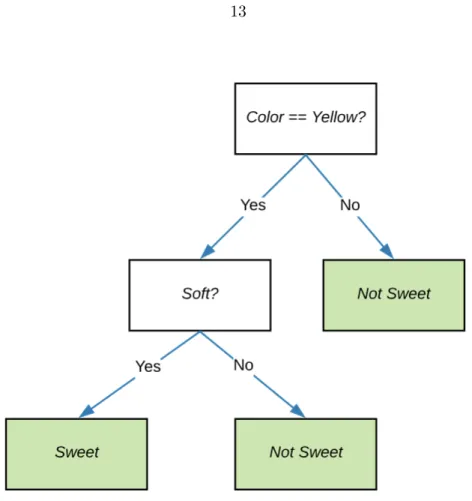
To check if the mango is sweet or not, the decision tree first checks the color of the mango. If the color is not yellow, the decision tree classifies it as not-sweet. If the color is yellow, the decision tree further checks the softness of the mango. If it is soft, the decision tree classifies it as sweet, otherwise the mango is classified as not-sweet. As clear from the diagram, the decision trees are very easy to interpret and work in the same way as human logic does.
2.3.2 Impurity Measures
Decision tree tries to best separate the data at each node, that is, it tries to separate the data based on the features that minimize the number of decision steps in the tree. This process is based on the concept of impurity, in which, the decision tree tries to select a feature so that to minimize
Figure 2.5: Decision tree to classify a mango as Sweet and Not-Sweet
the impurity (dissimilarity) in the dataset in the subsequent steps. At the end of the decision tree, leaf nodes represent a class which contains all the similar data points.
2.3.3 Entropy Impurity Index and Information Gain
We would define a measure called entropy that measures the impurity of a collection of data points. In other words, entropy is the measure of how similar or dissimilar the data points are from
each other. Lets take a dataset S, and let c be the number of target classes, the entropy of S is
defined as Entropy(S) =− c X i=1 pilnpi wherepi is the proportion of S belonging to class i(23).
Next, we define the Information Gain measure of an attribute A. Information Gain is the
expected reduction in entropy caused by partitioning the dataset according to the attributeA. Let
Sv be a subset of S, for which the attribute A has value v. Let value (A) be the set of all values for attributeA. Information Gain (S, A) is defined as
Gain(S, A) =Entropy(S)− X v∈value(A)
|Sv|
|S|Entropy(Sv),
The decision tree first selects the attribute from which the information gain is the maximum. Decision Trees are used effectively for classification purposes. They have been used in traffic congestion classification since 1970s. Payne and Tignor (17) developed a series of classification algorithms, called California Algorithms, to detect and classify congestion based on decision trees. They used occupancy feature of the data feeds generated by electronic sensors to classify a traffic state as congestion or non-congestion event. S. Chen et al. (23), Chong M. (26), R. Sujatha (22) used decision trees to classify and detect traffic congestion and accident. These studies also compared the performance of decision trees to that of state-of-the-art machine learning algorithms based on neural networks and found that decision trees performed better than Neural Networks to detect congestion.
In our research, we have used decision trees to detect incidents on the selected road segments. Input features such as volume, occupancy and speed were provided to the classifier with target class as congestion and non-congestion. The detection rate and false alarm rate of the decision tree has been compared with that of IQD algorithm which is an unsupervised learning algorithm.
2.3.4 Random Forests
Random Forest is a classifier which is a set of decision trees, where each tree is constructed by selecting random samples from the training set. Instead of trying to find the best choice for a single decision tree, a random subset of features is selected for multiple trees. The result is a set of different classifiers based on randomly selected training data, each of them producing a different prediction.
There are two approaches to interpret the results. One approach is to select the prediction based on the majority vote, that is, the most voted prediction is considered correct. The other approach is to average the results of all the classes. Although, these two approaches are different in theory, in real-world cases, the average of the predictions is not very different from the majority of predictions, therefore, the results of both these approaches is often comparable.
Dogru N. (28) used Random Forests to classify traffic accidents, which cause non-recurrent congestion. They used position and velocity value features of the traffic data feeds to analyze the traffic patterns and detect anomalous patterns. Performance of Random Forests was compared with other machine learning algorithms such as Artificial Neural Networks (ANN), and Support Vector Machines(SVM). The study found that Random Forests perform better with 91.56% accuracy as compared to SVMs and ANNs which had 88.71% and 90.02% accuracy respectively.
Walaa Alajali et al. (29) analyzed the performance of ensemble learning models such as Gradient Boosting Regression Trees, Random Forests and Extreme Gradient Boosting Trees to train traffic prediction models, and found that the performance of all three algorithms was comparable with random forests taking the least mean time to predict traffic conditions.
Other research works (30) (31) have evaluated the performance of Random Forests and com-pared them with other machine learning models such as AdaBoost and SVMs (30). In this research, we have used volume, occupancy and speed of the historical traffic feeds along with calculated fields such as median speed and median occupancy along with period of the day as input features to eval-uate the performance of Random Forests on our dataset.
2.4 Our Approach
Both SND and IQD algorithms have their limitations. SND suffers from the problem of masking, which prevents it from detecting certain outliers thus, causing certain congestion events to remain undetected. It performs well in terms of low False Alarm Rate. To solve the problem of masking, IQD method to detect congestion was used by Pranamesh et al. (8). Although, this method
produces high detection rates, it classifies some non-congestion events into congestion events, thus causing a high False Alarm Rates.
To solve the problem of high False Alarm Rates in IQD method, we used an extra feature of occupancy of the road along with the speed feature of the data stream. Our intuition was that when there is congestion reported on the roads, along with reduced speeds, there is an abnormal increase in the occupancy on the road.
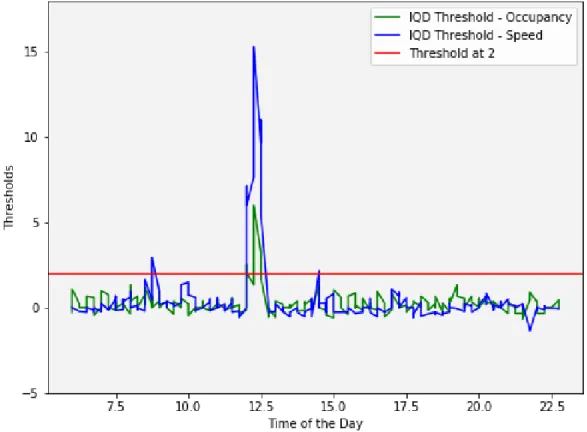
Figure 2.6: IQD Limiting Values for Speed and Occupancy both
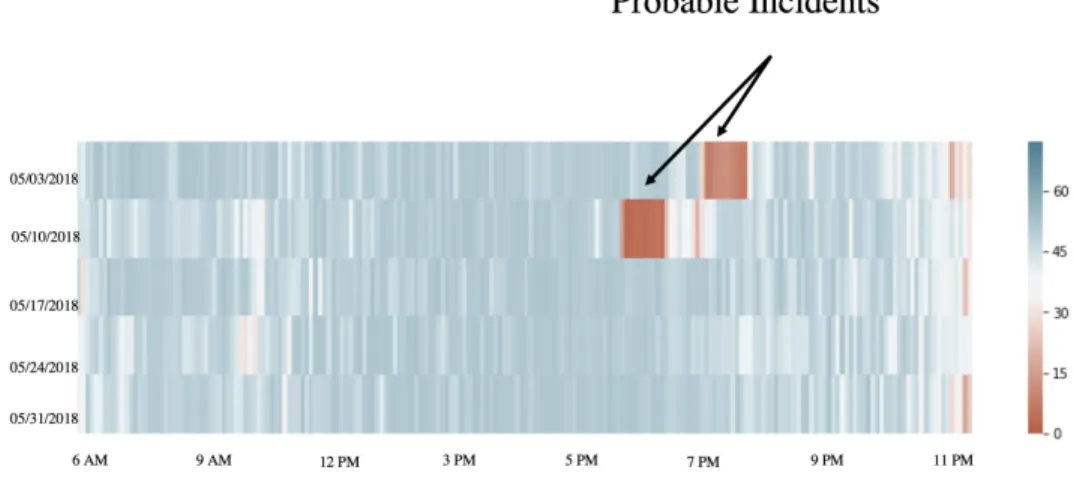
IQD method is an unsupervised learning algorithm. It depends upon a threshold factor which is determined empirically. As different sections of the road experience different traffic patterns on different periods of the day, different day of the week, this threshold factor is theoretically different for different sections on different period of the day, different day of the week. Abnormal speed and occupancy patterns for a period of a day can be considered potential incidents. Therefore, we have evaluated a supervised congestion detection algorithm using decision trees and random forests for
the cases when historical incident data is present. To solve the problem of detecting congestion in real time, we have further implemented these models in an Intelligent Transportation Software developed by us to detect congestion using real time data feeds.
Figure 2.7: Speed patterns for different days
CHAPTER 3. METHODOLOGY
This section describes the methodology used for automatic congestion detection on roads. This research focuses on both unsupervised and supervised algorithms to detect congestion. As discussed earlier in this report, unsupervised models are required for the areas where no historical congestion data is present, or the data cannot be relied upon. Supervised learning models are trained to evaluate their performance in comparison to unsupervised learning algorithm to find out the better learning model.
3.1 Data Collection
The data for this research was collected from two sources. The sensor speed and occupancy data were collected through Iowa Department of Transportations wavetronix sensors. Iowa DOT has over 500 wavetronix sensors functioning across Iowa (25). These wavetronix sensors produce real-time traffic probe data every 20 seconds. INTRANS collects these streams every 20 seconds for all the sensors and stores them in an archived storage.
The data for congestion on the test sensors was collected through the INTRANS Congestion Alert System. INSTRANS has an automatic alert module that sends alerts in case of any congestion detected on the roads where these sensors are places. The alert has the location and time of the
congestion as well as a real-time imagery of the road. Figure 3.1 gives an example of alerts
generated by INTRANS for congestion reported on I-74.
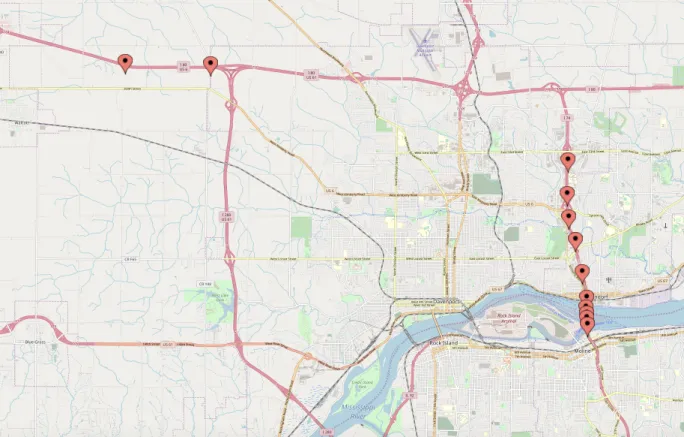
The speed and occupancy data along with congestion data was collected for 10 sensors and
models were built on those sensor data for this study. Figure 3.2 shows the study-region for this
Figure 3.1: INTRANS generated alerts for congestion detected on I-74
3.2 IQD Algorithm
Non-recurrent congestion can be considered as an outlier/anomaly to the normal traffic flow. These anomalies can be predicted by developing statistical models using the historical traffic data. Any deviation from the normal traffic pattern predicted by these models can be considered as an anomaly. In this study, we have investigated and improved the IQD algorithm for anomaly detection, described by Pranamesh et al. (8), (9) by using occupancy feature of the traffic data stream along with the speed feature. IQD is explained in the literature review section of this report. The speed and occupancy patterns of traffic differ by period of the day and day of the week
(Figure 3.3). For this reason, we divided a day into 96 15-minute periods (similar to studies
(18), (24)). Median speeds and median occupancy values and Inter-Quartile scores for speed and occupancy were computed for these 15-minute periods for each day of the week using MapReduce
Figure 3.2: Study region for this research
jobs written in Apache Pig Latin. This was done for each sensor used in this study. For this study, we have used a limiting value of 2, same as used by Pranamesh et al. in (8), (9).
For the real-time data streams, we compared the speed and occupancy values with the IQD threshold values. If the speed of the real-time data stream is less than the IQD threshold speed and occupancy is more than IQD threshold occupancy, we consider it a probable congestion event. (8), (9) detects a congestion when speed values are lower than the threshold values. In (8) the current speed is compared against the IQD threshold speed every minute. If real-time speeds are less than the IQD threshold speed for continuous 3 minutes, then the algorithm considers it a congestion. Once the congestion is detected, the study algorithms requires real-time speed values for continuous 5 minutes to mark the congestion cleared. For example, say for a period of the day, day of the week, threshold speed is 40 mph. If the algorithm receives a threshold speed less than 40 mph continuously for 3 minutes, the algorithm considers it a congestion. After the
Figure 3.3: Varying speed patterns for different period of the day
congestion is detected, if the algorithm receives speeds more than 40 mph for continuous 5 minutes, the congestion would be marked clear. In this case, if the sensor is reporting faulty speeds of less than 40 mph intermittently, the congestion would not be marked clear even if the majority of the speeds reported are more than 40 mphs but they are not reported continuously for 5 minutes.
In our study, we defined congestion as an event when 5-minute median speed values are lower than the threshold speed values and 5-minutes occupancy values are higher than the threshold occupancy values. We compute 5-minutes median values of real-time speed and occupancy data and compare it with the threshold values of the period. Thus, our algorithm needs to compare congestion values every 5 minutes and handles intermittent erroneous data in most of the cases. We compared the detection rate and false alarm rates of our algorithm as compared to algorithm used in (8), (9). Using occupancy feature along with the speed feature reduced the False Alarm Rate while maintaining a comparable detection rate. The results of this method are described in
Figure 3.4: Algorithm Flow to detect congestion using IQD method using only speed.
3.3 Decision Tree Algorithm
Non-recurrent congestion detection can be considered as a classification problem where each traffic feed for a given location can be considered as a non-recurrent congestion event or a normal event based on some existing data. Decision trees learn the model from the historical datasets and classify the new data items into pre-defined classes. Decision trees are known to work well with large datasets and perform well in real-time classification of incoming data streams (27).
To evaluate the performance of decision trees, the congestion dataset is partitioned into Con-gestion and Non-ConCon-gestion Classes, where Non-ConCon-gestion Class is the collection of normal traffic
flow and recurrent congestion events. Using speed,volume and occupancy data as feature set and congestion/non-congestion classes as target features, a decision tree classifier is constructed and trained. The objective of this classifier is to detect and separate the patterns of non-recurrent congestion events. The testing dataset is used to test the accuracy, detection rate and false alarm rate of this decision tree classifier.
The input features provided to the decision tree classifier were period of the day, day of the week, volume, occupancy, speed, median speed and median occupancy. The decision tree chooses the best features based on the information gain and entropy explained in literature review section. This data is labeled with congestion and non-congestion classes. To test the data, only the unlabeled input features are provided to the decision tree and the classifier classifies them into congestion and non-congestion classes.
The procedure for Decision Tree Classifier can be summarized as follows −
• Input Vector: N-Dimensional Vector (x: period of the day, day of the week, volume,
occu-pancy, speed, median speed and median occupancy)
• Output Vector: A predictor (y: congestion or non−congestion)
• Step 1: Divide the input dataset into training data (80%) and test data (20%)
• Step 2: Provide Parameters for the Decision Tree : Impurity Measure - Entropy.
• Step 3: A decision tree is generated in this step using the training dataset from Step 1. • Step 4: A predictor is generated that classifies the class as congestion or non-congestion. This classifier is tested with the test data. The evaluation of Decision Tree Classifier is described in next chapter.
3.4 Random Forests Algorithm
Random Forest is an ensemble of Decision Trees. Instead of depending upon a single decision tree, Random Forests takes an average of the outputs of multiple Decision Trees. The input features
used for Random Forests Classifier were period of the day, day of the week, volume, occupancy, speed, median speed and median occupancy. Random Forests selects a random number of data points from the training set and constructs a fully grown decision tree. This step is repeated forC
number of decision trees where C is 50 in our study.
The procedure for this method can be summarized as follows −
• Input Vector: N-Dimensional Vector (x: period of the day, day of the week, volume,
occu-pancy, speed, median speed and median occupancy)
• Output Vector: A predictor (y: congestion or non−congestion)
• Step 1: Divide the input dataset into training data (80%) and test data (20%)
• Step 2: Provide Parameters for the Random Forest Trees - Number of Trees - 50, Impurity
Measure - Entropy.
• Step 3: In this step, Random Forest selects random number of data points from the training
set.
• Step 4: A decision tree is generated in this step using the dataset selected in Step 3.
• Step 5: Repeat Step 2 and Step 3 until the number of decision trees constructed is 50.
• Step 6: 50 output values are averaged to select the final output. As this is a binary classifier with output as either congestion or non-congestion, the mode of the 50 outputs would be the final output.
This classifier is tested with the test data. The evaluation of Random Forest Classifier is
CHAPTER 4. EXPERIMENTS AND RESULTS
In this section, we will present the congestion detection experiments performed and results obtained from those experiments
4.1 Experiments
4.1.1 Data Sets
The datasets used in this study comprise of traffic speed and occupancy data, and congestion data from Interstate Freeways I-74 of the Davenport region, in Iowa, USA. The traffic speed and occupancy data is provided by wavetronix sensors maintained by Iowa Department of Transporta-tion, which maintains more than 500 wavetronix sensors across Iowa (25). The data from these sensors can be collected through an open feed public API, that provides fresh data in every 20 sec-onds. Institute of Transport, Iowa State University, has developed modules to collect and archive this data. For this study, the wavetronix data for the months of May 2018 to September 2018 was used which was around 100 GB in size. To extract information about particular sensors from this
large dataset, MapReduce jobs written in pig scripts were executed. Table 4.1represents a sample
dataset for the extracted wavetronix speed and occupancy data.
The congestion data was collected for the I-74 through the alerts sent by INTRANS, ISU. INTRANS sends alerts of any congestion reported along the roads and maps the congestions to the
sensors placed on the road at the location of the congestion. Table 4.2represents a sample dataset
for the congestion data.
The speed, volume and occupancy data, along with congestion data was used for training and testing of the model. For training, 80% of the dataset was used, and testing of the models was done on 20% of the dataset.
Table 4.1: Sample Sensor Occupancy and Speed data for different wavetronix sensors in Iowa
Sensor Date Start Time End Time Occupancy Speed
I-74 from North Tower to South 20180505 173240 173300 8 86
I-74 from South Tower to Toll 20180505 173240 173300 23 84
I-74 from Toll Plaza to 1st A 20180505 173240 173300 7 81
I-74 from 1st Ave to 4th Ave 20180505 173240 173300 15 98
I-74 from Lincoln to Holmes 20180505 173240 173300 3 114
QCDS-22-EB 20180505 173240 173300 1 114
QCDS-19-EB 20180505 173240 173300 2 135
I-74 from 1st Ave to 4th Ave 20180505 173240 173300 0 77
Table 4.2: Sample dataset for the congestion data
Alert SMS sent Day Name End Time Start Time Sensor Name
TRUE Sunday 4/29/18 12:48 4/29/18 12:30 QCDS04-EB
TRUE Monday 10/8/18 21:59 10/8/18 21:59 QCDS22-EB
TRUE Monday 10/8/18 21:31 10/8/18 21:31 QCDS01-EB
TRUE Monday 10/8/18 21:30 10/8/18 21:29 QCDS01-EB
TRUE Monday 10/8/18 20:20 10/8/18 20:15 QCDS22-EB
TRUE Monday 10/8/18 17:37 10/8/18 17:36 QCDS11-Eb
TRUE Monday 10/8/18 17:34 10/8/18 17:16 QCDS10-EB
TRUE Monday 10/8/18 17:00 10/8/18 16:59 QCDS19-EB
4.1.2 Experiment 1: IQD algorithm on Speed Data
The first set of experiments were done on only speed data using the IQD algorithm. As men-tioned in Literature Review section, the TIMELI software used IQD algorithm on speed data to automatically detect congestion. Constant parameter of 2 (8) was evaluated in these experiments.
The results obtained from these experiments are summarized in Table 4.3.
Table 4.3: Experiment 1 Results
Predicted: NO Predicted: YES
Actual: NO 682 45
The Detection Rate of this method ranged from 91% to 94%. The False Alarm Rate ranged
from 3.8% to 5.4%. The Detection Rate and False Alarm Rate of results given in table 4.3 are :
Detection Rate = 93.80% and False Alarm Rate = 4.19%.
4.1.3 Experiment 2: IQD algorithm on Speed and Occupancy data
The second set of experiments were done on Speed and Occupancy data using the IQD
al-gorithm. The results obtained from these experiments are summarized in Table 4.4. Constant
parameter of 2 (8) was evaluated in these experiments. It can be noted that combining an ex-tra feature of occupancy reduces the false alarm rate, while maintaining a high and comparable detection rate, as compared to experiments done on only speed data.
Table 4.4: Experiment 2 Results
Predicted: NO Predicted: YES
Actual: NO 694 34
Actual: YES 33 337
The Detection Rate of this method ranged from 88% to 92%. The False Alarm Rate ranged
from 2% to 4%. The Detection Rate and False Alarm Rate of results given in above table 4.4are
: Detection Rate = 90.80% and False Alarm Rate = 3.09%.
Although including occupancy in the input provided to the IQD algorithm decreased the False Alarm Rates, it also decreased the detection rate of the algorithm. Still, the detection rates provided are better than the SND algorithm mentioned in the literature review section.
4.1.4 Experiment 3: Decision Trees
The third set of experiments were done on Speed, Occupancy and Volume data using the Decision Trees. For this, speed and occupancy data and congestion data were used to train the decision trees. The model was tested on testing data which comprised 20% of the dataset. Table
Table 4.5: Experiment 3 Results
Predicted: NO Predicted: YES
Actual: NO 5372 139
Actual: YES 28 689
The Detection Rate of this method ranged from 94% to 97%. The False Alarm Rate ranged
from 1% to 3%. The Detection Rate and False Alarm Rate of results given in table 4.5 are :
Detection Rate = 96.09% and False Alarm Rate = 2.23%.
4.1.5 Experiment 4: Random Forest Trees
The fourth set of experiments were done on Speed, Occupancy and Volume data using Random
Forest Trees. Table 4.6summarizes the results of these experiments.
Table 4.6: Experiment 4 Results
Predicted: NO Predicted: YES
Actual: NO 5376 135
Actual: YES 27 690
The Detection Rate of this method were equivalent to Decision Trees and ranged from 94% to 97% (same as decision trees). The False Alarm Rate ranged from 1% to 3% (same as decision
trees). The Detection Rate and False Alarm Rate of results given in table 4.6are : Detection Rate
= 96.23% and False Alarm Rate = 2.16%.
4.1.6 Comparison of the algorithms
The Detection Rates and False Alarm Rates of all the 4 experiments were compared. Supervised machine learning algorithms - Decision Trees and Random Forests were found to perform well as compared to Unsupervised regression algorithms such as SND and IQD. The comparison is provided by table 4.7.
Decision Trees and Random Forests performed better than IQD algorithm on Speed and Oc-cupancy data. Decision Trees and Random Forests are supervised learning algorithms. These
Table 4.7: Comparison Table for IQD, DT and RF Classifiers
IQD(Speed) IQD(Speed, Occupancy) Decision Trees Random Forests
Detection Rate 91% −94% 88% −92% 94%−97% 94%− 97%
False Alarm Rate 3.8%− 5.4% 2%− 4% 1%−3% 1%−3%
algorithm need already labeled data which is not available for every sensor. To collect this data, we developed an ITS to collect congestion and non-congestion data. The ITS detects the incidents using IQD algorithm, and then the operator can mark the detected incident as Congestion or False Alarm. This data can be utilized to train supervised learning algorithms. The architecture of the ITS is explained in the next section.
CHAPTER 5. TIMELI - INTELLIGENT TRANSPORTATION SYSTEM
TIMELI (Traffic Incident Management Enabled by Large-data Innovations) is an Intelligent Transportation System Software which implements machine learning algorithms to monitor traffic conditions in real time. This software is being developed by INTRANS to help traffic operators in Traffic Management Centers to detect and report an incident in a timely manner. The software displays the potential congestion or incidents detected through various algorithms on an interactive map interface with options for the traffic operators to take further actions. TIMELI has a unique
three monitor view layout - Map View, Camera View and Report View represented by figure 5.1.
Figure 5.1: TIMELI 3 Monitor View Layout
Map View represents the location of potential incidents marked on a map. It also provides alerts of these incidents in form of a list with more details and actions for the incidents. The nearest cameras for an incident are also displayed by this view. To verify the incident, an operator can
the live video feed of the road corridor for the camera selected. Once the incident is verified to be
true, the operator can select Report (Accept) option from the list (on map view) to open report
view to fill out details of the incident and alert concerned authorities. If the incident is verified to
be false, the operator can select the option on False Alarm (Figure 5.2) from the list to mark the
incident as false positive. In this way, TIMELI can help in early detection and sending alerts for the incidents, and also collects data in form of Detected Incidents and False Alarms. This data can be utilized to train supervised models in future.
CHAPTER 6. CONCLUSION
6.1 Overview of Contributions
We study the impact of iqd-based algorithm, decision tree, and random forests on real world speed and occupancy data generated through electronic sensors. Our objective is to find a algo-rithm that can classify a series of traffic feed into congestion and non-congestion. We experiment our algorithm with real world data for 10 different sensors with 5 months data for each sensor. We conclude that supervised machine learning algorithms - Decision Trees and ensemble learning algorithm Random Forests perform better that the unsupervised algorithms.
6.2 Future Work
1. Secondary Incidents - Many incidents cause congestions in upstream and downstream traffic. These incidents and congestion are called primary and secondary congestion respectively. This study can be further analyzed to match patterns in terms of duration and time of congestion to combine various sensors and thus improving the incident detection time by parallelization and reducing the detection of redundant incidents.
2. External Factors - Impact of external factors such as weather conditions can be combined with the speed and occupancy data to evaluate the impact on Supervised Algorithms. 3. Use of an algorithm depends upon the type of data used. Although, previous research has
established Decision Trees to better than other algorithms mentioned in literature review section, those algorithms can be tested on wavetronix data to evaluate their performance. 4. Sensor Fault Detection Quality of Speed and Occupancy feeds depends upon the quality of
the sensor. A faulty sensor would produce erroneous results. Although, taking mean and median of the dataset can handle intermittent fluctuations in the traffic feeds, this study
can be combined with sensor fault detection studies to evaluate the impact on congestion detection.
5. Incremental Training - In this research, decision trees are trained over whole set of data. Combining the results from the data collected from TIMELI, new models can be developed by training the models incrementally in mini-batches. Certain decision tree algorithms such as IDE4 and ID5R already exist which implement incremental training.
6. Supervised vs Unsupervised learning algorithms on large scale deployment - In this thesis, supervised algorithms are proven to work better than unsupervised algorithms to detect congestion detection. However, unavailability of training data sets and time taken to train supervised model are the major disadvantages of supervised learning. The impact of these factors can be further analyzed by evaluating these models on a large scale deployment.
REFERENCES
[1] Owens, N., A. Armstrong, P. Sullivan, C. Mitchell, D. Newton, R. Brewster, and T. Trego. Traffic Incident Management Handbook. FHWA-HOP-10-013, FHWA, U.S. Department of Transportation, 2010.
[2] Schrank, D., B. Eisele, T. Lomax, and J. Bak. 2015 urban mobility scorecard. Texas
Trans-portation Institute and INRIX, 2015.
[3] Schrank, D. L. and T. J. Lomax.The 2007 urban mobility report. Texas Transportation
Insti-tute, The Texas A&M University System, 2007.
[4] Dudek, C.L., Messer, C.J., Nuckles, N.B. (1974).Incident Detection on Urban Freeways,
Trans-portation Research Record, 495, TRB, Nation Research Council, Washington D.C.
[5] Dudek, C.L., Weaver, G.D., Ritch, G.P., and Messer, C.J. (1975).Detecting Freewat Incidents
Under Low-Volume Conditions, Transportation Research Record, No 533, pp. 34.
[6] Greene, C. S., Houpt, P. K., Willsky, A. S. and Gershwin, S. B. (1977). Dynamic Detection
and Identification of Incidents on Freeways Volume 3: The Multiple Model Method, ESL-R-766 Electronic Systems Laboratory, Massachusetts Institute of Technology, Cambridge, Mas-sachusetts.
[7] Andrew J. Sullivan, Virginia P. Sisiopiku, Bharat R. Kallem (2013).Measuring Non-Recurring
Congestion in Small to Medium Sized Urban Areas, University Transportation Center for Al-abama, UTCA Report Number 09201.
[8] Chakraborty P., Hess J., Sharma A. (2017). Outlier Mining Based Traffic Incident Detection
[9] Data-driven Parallelizable Traffic Incident Detection Using Spatio-Temporal Denoised Robust Thresholds, Transportation Research Part C: Emerging Technologies.
[10] Helgerson A., Walton J., Loya C., Kawell C., Atwell K., Moaghan Q., Ahuja L., Hassan H.,
Gilbert S. B., Sharma A (2018).Developing an Optimized UI for Traffic Managers.
[11] Systematics, C., 2005.Traffic Congestion and Reliability: Trends and advanced strategies for
congestion mitigation. Technical Report. Federal Highway Administration, Texas Transporta-tion Institute.
[12] Brumback T., Fonseca D. J., Moynihan G. P. (2011). A mathematical model for freeway
inci-dent detection and characterization: A fuzzy approach.
[13] Parkany, E. and Xie, C., (Aug 2002).Use of Driver-Based Data for Incident Detection, Seventh
International Applications of Advanced Technologies in Transportation Conference, pp. 143-150.
[14] Monahan, T. (2007).War Rooms of the Street: Surveillance Practices in Transportation
Con-trol Centers, The Communication Review, 4, No. 10, pp. 367-389.
[15] Sobhi, N. and Kelly, M. (1999). Human Factors Recommendations for TMC Design, Public
Roads, 62, No. 6, pp. 36-48.
[16] Courage, K. G. and Levin, M (1968)A Freeway Corridor Surveillance, Information and
Con-trol System, Research Report 488-8 Texas Transportation Institute, Texas A&M University.
[17] Payne, H. J. and Tignor, S. C. (1978).Freeway Incident-Detection Algorithms Based on
Deci-sion Trees with States, Transportation Research Record, No. 682, pp. 30-37.
[18] Dia, H. and Rose, G. (1997).Development and Evaluation of Neural Netwrok Freeway Incident
[19] F Sun, A Dubey, J White (2017).DxNAT Deep Neural Networks for explaining non-recurring traffic congestion, 2017 IEEE International Conference on Big Data, 2141-2150.
[20] Samant, A. and Adeli, H. (2001).Enhancing Neural Network Traffic Incident-Detection
Algo-rithms Using Wavelets, Computer Aided Civil and Infrastructure Engineering, 16, No. 4, pp. 239-245.
[21] Olutayo V. A. and Eluride A.A (2014). Traffic Accident Analysis Using Decision Trees and
Neural Networks, I. J. Information Technology and Computer Science, 2014, 02, 22-28.
[22] R. Sujatha, R. Anitha Nithya, S. Subhapradha, S. Srinithibharathi (2018). Decision Tree
Classification for Traffic Congestion Detection Using Data Mining, International Journal of Engineering and Techniques, Volume 4, Issue 2.
[23] Chen, S., Wang, W. (2009). Decision Tree learning for freeway automatic incident detection,
Expert Systems with Applications 36 (2009), 4101-4105
[24] Balke, K., C. Dudek, and C. Mountain. Using proble-measure travel times to detect major
freeway incidents in Houston, Texas. In Transportation Record: Journal of the Transportation Research Board, No. 1554. TRB of the National Academies, Washington D.C. 1996. pp. 213-220.
[25] Wang, S., Sharma, A., Knickboxer, S. (2018) Analyze and Improving the Performance of
Dynamic Message Sign Reporting Work-Zone Related Congestion, Transportation Research Report: Journal of Transportation Research Board, vol 2617, pp. 71-77.
[26] Miao M. Chong, Ajith Abraham, Marcin Paprzycki (2004). Traffic Accident Analysis Using
Decision Trees and Neural Networks, IADIS International Conference on Applied Computing, Portugal, IADIS Press, Pedro Isaias et al. (Eds.), ISBN: 9729894736, Volume 2, pp. 39-42, 2004.
[27] Peddabachigari, Sandhya & Abraham, Ajith & Thomas, Johnson. (2004). Intrusion detection systems using decision trees and support vector machines. International Journal of Applied Science and Computations.
[28] N. Dogru and A. Subasi”Traffic accident detection using random forest classifier,” 2018 15th
Learning and Technology Conference (L&T), Jeddah, 2018, pp. 40-45.
[29] Walaa Alajali, Wei Zhou ,Sheng Wen ,Yu Wang (2018)Intersection Traffic Prediction Using
Decision Tree Models,Symmetry 2018, 10, 386
[30] Chenqi Wang and Hsin-Mu Tsai.Detecting Urban Traffic Congestion with Single Vehicle, 2013
International Conference on Connected Vehicles and Expo (ICCVE)
[31] Liu, Yunxiang Wu, Hao. (2017). Prediction of Road Traffic Congestion Based on Random