HOPE, E., PETROVSKI, A. and AHRIZ, H. 2020.
Detection of false command and response injection attacks for cyber
physical systems security and resilience
. In Proceedings of the 13th International conference on security of
information and networks (SIN 2020), 4-7 November 2020, Merkez, Turkey. New York: ACM [online], (accepted). To
be made available from:
https://doi.org/10.1145/3433174.3433615
Detection of false command and response
injection attacks for cyber physical systems
security and resilience.
HOPE, E., PETROVSKI, A. and AHRIZ, H.
2020
This document was downloaded from
https://openair.rgu.ac.uk
Detection of False Command and Response Injection Attacks for
Cyber Physical Systems Security and Resilience
Hope Eke
∗ [email protected] School of Computing, Robert Gordon UniversityAberdeen, Scotland, UK
Andrei Petrovski
[email protected]School of Computing, Robert Gordon University
Aberdeen, Scotland, UK
Hatem Ahriz
[email protected] School of Computing, Robert Gordon UniversityAberdeen, Scotland, UK
ABSTRACT
The operational cyber-physical system (CPS) state, safety and re-source availability is impacted by the safety and security measures in place. This paper focused on i) command injection (CI) attack that alters the system behaviour through injection of false control and configuration commands into a control system and ii) response injection (RI) attacks that modifies the response from server to client, thereby providing false information about system state. In this project, we implemented deep learning (DL) multi-layered se-curity model approach for securing industrial control system (ICS) against malicious CI and RI attacks. We validated this approach with two case studies: i) network transactions between a Remote Terminal Unit (RTU) and a Master Control Unit (MTU) in-house SCADA gas pipeline control system and ii) a case study of command and response injection attacks. Based on this project result, we show that the proposed approach achieved a significant attacks detection capability of 96.50%. Also, demonstrated that performance of attack detection techniques applied can be influences by the nature of net-work transactions with respect to the domain of application. Hence, robustness and resilience of operational CPS state and performance are influenced by the safety and security measures in place which is specific to the CPS device in question.
CCS CONCEPTS
•Security and privacy→Distributed systems security.
KEYWORDS
Advanced Persistent Threats(APTs), Command and Response Injec-tion, Cyber-Physical Systems (CPSs), Industrial Control Systems (ICS), Distributed Control System (DCS), Supervisory Control and Data Acquisition (SCADA)
ACM Reference Format:
Hope Eke, Andrei Petrovski, and Hatem Ahriz. 2020. Detection of False Com-mand and Response Injection Attacks for Cyber Physical Systems Security and Resilience. In13th International Conference on Security of Information and Networks (SIN 2020), November 4–7, 2020, Merkez, Turkey.ACM, New York, NY, USA, 8 pages. https://doi.org/10.1145/3433174.3433615
Permission to make digital or hard copies of all or part of this work for personal or classroom use is granted without fee provided that copies are not made or distributed for profit or commercial advantage and that copies bear this notice and the full citation on the first page. Copyrights for components of this work owned by others than the author(s) must be honored. Abstracting with credit is permitted. To copy otherwise, or republish, to post on servers or to redistribute to lists, requires prior specific permission and/or a fee. Request permissions from [email protected].
SIN 2020, November 4–7, 2020, Merkez, Turkey
© 2020 Copyright held by the owner/author(s). Publication rights licensed to ACM. ACM ISBN 978-1-4503-8751-4/20/09. . . $15.00
https://doi.org/10.1145/3433174.3433615
1
INTRODUCTION
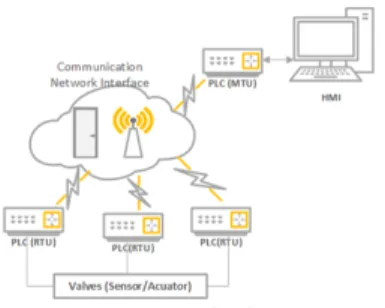
Critical infrastructure are CPS that are responsible for maintaining normal industrial plants operation such as gas pipelines, water treat-ment and power plants. The CPS are control systems that composed of interconnected computer-based networked and integrated cyber physical components that monitor, control and exchange vital in-formation through physical components [16], [17]. These physical components consist of sensors, controller and actuators that aids communicate [17]. Examples of such systems are Distributed Con-trol System (DCS) and Supervisory ConCon-trol and Data Acquisition (SCADA) that contain control systems which are used in nuclear power plants [13], water and sewage systems, and irrigation sys-tems [11]. Figure 1 is a representation of simple SCADA system. The computer systems used to control physical functions of the operating systems are not immune to the threat of today’s sophisti-cated cyber attacks and can be potentially vulnerable [16]. Potential
Figure 1: A Simple Scada System
threats can affect ICS device at different level; hence security of each component is extremely important to avoid compromised to any component [9]. ICS also utilizes diverse communication platforms and protocols to increase efficiency, productivity reduce operational costs and further improve organization’s support model [21].
The complexity of the ICS architecture, and the increased efforts of control physical functions in processing and analysing data, has lead to increased interactions between control network and business network [21] - [19]. The possibility of attacks on control systems in order to gain access to the physical part of ICS and daily operational challenges due to these increased cyber-physical interaction are on the high side [11] and [19].
Hence, ensuring the security of these systems are of very impor-tant to avoid any operational disruption. However, this requires a complex approach to identify and mitigate security vulnerabilities or compromise at all levels within the ICS to maintain resource
SIN 2020, November 4–7, 2020, Merkez, Turkey Eke et al.
availability, system safety, integrity, confidentiality and authentica-tion against the most dangerous type of attack known as APTs [2] and malicious injection attacks.
Due to increased efforts in ICS’s data analytics, interaction be-tween control network and business network, software usage has also grown and adapted to new environments at a significant pace. This technology advancements has greatly changed how we inter-act with the connected world, as a result of these new technological advancements, threat actors have also embraced and adapted to this development to improve their own strategy in creating new sophisticated malicious applications as highlighted in [21] and [12]. There is a clear need for intrusion detection / protection system specifically for critical infrastructures (CIs) that can significantly improve the security of such systems. Any compromise to these systems caused by intrusion attacks can lead not only to disruption of operation, huge financial loses but, more importantly, the risk to the public safety.
The contribution of this paper can be summarised as follows:
•We propose an ensemble deep learning multi-layered
security detection approach for ICS devices.
•We implemented a multi-layered security detection
approach that takes into consideration the distributed and multi-level nature of ICS architecture and reflect on the four main SCADA cyber attacks.
•The achieved resultssuggest that the proposed approach possess attack detection capability and demonstrated that performance of attack detection techniques applied can be influences by the nature of network transactions with respect to the domain of application.
1.1
Paper Organisation
The remainder of the paper is organised as follows. Section 2 con-tains a brief discussion of related work geared toward the security of CPS. In section 3 detailed description of our approach is dis-cussed. Experiments, evaluation metrics and analysis results are discussed in Section 4. Section 5 and 6 presents the conclusion of this paper and our future work respectively.
2
RELATED WORK
This section contains a brief discussion of related work to support the maintaining security and stability of CPS. The ability to de-tect every possibilities of an active attack on an active CPS is a global security challenge. There have been a number of successful breaches of critical infrastructure. Stuxnet is one example of a so-phisticated targeted cyber attack purposefully launched to target critical nuclear infrastructure in Iran as highlighted in [4] and [3]. However, the four main recorded targeted attacks malware tai-lored against ICS are STUXNET, BLACKENERGY 2, HAVEX and CRASHOVERRIDE, where STUXNET is the first ever recorded for disrupting physical industrial processes while CRASHOVERRIDE is the second and also the first known to specifically target the electric grid [20] and [22]. CRASHOVERRIDE is not unique to any vendor or configuration but utilises the knowledge of grid operations and network communications to cause disruption resulting to electric outages and is not necessarily malware for espionage [15] and [10].
Numerous techniques have been proposed and successfully im-plemented to detect these type of attacks. However, most of these proposed works has led to a significant pool of solutions geared to-wards addressing securing the CPS [5]. One of this threat detection model in a specific critical infrastructures was carried out by Linda et al. in [16] using a hybrid of two neural network learning algo-rithms – the Error-Back Propagation and Levenberg-Marquardt, for normal behavior modeling to develop an IDS using Neural Net-work based Modeling (IDS-NNM). This IDS-NNM was achieved by developing window based feature extraction technique; construc-tion of training dataset using randomly generated intrusion vectors from real network data.Their result shows the ability of IDS-NNM to detect long and short intrusion attempts consisting of several packets and achieved good detection rate while generating no false positives when evaluated with previously unseen testing data.
Work in [17] which focused on generating a cyber defense system that will maximizes the likelihood that a cyber-physical system under sensor attack can still recover and reach the desired state without a noticeable performance degradation using combination of watermarking and resilient kalman filtering (RKF) technique accompanied with a watermarking approach.
Also, in [1], the author considered a case of nonlinearities in communication data flow in Automatic Generation Control (AGC) system, applied stacked RNN-LSTM model as a detector and clas-sifier in order to detect False Data Injection (FDI) attacks in AGC systems and achieved accuracy of 94%. The authors focused on three types of attack; the ramp, step and pulse attacks since attacks in AGC target frequency deviation signals and tie-line power sig-nals. Accuracy, sensitivity, specificity and precision were calculated as metrics measure in order to validate their proposed model detec-tion classificadetec-tion capability. Two case scenarios were implemented using RMSprop optimizer to enhance the model performance and archived a precision of 99.01% and 99.22%.
We implemented a multi-layered security detection approach that takes into consideration the distributed and multi-level nature of ICS architecture and reflect on the four main SCADA cyber at-tacks using ensemble DL model on network transactions between RTU and MTU. We expect that the ideas behind this analysis ap-proach as presented in this paper will aid in the efforts to improve and maintain the security of cyber-physical systems stability.
3
APPROACH
The ability to maintain the authentic communication settings such as pressure set point, proportional integral derivative (PID) param-eters, or relief valve control state within a SCADA system is a very critical issue.
SCADA systems has a regular set of read and write commands communication patterns that are repeated in a loop. For instance, the system command writes the contents of all registers and coils used, then the measured state of the system is read by the Mod-bus read holding register command. Each of these commands are followed by response. These operations are performed by pro-grammable logic controller (PLC) and human machine interface (HMI) using a standard SCADA communication protocol. The PLC controller reads inputs, analyse current state, calculate responses,
and write outputs while the HMI monitor and control the physical process remotely.
To execute CI attacks, the attackers maliciously inject a com-mand into the system server that modifies settings such as pressure set point, PID within a SCADA system. On the other hand, the RI attacks then alters the response coming from the server to client thereby provide false system state information [18]. We have ex-ploited the regular communication patterns in SCADA system using deep leaning algorithms that has a nonlinearity feature to build a model of normal behaviour and detect abnormal deviations
3.1
Our proposed model operates in three
layers
(1) Data input and probing layer (2) Data analysis Layer
(3) Decision Layer (uses voting and probability confidence)
3.1.1 Data input and probing layer: consists of two modules; (i) Data input which involves data gathering and raw sample / simu-lated synthetic data been introduce into the system and (ii) Probing Module - this involves data preprocessing the collected data.
•Normalisation - ZScore method of standardisation is used to normalise all numerical features to preserve the data range and introduce the standard deviation and variance to im-proves model convergence speed during training.
𝑍= 𝑥−𝜇
𝜎 (1)
Where𝑍is ZScore,𝑥is the individual data point,𝜇is the mean of𝑥for a given attribute; that is uniform real number between 0 and 1, represented as Equation 2
𝜇=1 𝑛 𝑛 Õ 𝑖=1 𝑥𝑖 (2)
and Rho (𝜎) is the standard deviation as represented in Equation 3
𝜎 =
rÍ
(𝑥−𝜇)2
𝑛 (3)
3.1.2 Data analysis Layer: The rate of attack detection is affected by the parameters used as this parameters have direct impact on attack detection, based on this, several experiments with different network configuration were implemented to find the best optimal values for parameters such as learning rate, network structure such as number of hidden recurrent layer
The processed data are passed to this layer, data is analysed, attack(s) are distinguished from normal activities, taken note of the identified issued with class distribution and classifying rare attacks. Result from this layer is passed to decision engine layer.
3.1.3 Decision Layer:This Layer operates using three approaches; first, it receives information from analysis layer, extract the at-tack step present. Secondly, it processes this information and links attacks steps that are related. Lastly, it then uses voting and proba-bility confidence to check if the attack is a potential chain of attack campaign is found and if is consistent with other attack campaigns.
3.2
Recurrent Neural Network
The Decision Layer is implemented with ensemble RNNs variants for data analysis. RNN is an effective class of artificial neural net-work (ANN) used when dealing with sequence data. The RNN uses previous inputs and outputs to adjust the weights of the networks, thus creating a memory to improve its performance [14] It maps a sequence of inputs to the outputs thereby controlling the informa-tion flow signal with respect to time. Hence, RNNs is suitable for dynamic real time network pattern analysis with time.
The formulated mathematical representations of the RNN com-putational flow are represented in Equation 4
𝑠𝑡=𝑓𝑤(𝑠𝑡−1, 𝑥𝑡) (4) wherefwis the recursive function. Given that a network has an in-put layer𝑥, hidden layer𝑠and output layer𝑜. The current observed input to the network at time step𝑡 is denoted as𝑥𝑡, the hidden state at time step𝑡is denoted as𝑠𝑡and𝑠𝑡−1represent the previous hidden state.
Each hidden layers has a sigmoid activation function which can be calculated with Equation 5, this function is applied to produce non-linearity value by transforming the input into values usable by the output layer.
𝑠𝑖𝑔𝑚𝑜𝑖𝑑(𝑥)= 1
1+𝑒−𝑥 (5)
Based on the pre-configured number of time steps during training, the network screens the sequence data by creating a time window to identify a temporal pattern across the features and labels within this window. The same process is repeated within the network by sliding over the entire data sequence while updates the weights accordingly. With the assumption that parameters share the same weight𝑊across the whole sequence in each time step t reducing the amount of parameter to be trained, this assumption is utilised to compute the gradient for weight parameter across time step𝑡. Hence at a given time𝑡, we have;
𝑠𝑡=𝑡 𝑎𝑛ℎ(𝑊𝑥 𝑠𝑥𝑡+𝑊𝑠𝑠𝑠𝑡−1+𝑏𝑠) (6) 𝑠 𝑓 = 𝑒𝑥𝑡 Í𝑛 𝑗=1 𝑒 𝑥𝐽 (7)
where𝑠𝑡is the calculated hidden layer,tanhis the hidden layer nonlinear activation function, softmax functionsf represented in Equation 7 is used at the last layer in Equation 8. the weight shared among the previous hidden state𝑠𝑡−1, input state𝑥𝑡and output𝑜𝑡 across all the time sequence𝑡are the weight shared between the hidden s and output o across all the time sequence are𝑊𝑠𝑠 ,𝑊𝑥 𝑠 and𝑊𝑜𝑠 respectively, while𝑏𝑠 and𝑏𝑜 are the bias terms for the hidden state and output𝑜at time step𝑡.
𝑜𝑡=𝑠𝑜 𝑓 𝑡𝑚𝑎𝑥(𝑤𝑠𝑜𝑠𝑡+𝑏0) (8) In order to minimise the cumulative network error, the loss, or error as applied on this study is the cross-entropy loss which is the sum of all input-output pairs errors in a sequence over all the time steps t, is referred to as the loss L function, given as Equation 9,
𝐿(𝑜 , 𝑦)=− Õ
𝑡
𝑦𝑡(𝑥)𝑙 𝑜𝑔𝑜𝑡(𝑥) (9) where𝑦is the true probability distribution,𝑜is the predicted probability distribution,𝑦𝑡is the actual true probability distribution
SIN 2020, November 4–7, 2020, Merkez, Turkey Eke et al.
class value at time step𝑡and𝑜𝑡is the actual true predicted class distribution value at time step𝑡,𝑥is an input and𝑙𝑜𝑔is natural log. To derive the derivative of Equation9 with respect to the actual true predicted class value𝑜𝑡as calculated with Equation 8, assume 𝐿as the given objective function,𝐿(𝑡)as output at current hidden time𝑡and𝐿(𝑡+1)as the output at the previous hidden state time 𝑡+1. Then, we have; 𝜕𝐿 𝜕𝑜𝑡 =−Õ 𝑡 𝑦𝑡 𝜕𝑙𝑜𝑔 𝑜𝑡 𝜕𝑠𝑡 =−Õ 𝑡 𝑦𝑡 1 𝑜𝑡 𝜕𝑜𝑡 𝜕𝑠𝑡 (10) Then applying the chain rule to derive the gradient of the𝑠 𝑓 from Equation 8, we arrive at Equation 11.
𝜕𝐿
𝜕𝑜𝑡
=− (𝑦𝑡−𝑜𝑡) (11) Since the hidden state and output share the same weight𝑊𝑠𝑜 across the whole sequence in each time step𝑡reducing the amount of parameter to be trained, weight can be differentiated at each time step t as shown from Equation 12 to 17.
𝜕𝐿 𝜕𝑊𝑠𝑜 =Õ 𝑡 𝜕𝐿 𝜕𝑜𝑡 𝜕𝑜𝑡 𝜕𝑊𝑠𝑜 (12) Then, we derive the gradient with respect to each bias𝑏𝑜unit to achieve Equation 13, 𝜕𝐿 𝜕𝑏𝑜 =Õ 𝑡 𝜕𝐿 𝜕𝑜𝑡 𝜕𝑜𝑡 𝜕𝑏𝑜 (13) Also, to derive the gradient with respect to weight𝑊𝑠𝑠, we con-sider the previous time step
𝑡→t+1 and arrived at Equation 14
𝜕𝐿(𝑡+1) 𝜕𝑊𝑠𝑠 = 𝜕𝐿(𝑡+1) 𝜕𝑜𝑡+1 𝜕𝑜𝑡+1 𝜕𝑠𝑡+1 𝜕𝑠𝑡+1 𝜕𝑊𝑠𝑠 (14)
Considering that weight𝑊𝑠𝑠, and𝑊𝑜𝑠 shared across all the time 𝑡 sequence are similar. Likewise, in RNN model, the calculation of the subsequent state hidden state𝑠𝑡 depends partially on the previous hidden state𝑠𝑡−1. Hence, we arrived at Equation 15
𝜕𝐿(𝑡+1) 𝜕𝑊𝑠𝑠 = 𝜕𝐿(𝑡+1) 𝜕𝑜𝑡+1 𝜕𝑜𝑡+1 𝜕𝑠𝑡+1 𝜕𝑠𝑡+1 𝜕𝑠𝑡 𝜕𝑠𝑡 𝜕𝑊𝑠𝑠 (15) We arrived at Equation 13 (15) by clustering the weight over the whole sequence using the Backpropagation Through Time (BPTT) from time step𝑡to 0 with respect to𝑊𝑠𝑠, we get Equation 16,
𝜕𝐿(𝑡+1) 𝜕𝑊𝑠𝑠 =Õ 𝑡 𝑡+1 Õ 𝑘=1 𝜕𝐿(𝑡+1) 𝜕𝑜𝑡+1 𝜕𝑜𝑡+1 𝜕𝑠𝑡+1 𝜕𝑠𝑡+1 𝜕𝑠𝑘 𝜕ℎ𝑘 𝜕𝑊𝑠𝑠 (16) Taking the gradient with respect to𝑊𝑥 𝑠over the whole sequence, we applied the same process as from Equation 12 to 17.
𝜕𝐿(𝑡+1) 𝜕𝑊𝑥 𝑠 =Õ 𝑡 𝑡+1 Õ 𝑘=1 𝜕𝐿(𝑡+1) 𝜕𝑜𝑡+1 𝜕𝑜𝑡+1 𝜕𝑠𝑡+1 𝜕𝑠𝑡+1 𝜕𝑠𝑘 𝜕ℎ𝑘 𝜕𝑊𝑥 𝑠 (17)
For more understanding of how these equations are derived, please check Hagan et al, in [7]
4
EXPERIMENT
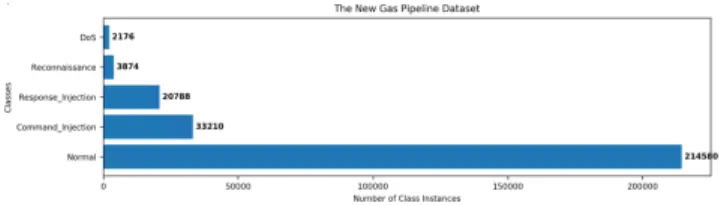
The purpose of this study is to examine the performance of im-plementing deep DL ensemble stacked RNN variants approaches to detection false command and response injection attacks. We have used network typologies and payload information values of The New Gas Pipeline Dataset containing 214,580 Modbus network packets with 60,048 packets that are associated with a cyber attack. These attacks are categorised into 7 different attack categories with 35 different specific type of attacks [8] and [9]. These attack cat-egories are narrowed down to four overall catcat-egories as follows: Response injection (RI) attacks, Command injection (CI) attacks, Denial of Service (DoS) attacks and Reconnaissance. Figure 2 shows the number of records in each of the categories.
Two different tasks were implemented. The first task focused on deriving hyper-parameter values for best performance model. In the second task, the best hyperparameter values were implemented in measuring the model performance. All the standard data mining processes such as data cleaning and pre-processing, normalisation, visualisation and classification were implemented in Python. The batch size of 124 and epochs are run up to 500 with a learning rate set in the range of 0.01-0.5 on a GPU-enabled TensorFlow network architecture. All the 17 features were used as input vector with 70% as training set and 30% as validation set for the multi attack classification. The training dataset were normalised from 0 to 1. This was trained using sigmoid activation function through time with ADAM optimiser, sigmoid function was used on all the three gates and categorical cross entropy as loss function for error rate. Also, these tasks were carried out with traditional machine learn-ing (ML) classification algorithms - Decision Tree (DT). The ML classification result was compared to Deep ensemble RNNs-CNN result in order to further evaluate the detection capability of used approach and report the result in Table 1 and 2.
4.1
Experimental Data
Figure 2 is the visualisation representation of The New Gas Pipeline data classes records.
Figure 2: Four Main Attack Group and Normal Classes
4.2
Hyperparameters settings used
• Batch sizes: 32, 64 and 128
• Learning rate: 0.0002 to 0.00005 with polynomial decay over all the epochs.
• No of iterations: 100 – 500epochs.
• Neural network: Four layers were used
• Each of the hidden layers has a sigmoid/ReLU activation function applied to it to produce non-linearity. This trans-forms the input into values usable by the output layer.
•The softmax function is applied to the output layer to get probabilities of categories. This also helps in learning with cross entropy loss function.
•Adaptive Moment Estimation (Adam) optimiser is used for the back propagation to minimise the loss of categorical-cross entropy.
•The dropout is used to alleviate the over-fitting (used as regularization technique used to prevent over-fitting in Neu-ral Networks. This randomly removes the units along with connections.
4.3
Evaluation Metrics
Generally, accuracy is used as a traditional way of classification performance measure. This matric measure is no longer appropriate when dealing with multiclass imbalance data since the minority class has little or no contribution when compared to majority classes toward accuracy [23]. For this reason, this study considered preci-sion, recall, f1-score, overall accuracy, area under the curve(𝐴𝑈 𝐶) receiver operating characteristic(𝑅𝑂𝐶)and confusion matrix are used to validate the approach of using RNN variants for detecting false command and response injection attack and get a clearer un-derstanding of the output. These metrics are calculated based on True Positive(𝑇 𝑃), True Negative(𝑇 𝑁), False Positive(𝐹 𝑃), and False Negative(𝐹 𝑁).
(1)𝑇 𝑃- abnormal instances correctly predicted as abnormal. (2)𝑇 𝑁 - normal instances correctly predicted as normal (3) 𝐹 𝑃- normal instances incorrectly predicted as abnormal (4) 𝐹 𝑁- abnormal instances incorrectly predicted as normal (5) 𝑃 𝑟 𝑒𝑐𝑖𝑠𝑖𝑜𝑛(𝑃)- is the ability of a classification model to
iden-tify only the relevant data points, that is the ratio of𝑇 𝑃 records over the sum of𝑇 𝑃and𝐹 𝑃. Represented as Equation 18
𝑃= 𝑇 𝑃
(𝑇 𝑃+𝐹 𝑃) (18) (6) 𝑅𝑒𝑐𝑎𝑙𝑙(𝑅)– which is also known as probability of detection, true positive rate𝑇 𝑃 𝑅or sensitivity𝑆is the ability of a model to find all the relevant cases within data, that is the ratio of the𝑇 𝑃records over the sum of𝑇 𝑃and𝐹 𝑁. Represented as Equation 19.
𝑅= 𝑇 𝑃
(𝑇 𝑃+𝐹 𝑁) (19) (7) 𝑓1−𝑠𝑐𝑜𝑟 𝑒(𝑓1)- is the weighted average of precision and recall, that is the harmonic mean of precision and recall of a class in one given metric, represented as in Equation 22, where weight parameter is denoted by𝛽2generally set to 1 by default and which measures the trade-off between recall and precision. Represented as Equation 20.
𝑓1=
(1+𝛽2).𝑝𝑟 𝑒𝑐𝑖𝑠𝑖𝑜𝑛 .𝑟 𝑒𝑐𝑎𝑙𝑙
𝛽2𝑝𝑟 𝑒𝑐𝑖𝑠𝑖𝑜𝑛+𝑟 𝑒𝑐𝑎𝑙𝑙 (20) (8) 𝐴𝑈 𝐶−𝑅𝑂𝐶𝑐𝑢𝑟 𝑣 𝑒- The precision-recall curve shows the trade-off between precision and recall at different threshold settings, where AUC measures the degree of separability and 𝑅𝑂𝐶represent the probability curve and also a useful tech-nique for model output visualising, organising and selecting classifiers based on their performance as described in [6]. A high area under the curve represents both high recall and
high precision, where high precision relates to a low false positive rate, and high recall relates to a low false negative rate. High scores for both precision and recall show that the model is returning accurate results𝑃, as well as returning a majority of all positive results𝑅. An ideal model with high precision and high recall will return many results, with all results labelled correctly. The AUC-ROC curve can also be used as a scaler measure rather than the higher the AUC value, the better the model [8].
𝐴𝑈 𝐶= 1
+𝑇 𝑃𝑟 𝑎𝑡 𝑒−𝐹 𝑃𝑟 𝑎𝑡 𝑒
2 (21)
(9) 𝑂 𝑣 𝑒𝑟 𝑎𝑙𝑙 𝐴𝑐𝑐𝑢𝑟 𝑎𝑐𝑦(𝑂 𝑎𝐴𝑐𝑐) - Measures the rate of the cor-rectly classified class instances of all the classes (attacks and normal). An overall classification performance is an im-portant performance matrix require to evaluate the overall model performance rate, calculated as represented in Equa-tion 22.
𝑂 𝑎𝐴𝑐𝑐=
(𝑇 𝑃+𝑇 𝑁)
(𝑇 𝑃+𝑇 𝑁+𝐹 𝑃+𝐹 𝑁) (22)
4.4
Results and Discussions
To validate the approach of using the RNNs-CNN model for detect-ing attacks statistical matrices such as true positive rate (TPR), false positive rate (FPR),𝑃,𝑅„ and𝑓1, are calculated (i) to evaluate the ability of this approach to accurately detect and classify an attack as abnormal and also (ii) to check the ability of this model to detect different type of attacks accurately while focusing on CI and RI attacks.
Table 1 contains the comparative summary result of the individ-ual algorithms score, while Table 2 shows the overall of the study approach performance score in detecting malicious CI and RI attack groups. In this study, RNNs-CNN model was used as classifier and detector and were able to achieve a significant result of 86.20% overall average accuracy. Although, a closer observation of the individual performance of each of the algorithm, LSTM shows a better detecting rate for the CI and RI of this study interest with 93.30% and 92.04% respectively. We went further to implement the same approach using ML algorithm “DT”, this turns out to yield slightly higher score of 95.53% as in Table 2. Considering other evaluation metrics used, our approach achieved a𝑃of 96.41% and Sensitivity of 99.71.
Furthermore, the validation accuracy, loss rate and AUC-ROC shows a clear view of the overall performance, the error rate and ac-curacy validation as can been seen in can be visualised in Figures 8 - 16. However, there are some spikes in the validation accuracy and loss as shown in Figures 9-16, following the individual model detec-tion capability and loss per epoch, with micro and macro-average ROC curve of 91% and 72% respectively obtained, it indicates that the classifier performs well for each individual class.
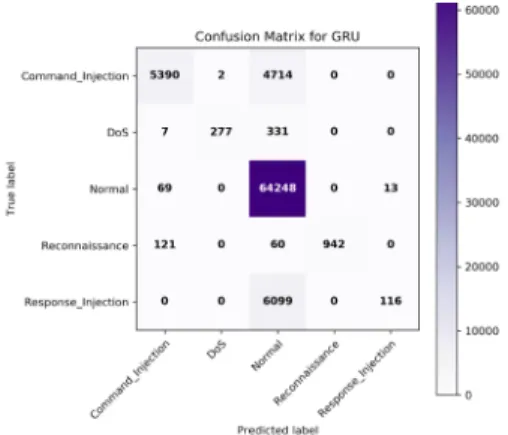
• Confusion Matrix: Confusion Matrix: Figure 3-7 are the in-dividually generated confusion matrix to show the predicted and the actual true detection of all the four attacks group for each of the algorithms used. Figure 2 shows the number of instances of the CI, DoS, Normal, Reconnaissance and RI, where DoS appear to have a fewer connection records while normal contains the highest connection records. The model
SIN 2020, November 4–7, 2020, Merkez, Turkey Eke et al.
Table 1: Overall Performance for All Attacks Detection Criteria Score Recall 86.1 Precision 87.9 f1-score 82.1 TPR 96.5 FPR 0 Validation Loss 32.6 Detection rate 86.1 Overall Score OaAcc (%) 86.2 micro f1 (%) 91 macro f1 (%) 72
Table 2: Comparative Result for CI / RI Attacks Detection
Algorithm LSTM (%) RNN (%) GRU (%) CNN (%) DT (%)
Criteria CI RI CI RI CI RI CI RI CI RI
Precision 96.41 76.54 95.73 100 96.47 89.92 96.47 89.92 97.77 72.4
Specificity 99.71 99.95 99.65 100 99.7 99.98 99.7 99.98 99.68 97.91
Detection rate 93.3 92.04 93.09 92.03 93.53 92.07 93.53 92.08 99.17 95.53
tends to learn the class with more records properly without confusing their identity unlike those with fewer connections records. This indicates data imbalance distribution problem.
Figure 3: Multi-Classification Confusion Matrix for LSTM
4.4.1 Visual Representations of Experimental Confusion Matrices:
5
CONCLUSION
In this study, we implemented a multi-layered security detection approach based on Deep Leaning (DL), that takes into considera-tion the distributed and multi-level nature of ICS architecture and reflect on the four main SCADA cyber attacks. We went further to implement attacks classification with ML “DT” classifiers as con-tained in Table 1 and 2. The result of the implemented algorithms achieved a competitive overall accuracy and detection rate with 0% FAR and TPR of 96.50%. We also noticed a higher detection rate of CI to RI from all the individual algorithms implemented, although
Figure 4: Multi-Classification Confusion Matrix for RNN
Figure 5: Multi-Classification Confusion Matrix for GRU
Figure 6: Multi-Class Confusion Matrix for CNN
CI has more connection records, the implemented approach appear to be more suitable for classifying high-frequency attacks. The per-centage detection rate achieved as represented in Table 2 shows a slight detection capability for ML than DL for this study, however, the overall result suggests that the RNNs-CNN model is a good candidate for developing attack detection systems.
Figure 7: Multi-Class Confusion Matrix for DT
Figure 8: AUC-ROC graph for all five Classes
Figure 9: Validation accuracy against epochs for LSTM
6
FUTURE WORK
This work on the implementation of an ensemble DL multi-layered security detection approach on ICS device using The New Gas Pipeline (NGP) dataset is an ongoing study. Further work will ex-plore full implementation of APT Detection Framework Based on Deep APT Step Analysis & Correlation (APT-DASAC) on NGP and
Figure 10: Validation accuracy against epochs for RNN
Figure 11: Validation accuracy against epochs for GRU
Figure 12: Validation accuracy against epochs for CNN
Figure 13: Validation loss against epochs for LSTM
a time-series dataset, compare and report the performance of this model on these two domains.
Since our implemented approach showed a significant attacks detection capability and demonstrated that performance of attack
SIN 2020, November 4–7, 2020, Merkez, Turkey Eke et al.
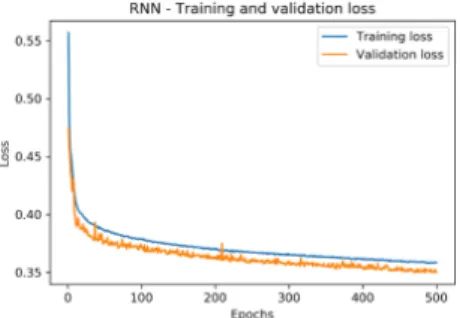
Figure 14: Validation loss against epochs for RNN
Figure 15: Validation loss against epochs for GRU
Figure 16: Validation loss against epochs for CNN
detection techniques applied can be influences by the nature of network transactions with respect to the domain of application. As suggested that the robustness and resilience of operational CPS state and performance are influenced by the safety and security measures in place which is specific to the CPS device in question. Hence the need for further investigation in diverse domain in other to ascertain this claim.The authors are currently engaged in work in this domain.
REFERENCES
[1] Abdelrahman Ayad, Mohsen Khalaf, and Ehab El-Saadany. 2018. Detection of false data injection attacks in automatic generation control systems considering system nonlinearities. In2018 IEEE Electrical Power and Energy Conference (EPEC). IEEE, 1–6.
[2] Lorena Cazorla, Cristina Alcaraz, and Javier Lopez. 2016. Cyber stealth attacks in critical information infrastructures.IEEE Systems Journal12, 2 (2016), 1778–1792. [3] Thomas Chen and Saeed Abu-Nimeh. 2011. Lessons from stuxnet.Computer44,
4 (2011), 91–93.
[4] Global Energy Cyberattacks. 2011. Night dragon.McAfee Foundstone Professional Services and McAfee Labs(2011).
[5] Hope Eke, Andrei Petrovski, and Hatem Ahriz. 2020. Handling minority class problem in threats detection based on heterogeneous ensemble learning approach.
International journal of systems and software security and protection11, 2 (2020). [6] Tom Fawcett. 2006. An introduction to ROC analysis.Pattern recognition letters
27, 8 (2006), 861–874.
[7] Martin T Hagan, Orlando De Jesús, Roger Schultz, L Medsker, and LC Jain. 1999. Training recurrent networks for filtering and control. InRecurrent neural networks: Design and applications. CRC press, 311–340.
[8] Guo Haixiang, Li Yijing, Jennifer Shang, Gu Mingyun, Huang Yuanyue, and Gong Bing. 2017. Learning from class-imbalanced data: Review of methods and applications.Expert Systems with Applications73 (2017), 220–239.
[9] Brendon Harris and Ray Hunt. 1999. TCP/IP security threats and attack methods.
Computer communications22, 10 (1999), 885–897.
[10] Kevin E Hemsley, E Fisher, et al. 2018.History of industrial control system cyber incidents. Technical Report. Idaho National Lab.(INL), Idaho Falls, ID (United States).
[11] Abdulmalik Humayed, Jingqiang Lin, Fengjun Li, and Bo Luo. 2017. Cyber-physical systems security—A survey.IEEE Internet of Things Journal4, 6 (2017), 1802–1831.
[12] USDHS ICS-CERT. 2014. ICS-monitor incident response activity; Information Sharing.National Cybersecurity and Communications Integration Center(2014). [13] Hyung Seok Kim, Jae Min Lee, Taerim Park, and Wook Hyun Kwon. 2000. Design of networks for distributed digital control systems in nuclear power plants. InIntl. Topical Meeting on Nuclear Plant Instrumentation, Controls, and Human-Machine Interface Technologies (NPIC&HMIT 2000). Citeseer.
[14] Stefan Kombrink, Tomáš Mikolov, Martin Karafiát, and Lukáš Burget. 2011. Re-current neural network based language modeling in meeting recognition. In
Twelfth annual conference of the international speech communication association. [15] Robert M Lee, MJ Assante, and T Conway. 2017. CRASHOVERRIDE: Analysis of
the threat to electric grid operations.Dragos Inc., March(2017).
[16] Ondrej Linda, Todd Vollmer, and Milos Manic. 2009. Neural network based intrusion detection system for critical infrastructures. In2009 international joint conference on neural networks. IEEE, 1827–1834.
[17] Victoria Marquis, Rebecca Ho, William Rainey, Matthew Kimpel, Joseph Ghiorzi, William Cricchi, and Nicola Bezzo. 2018. Toward attack-resilient state estima-tion and control of autonomous cyber-physical systems. In2018 Systems and Information Engineering Design Symposium (SIEDS). IEEE, 70–75.
[18] Thomas H Morris, Zach Thornton, and Ian Turnipseed. 2015. Industrial control system simulation and data logging for intrusion detection system research.7th annual southeastern cyber security summit(2015), 3–4.
[19] Artem A Nazarenko and Ghazanfar Ali Safdar. 2019. Survey on security and privacy issues in cyber physical systems. (2019).
[20] NJCCIC. 2017. CRASHOVERRIDE NJCCIC Threat Profile, official site of the state of new jersey Original Release Date: 2017-08-10 and accessed on 16/07/20.NJCCIC
(2017). https://www.cyber.nj.gov/threat-center/threat-profiles/ics-malware-variants/crashoverride
[21] A Odewale. 2018. Implementing secure architecture for industrial control systems.
Proceedings of the 27th COREN Engineering Assembly, Abuja, Nigera(2018), 6–8. [22] Joseph Slowik. 2019. Evolution of ICS Attacks and the Prospects for Future
Disruptive Events.Threat Intelligence Centre Dragos Inc(2019).
[23] Yanmin Sun, Andrew KC Wong, and Mohamed S Kamel. 2009. Classification of imbalanced data: A review.International journal of pattern recognition and artificial intelligence23, 04 (2009), 687–719.