W&M ScholarWorks
W&M ScholarWorks
Dissertations, Theses, and Masters Projects Theses, Dissertations, & Master Projects Fall 2016
Supporting Evolution and Maintenance of android Apps
Supporting Evolution and Maintenance of android Apps
Mario Linares-VasquezCollege of William and Mary, [email protected]
Follow this and additional works at: https://scholarworks.wm.edu/etd
Part of the Computer Sciences Commons
Recommended Citation Recommended Citation
Linares-Vasquez, Mario, "Supporting Evolution and Maintenance of android Apps" (2016). Dissertations, Theses, and Masters Projects. Paper 1477068301.
http://doi.org/10.21220/S2001F
This Dissertation is brought to you for free and open access by the Theses, Dissertations, & Master Projects at W&M ScholarWorks. It has been accepted for inclusion in Dissertations, Theses, and Masters Projects by an authorized administrator of W&M ScholarWorks. For more information, please contact [email protected].
Supporting Evolution and Maintenance of Android Apps
Mario Linares V´asquez
Bogot´a, Colombia
Bachelor of Engineering, Universidad Nacional de Colombia, 2005 Master of Science, Universidad Nacional de Colombia, 2009
A Dissertation presented to the Graduate Faculty
of the College of William and Mary in Candidacy for the Degree of Doctor of Philosophy
Department of Computer Science
The College of William and Mary August 2016
ABSTRACT
Mobile developers and testers face a number of emerging challenges. These include rapid platform evolution and API instability; issues in bug reporting and reproduction
involving complex multitouch gestures; platform fragmentation; the impact of reviews and ratings on the success of their apps; management of crowd-sourced requirements;
continuous pressure from the market for frequent releases; lack of e↵ective and usable
testing tools; and limited computational resources for handheld devices. Traditional and contemporary methods in software evolution and maintenance were not designed for these types of challenges; therefore, a set of studies and a new toolbox of techniques for mobile development are required to analyze current challenges and propose new
solutions.
This dissertation presents a set of empirical studies, as well as solutions for some of the
key challenges whenevolving and maintaining Android apps. In particular, we
analyzed key challenges experienced by practitioners and open issues in the mobile development community such as (i) Android API instability, (ii) performance
optimizations, (iii) automatic GUI testing, and (iv) energy consumption. When carrying out the studies, we relied on qualitative and quantitative analyses to understand the phenomena on a large scale by considering evidence extracted from software repositories and the opinions of open-source mobile developers.
From the empirical studies, we identified that dynamic analysis is a relevant method for several evolution and maintenance tasks, in particular, because of the need of
practitioners to execute/validate the apps on a diverse set of platforms (i.e.,device and
OS) and under pressure for continuous delivery. Therefore, we designed and
implemented an extensible infrastructure that enables large-scale automatic execution of
Android apps to support di↵erent evolution and maintenance tasks (e.g., testing and
energy optimization). In addition to the infrastructure we present a taxonomy of issues, single solutions to the issues, and guidelines to enable large execution of Android apps. Finally, we devised novel approaches aimed at supporting testing and energy
optimization of mobile apps (two key challenges in evolution and maintenance of Android apps). First, we propose a novel hybrid approach for automatic GUI-based testing of apps that is able to generate (un)natural test sequences by mining real applications usages and learning statistical models that represent the GUI interactions. In addition, we propose a multi-objective approach for optimizing the energy consumption of GUIs in Android apps that is able to generate visually appealing color compositions, while reducing the energy consumption and keeping a design concept close to the original.
TABLE OF CONTENTS
Acknowledgments vii
List of Tables viii
List of Figures x
1 Introduction 2
2 Empirical Studies 9
2.1 Android API instability [163, 69] . . . 10 2.1.1 RQ1: Does the fault-proneness of APIs a↵ect the user ratings
of Android Apps? . . . 12 2.1.2 RQ2: Does the change-proneness of APIs a↵ect the user ratings
of Android Apps? . . . 13 2.1.3 RQ3: To what extent Android developers experience problems
when using APIs? . . . 15 2.1.4 RQ4: To what extent Android developers consider problematic
APIs to be the cause of negative user rating/comments? . . . . 16 2.2 Usage of Crowdsourced Requirements [201] . . . 17
2.2.1 RQ1:To what extent do developers fulfill reviews when working
on a new app release? . . . 19 2.2.2 RQ2:What is the e↵ect of a crowd review mechanism (for
plan-ning and implementing future changes) on the app success? . . 19 2.3 How Android Developers Detect and Fix Performance Bottlenecks [161] 20
2.3.1 RQ1: What practices are used by Android developers to detect
performance bottlenecks? . . . 21 2.3.2 RQ2: What tools are used by Android developers to detect
performance bottlenecks? . . . 21 2.3.3 RQ3: What practices are used by Android developers to fix
performance bottlenecks? . . . 22 2.4 How Developers Micro-Optimize Android Apps . . . 22
2.4.1 RQ1: What is the distribution of micro-optimization
opportu-nities across Android Apps at GitHub? . . . 24 2.4.2 RQ2: To what extent are micro-optimizations introduced or
avoided during the evolution and maintenance of Android apps? 25 2.4.3 RQ3: How do micro-optimizations impact CPU and memory
usage of Android apps? . . . 26 2.4.4 RQ4: What practices are used by developers for detecting
op-timization opportunities in Android apps? . . . 27 2.4.5 RQ5: What micro-optimizations are recognized (and used) by
developers as useful for improving the performance of apps? . . 28 2.5 Energy Greedy APIs [165] . . . 28 2.5.1 RQ1: Which are the most energy-greedy Android API methods? 30
2.5.2 RQ2: Which sequences of Android API calls are the most
energy-greedy? . . . 31 2.6 How Developers Document and Design Test Cases for Android Apps . 33
2.6.1 RQ1: What are the strategies used by mobile developers to
design test cases? . . . 33 2.6.2 RQ2: What are the preferences of mobile developers for test
2.6.3 RQ3: What tools are used by mobile developers for automated
testing? . . . 34
2.6.4 RQ4: Do mobile developers consider code coverage as a useful metric for evaluating test cases e↵ectiveness? . . . 35
2.7 Discussion . . . 35
2.8 Bibliographical Notes . . . 36
3 Enabling Large-Scale Execution and Testing of Android Apps 38 3.1 A Taxonomy of Essential and Accidental Issues . . . 41
3.1.1 Essential Challenges for Automated GUI-based Execution . . . 42
3.1.1.1 Test Oracles . . . 42
3.1.1.2 Event Coordination . . . 43
3.1.1.3 External Features . . . 46
3.1.1.4 External Dependencies . . . 47
3.1.2 Accidental Challenges for Automated GUI-based Execution . . 47
3.1.2.1 Application Data and Cold Starts . . . 47
3.1.2.2 Bugs in the Framework Utilities . . . 48
3.1.2.3 Bugs and Limitations in the SDK Tools . . . 50
3.1.2.4 Challenges Scaling Concurrent Virtual Devices . . . . 51
3.2 Proposed Solutions . . . 53
3.2.1 Non-Image Based Generation of Oracles . . . 54
3.2.2 Avoiding Hard-Coded Inter-Delay Times . . . 55
3.2.3 Cleaning Data for Cold-Starts . . . 57
3.2.4 Extraction of GUI Hierarchies for Dynamic Screens . . . 58
3.2.5 Running Concurrent ADB Connections . . . 59
3.2.6 Enabling Parallel Execution of AVDs . . . 59
3.4 Discussion . . . 67
3.5 Bibliographical Notes . . . 68
4 Combining Usage and GUI Models to Support Automatic Test Cases Gen-eration 69 4.1 Background and Related Work . . . 72
4.2 Mining and Generating Actionable Execution Scenarios with Mon-keyLab . . . 74
4.2.1 Record: Collecting Event Logs from the Crowd . . . 76
4.2.2 Mine: Extracting Event Sequences from Logs and the App . . 77
4.2.2.1 Mining GUI events statically from APKs (APK Ana-lyzer) . . . 78
4.2.2.2 Mining GUI events from event logs (Data Collector) . 79 4.2.3 Generate: Event Sequences with Language Models . . . 80
4.2.3.1 Language Models . . . 81
4.2.3.2 Language Model Flavors . . . 82
4.2.3.3 Generating Event Sequences . . . 83
4.2.4 Validate: Filtering Actionable Scenarios . . . 84
4.3 Empirical Study Design . . . 87
4.3.1 Data Collection . . . 87
4.3.2 Design Space . . . 89
4.4 Results . . . 89
4.4.1 RQ1: Language Models and Flavors . . . 90
4.4.2 RQ2: MonkeyLab vs. Android UI monkey . . . 92
4.4.3 RQ3: MonkeyLab vs. DFS . . . 93
4.4.4 RQ4: MonkeyLab vs. Manual execution . . . 94
4.5 Discussion . . . 97
4.6 Bibliographics Notes . . . 98
5 Visual Aesthetics Matter: Multi-Objective Optimization of Energy Con-sumption of GUIs in Android Apps 100 5.1 Optimizing Energy Consumption of GUIs with GEMMA . . . 104
5.1.1 Estimating the Power Consumption . . . 105
5.1.2 Extracting Color Composition from GUIs . . . 106
5.1.3 Multi-objective Optimization Model . . . 112
5.2 GEMMA’s Architecture . . . 118
5.2.1 The GEMMA Web Client . . . 119
5.2.2 The GEMMA Collector . . . 120
5.2.3 The GEMMA Execution Engine . . . 121
5.2.4 GEMMA in Action . . . 123
5.3 Empirical Study Design . . . 125
5.3.1 Research Questions . . . 126
5.3.2 Choice of Multi-Objective Optimization Techniques for GEMMA’s Evaluation . . . 128
5.3.3 Context Selection . . . 130
5.3.4 Data Collection . . . 132
5.3.5 Data Analysis . . . 137
5.4 Study Results . . . 139
5.4.1 RQ0: Which multi-objective optimization approach is suitable forGEMMA? . . . 140
5.4.2 RQ1: To what extent is GEMMA able to optimize the GUI energy consumption, contrast, and design objectives? . . . 143
5.4.3 RQ2: Are the color compositions generated by GEMMA
vi-sually attractive as perceived by Android users? . . . 147
5.4.4 RQ4: Would actual developers of mobile applications consider changing colors in an app as recommended byGEMMA? . . . 152
5.5 Threats to Validity . . . 157
5.6 Related Work . . . 158
5.6.1 Improving Energy Consumption of GUIs . . . 158
5.6.2 Detecting Energy Bugs in Mobile Apps . . . 159
5.7 Discussion . . . 160
5.8 Bibliographical Notes . . . 161
6 Conclusion 163 Bibliography . . . 195
ACKNOWLEDGMENTS
This dissertation is the result of four years of research at the College of William and Mary. During that time, I had the honor to work with and to be mentored by amazing people from di↵erent countries, in particular the USA and Italy. I would like to thank them for all their support, help, and guidance. In particular, I would like to thank Denys Poshyvanyk, who was not only my advisor but also my coach who helped me to improve and empower several academic and personal aspects. My thanks go to Gabriele Bavota, a research collaborator and a friend, who has been a role model to follow because of his excellence as a researcher, a professor, and a human being; Massimiliano Di Penta and Rocco Oliveto, research collaborators, who provided me with outstanding advice and helped me to improve my skills as a researcher; my American brother Christopher Vendome, and the Android SEMERU team (Carlos Bernal-C´ardenas and Kevin Moran), who are unconditional friends and collaborators; Bogdan Dit and Collin McMillan, former members of the SEMERU group, who helped and supported me during my initial steps at William and Mary. Finally, I am grateful to my family and Clau, who have been my emotional and spiritual pillars.
LIST OF TABLES
3.1 Overview of the Essential and Accidental Challenges Discussed (Rel-evant section numbers are indicated next to each challenge or solu-tion, as well as corresponding links to detailed solutions in our online appendix [20] are given as citations. Text in blue represent partial solutions, green fully or mostly solved solutions, and red challenges that are currently unsolved.) . . . 44 3.2 Proposed approaches for parallel and large-scale execution of Android apps. The columns
are as follows: 1) Purpose of the tool [Security Evaluation, TestingCloud]; 2) Device Type [PhysicalDevice,Emulator,VirtualMachine]; 3) Tool used for injecting input events [Manual,
Robotium,MonkeyRunner,UiAutomator]; 4) Type of exploration strategy [Manual,Systematic,
Multiple,Ruled-based, Random]; 5) Requires Instrumentation [Yes, No] ; 6) Type of Anal-ysis [Static Analysis, Dynamic Analysis] ;7) Number of instances or clients executed in the experimentation phase . . . 66
4.1 Android Apps Used in our Study. The stats include the number of activities, methods, and GUI components. Last two columns list the number of raw events (#RE) in the event logs (i.e., lines in the files collected with the getevent command) and GUI level events mined from the raw logs (#GE) . . . 89 4.2 Accumulated Statement Coverage of the LMs . . . 90
5.1 Android apps considered in our study. . . 129 5.2 Hypervolume: Wilcoxon test (adjustedp-values) and Cli↵’s delta (d). 139
5.3 ECF: Wilcoxon test (adjustedp-values) and Cli↵’s delta (d). . . 142 5.4 CF: Wilcoxon test (adjustedp-values) and Cli↵’s delta (d). . . 142 5.5 DF: Wilcoxon test (adjustedp-values) and Cli↵’s delta (d). . . 142 5.6 ECF and CF: Wilcoxon test (adjusted p-values) and Cli↵’s delta (d). . 144 5.7 RQ2: Wilcoxon test (p-value) and Cli↵’s delta (d). . . 149
5.8 RQ3: Wilcoxon test (p-value) and Cli↵’s delta (d) for pairwise
com-parisons of energy measurements (current in mA): original design vs lowest ECF . . . 152 5.9 Battery life (in hours) when using the original version of a mobile
application, and app modified with the GEMMA solution with the lowest energy consumption (lowest ECF). The columnDif f.lists the relative di↵erence in percentage, i.e., lowestECF originaloriginal . . . 152 5.10 Energy Optimization of Android Apps . . . 159
LIST OF FIGURES
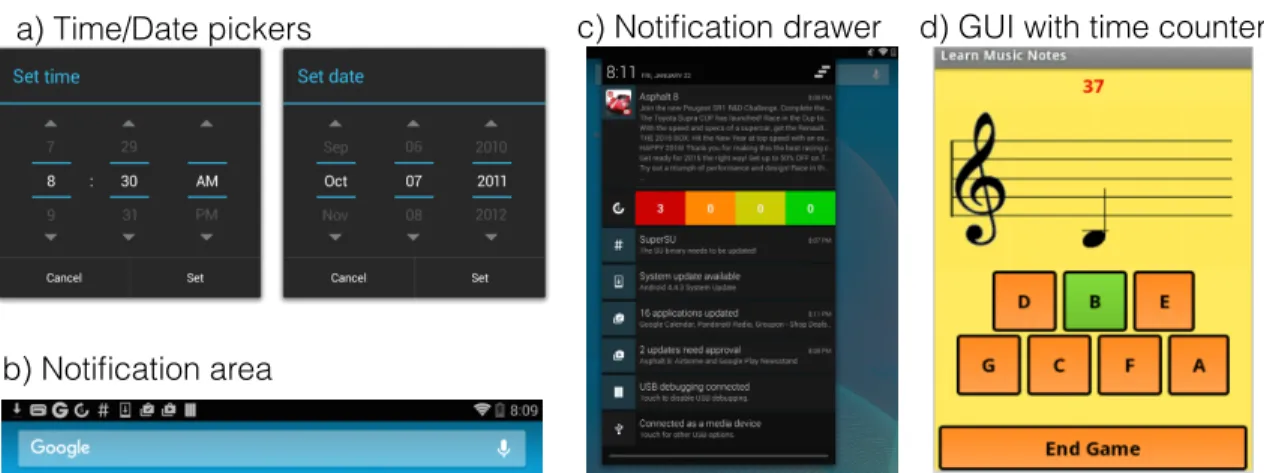
3.1 Examples of GUI components in Android apps that are problematic
for automated test cases. . . 45
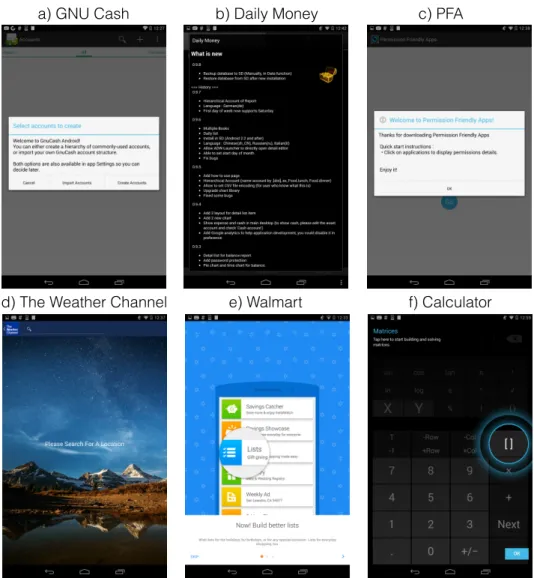
3.2 Example of splash/welcome screens, dialogs, and semi-transparent overlays that appear in Android apps during cold-starts or the first time a feature is used. . . 49
3.3 A proposed architecture for enabling large-scale execution and testing of Android apps. . . 63
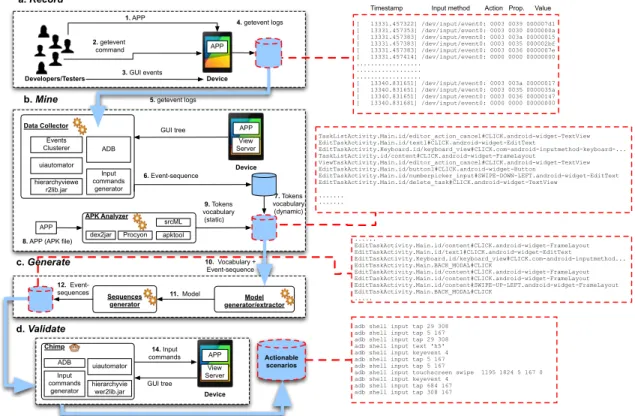
4.1 MonkeyLab architecture and theRecord!Mine !Generate!Validate framework . . . 77
4.2 Accumulated Coverage for GnuCash . . . 90
4.3 Accumulated Coverage for CarReport . . . 91
4.4 Accumulated Coverage for Tasks . . . 91
4.5 Accumulated Coverage for MyExpenses . . . 92
4.6 Accumulated Coverage for Mileage . . . 92
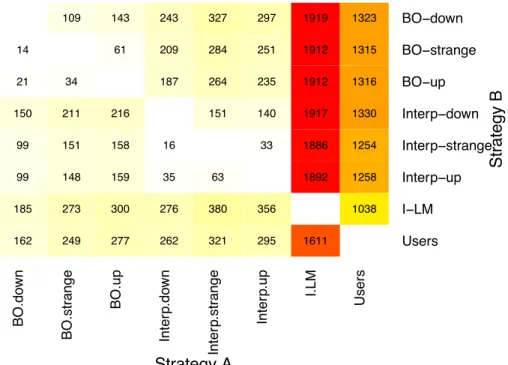
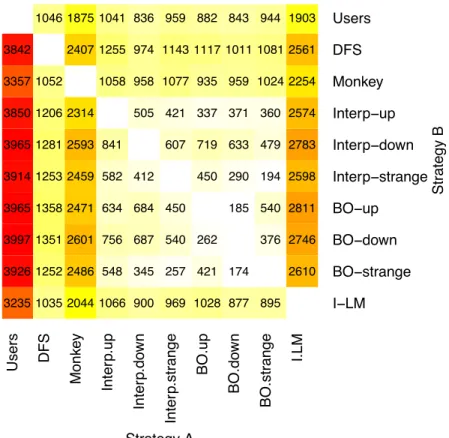
4.7 Total number of events executed by Strategy A that are not executed by Strategy B. The key color goes from white (zero) to red (highest value) . . . 93
4.8 Total number of source code methods in which coverage is higher when comparing coverage of Strategy A versus Strategy B . . . 94
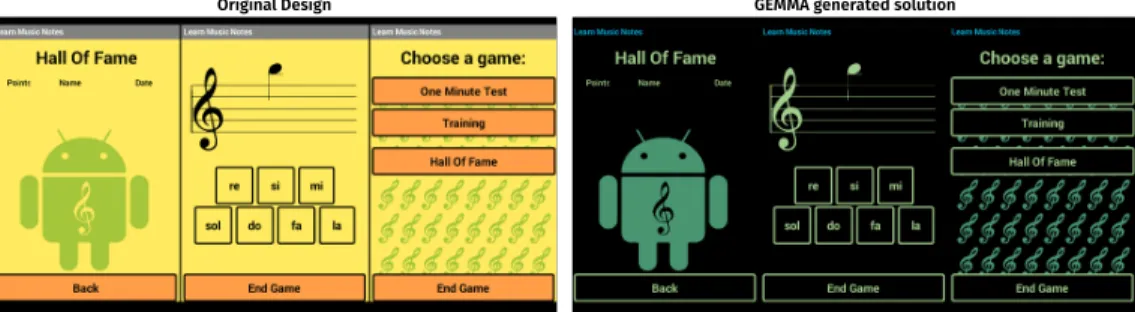
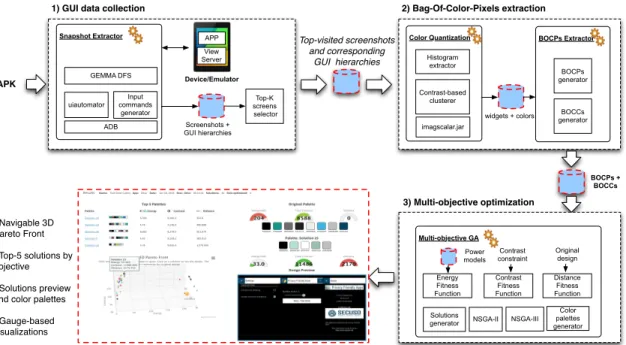
5.1 Original design vs GEMMA’s solutions for the Learn Music Notes app. Each solution shows the color composition for three GUIs in the app. . . 101 5.2 The GEMMA approach and components . . . 104 5.3 Current (mA) consumption models for primary colors of the Galaxy
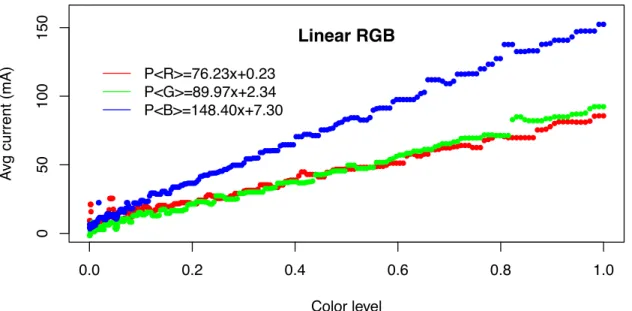
S4 SUPER AMOLED screen in standard RGB color space. . . 107 5.4 Current (mA) consumption models for primary colors of the Galaxy
S4 SUPER AMOLED screen in linear RGB color space. . . 107 5.5 Example of palettes (20 colors each) with equidistant harmony (top),
equidistant harmony with random saturation and brightness (middle), and monochromatic scale (bottom). . . 115 5.6 Architecture of the GEMMA Web Client and the Execution Engine. . 119 5.7 List of user requests (i.e., GEMMA tasks) in the GEMMA web
client. . . 122 5.8 Dashboard ofGEMMA’s solutions for the Privacy Friendly Dicer app.124 5.9 Pareto Front (top) and gauge style visualizations (bottom) inGEMMA.125 5.10 Screenshots of the GEMMA Collector Android app when running
on a Nexus 7 tablet and collecting GUIs information for the Game Master Dice app. The screenshots in this Figure are: initial activity (left), collection view (center), pre-submission activity (right). . . 126 5.11 Hypervolume for the three algorithms. . . 140 5.12 Boxplots of ECF, CF, and DF for di↵erent solutions generated by the
three algorithms. . . 141 5.13 Original designvs GEMMA’s solutions for the Tasks app. . . 145 5.14 Original designvs GEMMA’s solutions for the Play Music app. . . . 145 5.15 Original designvs GEMMA’s solutions for the Keep app. . . 146
5.16 RQ2: Boxplots of answers provided by participants. OD=Original
Design, LE=Lowest ECF, ME=Median ECF. . . 149 5.17 Current (mA) drawn by the analyzed apps. Each plot depicts the
range (i.e., min to max) of the average current for each step across the 30 executions for (i) original app (in red), and (ii) modified ver-sion with GEMMA GUI composition for low energy-consumption (in cyan). The circles depict the averages in each range. . . 150 5.18 Percentage of battery consumed by the analyzed apps. Each plot
depicts the average consumption per each step across the 30 executions for (i) original app (in red), and (ii) modified version with GEMMA GUI composition for low energy-consumption (in cyan). . . 151 5.19 Example of GUI without significant improvement in the energy
con-sumption for the Simple Deadlines app. . . 153 5.20 Example of GUI without significant improvement in the energy
con-sumption for the Tasks: Astrid To-Do List app. . . 154 5.21 IdeaSoftware app: Original design vs GEMMA’s solution (excerpts). 155
6.1 A general infrastructure for generating test sequences with di↵erent purposes . . . 165
Chapter 1
Introduction
The last decade has seen the tremendous proliferation of mobile computing in our society. Billions of users have access to millions of mobile applications that can be installed di-rectly to their mobile devices and electrical appliances such as TV handsets without any
complicated setup. Moreover, the current o↵ering of mobile applications is not only
lim-ited to games or apps for entertainment but also represents several categories of common computing tasks that users more frequently choose to carry out in the intuitive Graphical User Interface (GUI) of a smart phone. When considering only the top-2 platforms in
terms of market share, the app o↵erings are represented by more than 3M apps available
for download: Google Play (the official store for Android apps) o↵ers about 1.9M apps
organized in 23 di↵erent categories (data for 2016 Q1), and Apple’s App store contains
1.4M+ apps also in 23 domain categories (data for 2015 Q2).
From developers’ perspective, there are several reasons why mobile economy is attrac-tive to them; and these reasons are not limited only to cultural popularity of mobile devices and apps. Factors such as new monetization/revenue models, programming models, and distribution infrastructures contribute to an “attractive” movement that captivates new and traditional developers, as well as a crowd of other professionals that explore, de-sign, and implement mobile apps [232]. Also, the need for “enterprise apps” that support start-ups or serve as a new front-end for traditional companies is pushing software-related
professionals to embrace the mobile technologies [232]. However, the nature of the econ-omy (including devices, apps, markets) imposes new challenges to the way how mobile apps are envisioned, designed, implemented, tested, released, and maintained. The mo-bile development cycle is built around the usage of online app markets that (i) allow
developers to publish apps and crowdsource requirements (as user ratings and reviews1),
and (ii) allow users to access a large o↵ering of apps and to quickly discard/uninstall the
apps when expectations are not accomplished by the apps. The rating/reviews mechanism in online app markets is a cheap way to collect thousands of real requirements from the
users, which also imposes a significant overhead on the developers because of the e↵ort
required to analyze the user reviews, distinguish informative reviews from non-informative ones, and prioritize the feature requests/bugs for the next release.
The mobile development cycle is mostly represented by the iterative/incremental
se-quence: development ! publishing ! reviews analysis ! development ! publishing
! . . . development, and there are very specific challenges that mobile developers cur-rently face during the development cycle such as the constant pressure from the users for frequent releases (i.e., continuous delivery) [142, 133, 143]; rapid platform/library evolu-tion and API instability [163, 168, 185, 69]; complex reporting and bug report reproduc-tion involving complex multitouch gestures [100]; platform fragmentareproduc-tion [121]; impact of reviews and ratings on the success of the apps [125, 163, 134, 200, 97, 76, 190, 78];
cloning and reuse across di↵erent markets [192, 189, 165]; management of crowd-sourced
requirements [78, 134, 201]; limited availability/adequacy of testing tools for mobile apps [143, 146]; limited computational resources in mobile devices (e.g., memory, battery); among the others. These challenges are not considered by traditional/contemporary soft-ware development methods and techniques; therefore, the mobile softsoft-ware development lifecycle and their disciplines (e.g., evolution and testing) require new models, methods, and techniques. The need for a new “software engineering” for mobile applications is
1It is worth noting that reviews not only contain feature requests, but also bug reports, users’ sentiments,
even more evident with respect to their evolution and maintenance, mainly due to market pressure demanding rapid release cycles and a mostly crowdsource-based nature of requirements management [201].
As a response to the challenges, tremendous amount of research has been conducted to propose a new software engineering toolbox for mobile development. However, some
key challenges forevolution and maintenance of mobile apps, such as dynamic
anal-ysis, testing, and energy consumption, lack e↵ective industrial-grade solutions to support
developers and testers. This dissertation presents an in-depth analysis of these key issues
and an initial set of solutions forsupporting evolution and maintenance of Android apps,
in particular native Android apps running on handheld devices. The proposed solutions are rooted into (i) empirical studies performed to understand the challenges of the mobile development ecosystem (Chapter 2), and (ii) an infrastructure designed and implemented to support large-scale dynamic analysis and testing of Android apps (Chapter 3). This dissertation also presents two automated approaches that support two key challenges for
evolution and maintenance of Android apps: automatic test cases generation (Chapter 4) and automatic optimization of GUIs to reduce energy consumption (Chapter 5).
In summary, this dissertation makes the following research contributions:
• Empirical Studies. As part of the dissertation, a set of empirical studies were
per-formed to analyze phenomena such as: Android API instability; developer practices for detecting/fixing performance bottlenecks and for micro-optimizing Android apps “in the wild”; usage of crowdsourced reviews to plan releases; developer practices for documenting and designing test cases; and energy-greedy APIs. The studies
com-bined di↵erent data collection and analysis techniques, and for some of the studies
new approaches were implemented to enable these analyses; for instance, as part of the analysis of developers’ reaction to Android API instability, we designed a traceability link recovery technique for linking StackOverflow questions to Android API changes. The studies helped improve current understanding of the nature of
the mobile development, practices performed by developers, and challenges specific to the Android ecosystem. Therefore, our studies and corresponding results have been widely discussed and cited by the research community. In fact, the studies on the Android API instability problem were the first of its kind in the software engineering community; moreover, we performed the first large-scale study aimed at analyzing real practices of open source developers for micro-optimizing Android apps, and for detecting/fixing performance issues in Android apps. Some of the key insights extracted from the studies are summarized as in the following:
– Change and fault proneness of the Android API is a threat to the success of
Android apps, and developers lack automatic notification tools when changes to the API can introduce bugs in the apps [163, 168, 69];
– Developers strongly rely on user reviews when planning new releases of their
apps and mainly rely on user reviews for detecting bugs experienced by the users as well as for suggestions of new features [201];
– Android developers prefer dynamic analysis and observation-based techniques
to detect opportunities for improving the performance of their apps [161];
– Micro-optimizations are not widely used by open source developers, and the
impact of micro-optimizations is noticeable only under certain “load” conditions that might appear only on specific types of apps;
– Manual testing is preferred over automated testing, and execution of use cases
or sequences of test cases are the preferred criteria for designing test cases;
– Coverage analysis is not considered as useful to measure the quality of test
cases by mobile developers;
– GUI and database related classes and methods in the official API are the most
The main findings from the empirical studies suggest that dynamic analysis is a crucial mechanism to support evolution and maintenance of Android apps; moreover,
e↵ective dynamic analysis requires scalable infrastructural support for automatic
execution of mobile apps under di↵erent conditions (e.g., di↵erent devices).
• An Infrastructure for Large-scale Analysis and Testing of Android apps.
Fragmentation at OS and device level is one of the most pressing challenges for mobile development because during evolution and maintenance, new features and
fixes should be tested under di↵erent contextual events on a multitude of di↵erent
platforms. However, manual testing is still preferred over automated approaches; in fact, development teams lacking testing resources usually test their apps only on a subset of devices [143, 149]. One of the main reasons for the preference for manual testing is the expensive maintenance of automated test cases and the lack of tools supporting large-scale testing. Therefore, we designed T+, an infrastructure for
automatic generation of actionable test cases that can target di↵erent purposes and
combine di↵erent sources of information. Under T+ we also designed the Execution
Engine, which is an extensible infrastructure for large-scale execution of Android apps on virtual devices. T+ was published at the ACM SIGSOFT Student Research
Competition at the 37th IEEE International Conference on Software Engineering
(ICSE 2015) [162], and won the Gold Medal (First Place) in the Graduate Student
Category. The Execution Engine was inspired by the taxonomy of accidental and essential issues (and corresponding solutions) for large-scale execution of Android apps; this taxonomy was devised as part of the industrial collaboration with a major telecommunication company (Huawei). Both, T+ and the Execution Engine, are the foundations of our proposed solutions for supporting automated GUI testing and improving energy consumption of Android apps.
• Supporting Automated GUI testing. We propose a novel hybrid approach for
Our approach (namely MonkeyLab) derives feasible and fully replayable GUI-based event sequences for (un)natural app usage scenarios (i.e., actionable scenarios), which provides stakeholders with an automated approach for scenario generation
that can be as powerful as manual testing (Chapter 4). MonkeyLabincludes a novel
mechanism for generating actionable scenarios that is rooted in mining event traces, generating execution scenarios via statistical language modeling, static and dynamic analyses, and validating these resulting scenarios using interactive executions of the app on real devices (or emulators). In particular, we explore interpolated n-grams
and back-o↵ models, and we propose three di↵erent flavors (i.e., up, down, and
strange) for generating (un)natural scenarios. MonkeyLabwas originally published
in the12th IEEE Working Conference on Mining Software Repositories (MSR 2015)
[171].
• Improving Energy consumption. Finally, we propose a multi-objective
ap-proach, called GEMMA, for generating color compositions that reduce the energy
consumption of GUIs in Android apps and are visually attractive at the same time
(Chapter 5). GEMMA combines power models, pixel-based engineering, color
the-ory, dynamic analysis, and a multi-objective optimization technique to produce a Pareto-optimal set of design solutions (i.e., GUI color compositions) across three
di↵erent objectives: (i) reducing energy consumption, (ii) increasing contrast, and
(iii) improving the attractiveness of the chosen colors by keeping the palette close
to the original one. GEMMA is the very first approach adopting multi-objective
optimization to choose colors for mobile apps with the main goal of reducing energy consumption, that accounts for multiple screens and the duration of time they are
displayed, and produces pleasant and consistent color combinations. GEMMAwas
originally published in the 10th Joint Meeting of the European Software
Engineer-ing Conference and the ACM SIGSOFT Symposium on the Foundations of Software
Chapter 2
Empirical Studies
The way the mobile apps are developed represents a paradigm shift (as compared to the traditional desktop and web applications) not only because of gesture-driven interaction
of these apps, but also due to the di↵erences in the development cycle. For instance, apps
are distributed using online markets; release periods are shorter; features planning and development is highly impacted by crowdsourced requirements; and device/OS
fragmenta-tion introduces addifragmenta-tional overhead in terms of testing e↵orts. However, by the time when
this thesis was conveived, several of the mobile development challenges remained without solutions, and the research community lacked understanding of important facets of mo-bile apps maintenance and evolution. Proposing solutions and new approaches supporting evolution and maintenance of Android requires understanding of developers’ practices and challenges. Therefore, in the first research thrust, several facets from the Android mobile ecosystem were analyzed by conducting empirical studies. The studies aimed at under-standing current practices performed by practitioners in-the-wild, and the challenges they face when maintaining and evolving Android apps.
The decision to conduct empirical studies was motivated by the lack of reports, ev-idence, and empirical data describing (i) how practitioners evolve and maintain mobile apps, and (ii) the disciplines in the development cycle associated with the evolution and maintenance tasks. In that sense, we relied on several methods widely used in Empirical
Software Engineering for data collection and analysis, such as mining software repositories, grounded theory, surveys with practitioners, and controlled experiments.
In this chapter we summarize the studies and the main findings; we do not provide all the details concerning motivation, study design, results, and the related work. However, we invite the interested reader to check all the details of each study in the corresponding publications listed in Section 2.8.
2.1
Android API instability [163, 69]
Stability and fault-proneness in the Android API is a sensitive and timely topic, given the frequent releases and the number of applications that use these APIs. Therefore, we designed two case studies [163, 69] to provide solid empirical evidence and shed some light on the relationship between the success of apps (in terms of user ratings), and the change-and fault-proneness of the underlying APIs (i.e., Android API change-and third-party libraries).
In the first study we analyzed to what extent the APIs fault- and change-proneness a↵ect
the user ratings of the Android apps using them, while in the second we investigated to what extent Android developers experience problems when using APIs and how much they feel these problems can be causes of unfavorable user ratings/comments.
The first study (in the following referred to as “API-Study I”) was conducted on a set
of 5,848 Android free apps belonging to di↵erent domains. We estimated the success of
an app based on the ratings posted by users in the app store (Google Play1). Then, we
identified the APIs used by those apps, and computed the number of bug fixes in those
APIs. In addition to the bug fixes, we computed di↵erent kinds of changes occurring in
such APIs, including changes in the interfaces, implementation, and exception handling. Finally, we analyzed how the user ratings of an app are related to APIs fault- and
change-proneness, specifically to di↵erent kinds of changes occurring to APIs. This study was
mainly aimed at providing possible quantitative evidence about relationship between APIs
fault- and change-proneness, and the apps’ ratings. However, especially because we have
no visibility over the source code of such apps and of their issue trackers, it is difficult to
provide a strong rationale and, possibly, a cause-e↵ect relationship for such findings.
In order to provide explanations to the findings of API-Study I, we conducted a sec-ond study (in the following referred as “API-Study II”). This study consisted of a survey, and it involved 45 professional Android developers. We asked such developers to fill-in a questionnaire composed by 21 questions organized into five categories: (i) developer’s background, (ii) factors negatively impacting user ratings, (iii) frequent reasons causing bugs/crashes in Android apps, (iv) experiences with used APIs, and (v) impact of prob-lematic APIs on the user ratings. Then, we quantitatively analyzed the answers to 19 questions by using descriptive statistics, and completed the analysis with qualitative data gathered from the other two questions.
It is important to point out that this work does not claim a cause-e↵ect relationship
between APIs fault- and change-proneness and the success of apps, which can be due to several other internal (e.g., app features and usability) and/or external (e.g., availability of alternative similar apps) factors. Instead, the purpose of the study was to investigate whether the change- and fault-proneness of APIs used by the app relates (or not) to the app success, measured by its ratings. That is, a heavy usage of fault-prone APIs can lead to repeated failures or even crashes of the apps, hence, encouraging users to give low ratings and possibly even abandoning the apps. Similarly, the use of unstable APIs that undergo numerous changes in their interfaces can cause backward compatibility problems or require frequent updates to the apps using those APIs. Such updates, in turn, can introduce defects into the applications using unstable APIs. In the following we summarize the research questions and corresponding results. Complete details of the studies are with the FSE and TSE publications [163, 69].
2.1.1 RQ1: Does the fault-proneness of APIs a↵ect the user ratings of
Android Apps?
APIs used by apps having higher user ratings are, on average, significantly less fault-prone than APIs used by low rated apps. However, it is interesting to understand if the observed
di↵erence in terms of APIs fault-proneness between apps having di↵erent levels of rating
is due to the used official Android APIs, third-party APIs, or to both of them. To this
aim, we separately investigated the fault-proneness of the official Android APIs and of the
third-party APIs used by the apps object of our study.
Concerning the official Android APIs, apps having ahigh rating use APIs that
under-went, on average, 6.2 bug fixes, as compared to the 9.7 (+56%) of apps having a medium
rating and the 13.0 (+109%) of apps having alow rating. This result is inline with what
we observed when analyzing all the used APIs as a whole. Also the results of the
Mann-Whitney test confirm that official Android APIs used by apps having a higher average
user rating are, on average, significantly less fault-prone than APIs used by low rated apps. Indeed, as already observed when considering all APIs, apps having a higher rating always exhibit a statistically significant lower number of bug fixes in the used APIs than
apps having a lower rating (p-value always< 0.0001).
When analyzing third-party APIs in isolation we only considered the 1,224 apps using at least one third-party API since not all the considered apps use third-party APIs. In
this case we observed a slightly di↵erent trend:
• Apps having ahigh rating use third-party APIs subject, on average, to 1.3 bug-fixing
activities.
• Apps having amedium rating use third-party APIs subject, on average, to 3.6
bug-fixing activities (+177%).
• Apps having alow rating use third-party APIs subject, on average, to 2.7 bug-fixing
Thus, while it is confirmed that apps having a high rating use less fault-prone APIs than
apps having amedium and alow rating, from the average values it seems that apps having
amedium rating use APIs more fault prone than those used by apps having a low rating. However, by looking into the data we found that this result is mainly due to a set of 28
apps falling in themediumrating category and all using the same (fault-prone) third-party
APIs. In particular, these 28 apps are developed by the same software house2 and use
APIs subject to a number of bug-fixes going from a minimum of 23 to a maximum of
46, clearly raising the average value of bug-fixes in the medium rating category. In fact,
when comparing the fault-proneness of the three categories by using the Mann-Whitney test , we obtained that apps having higher ratings use APIs statistically significant less
fault-prone than low rated apps, even when comparing apps having amedium rating with
those having alow (p-value always <0.0001, with a small e↵ect size).
Summarizing, the results of ourRQ1 show that the higher the ratings of the apps, the
lower the fault-proneness of the APIs they use. This holds when considering all APIs, as
well as the official Android APIs and third-party APIs in isolation.
2.1.2 RQ2: Does the change-proneness of APIs a↵ect the user ratings
of Android Apps?
As done for the fault-proneness, we also analyzed the change-proneness of APIs used by
the di↵erent categories of apps by isolating official Android APIs and third-party APIs.
Concerning the official Android APIs, we observed that those used by apps having high
user ratings are significantly less change prone than those used by low rated apps, as also
confirmed by the results of the Mann-Whitney test (p-value always<0.0001 with a small
e↵ect size). In particular:
• In terms of overall method changes, apps having a high rating use APIs that
un-derwent, on average, 25 changes, as compared to the 37 (+48%) of apps having a
2http://www.androidpit.it/it/android/market/applicazioni/list/owner/LightCubeMagic
medium rating and the 48 (+92%) of apps having a low rating. This trend is also
confirmed when just considering changes to public methods, with apps having low
rating using APIs subject to 27 changes, on average, 80% more than the apps having
high rating.
• When focusing on changes performed on method signatures, apps having a high
rating use APIs object, on average, of 5 changes, 40% less than APIs used by apps
having amedium rating and 80% less than APIs used by apps having alow rating.
These results are also confirmed when just focusing on public methods.
• If restricting our analysis to the Android APIs only, we do not observe any
statisti-cally significant di↵erence in terms of changes performed to the exceptions thrown
by methods between the di↵erent categories of apps.
Turning to the third-party APIs, the results of the Mann-Whitney test showed that the change-proneness of APIs used by apps having high user ratings is lower in a statistically
significant way. Moreover, when comparing apps having a high rating with those having
a low rating, we obtain a large e↵ect size for all type of changes. For instance, when
considering all changes performed to the API methods, we go from the three changes, on
average, of APIs used by apps having a high rating to seven changes (+133%) of APIs
used by apps having a low rating. The same trend has been also observed when (i) just
focusing on public methods, and (ii) just considering the changes occurred to (public) methods’ signature.
Summarizing, the results of RQ2show that the higher the average ratings of the apps,
the lower the change-proneness of the APIs they use. This holds when considering all APIs,
as well as when restricting our attention to official Android APIs or third-party APIs only.
Instead, there is no significant di↵erence when the changes are on the exceptions thrown
by API methods. Again, this result holds for all APIs as well as for the official Android
2.1.3 RQ3: To what extent Android developers experience problems
when using APIs?
Among the 45 developers answering our questionnaire, 33 (73%) said they have experi-enced problems with the used APIs. Of these 33, 21 indicated Android APIs as the cause of the problems, and 12 indicated third-party APIs. Again, this is likely because most of the APIs used in the apps belong to the Android SDK, and only few of them are
third-party ones3. Also, 64% of developers (29) declared to have observed new bugs in their
apps introduced as a consequence of new releases of the Android platform. Summarizing,
the study results forRQ3 indicate that:
• A large percentage of the developers (between 44% and 71%) consider change- and
fault-proneness of APIs as threats to the proper working of their apps. When fo-cusing on problems related to the APIs (i.e., considering all the answers but the “Java programming errors in the app” one), developers perceive that bugs present in third-party APIs represent the most frequent cause of bug introduction in their apps.
• Developers are generally more concerned about the e↵ect of bugs present in the used
APIs than about changes performed in new releases of the used APIs; this is true
for both third-party as well as official Android APIs.
• Developers believe that more bugs are present in third-party APIs than in the official
Android APIs. However, they are more concerned about the change-proneness of the Android platform than of the change-proneness of third-party APIs. This result likely has a two-fold explanation. First, the Android APIs have been object of a very
fast evolution4 leading to 18 major releases over just four years. It is very unlikely
that also third-party APIs have evolved so fast. This is also confirmed by the average
3Note that in our first study, we found just 21% of the considered apps to use at least one open source
third-party API.
4https://developer.android.com/reference/android/os/Build.VERSION_CODES.html verified on
frequency of commits per month observed in Study I for the Android APIs (164 commits per month) as compared to the third-party APIs (14 commits per month). Thus, developers have more likely experienced bugs introduced by major changes in the Android APIs than by changes in the used third-party libraries. Second, Android API reuse by inheritance is widely implemented by developers [192, 189],
and Android apps are highly dependent on the official Android APIs [222]. Almost
50% of classes in Android apps inherit from a base class as shown in a recent study by
Mojica Ruizet al. [192]. This, again, makes more likely for developers to experience
bugs due to changes in the official APIs than in third-party APIs.
2.1.4 RQ4: To what extent Android developers consider problematic
APIs to be the cause of negative user rating/comments?
Of the 45 surveyed developers, 28 (62%) declared to have observed a relationship between problems experienced with the used APIs and bad user’s ratings/comments. These 28 developers evaluated the severity of the observed impact, providing a score on a five point
Likert scale between 1=very low and 5=very high. The median is 4 (i.e., high impact)
indicating that the use of problematic APIs could strongly impact the rating of an app form the developers’ point-of-view. Also, it is important to note that no one of the
developers assessed the impact at a value lower than 3 (i.e.,medium impact). This means
that developers, in their experience, not only observed a decrease of the ratings assigned by users to their apps as consequence of problems in the used APIs, but also that this decrease was substantial.
The answers provided by developers to questions related to RQ4 indicate that 62%
of developers perceived a direct relationship between problems experienced with the used APIs and bad users’ ratings/comments, and the impact of such APIs on the apps’ user
ratings was considered asmedium-high. Also, the discussed examples support the
quanti-tative results obtained in our first study: the use of problematic APIs could represent a threat for the success of Android apps.
2.2
Usage of Crowdsourced Requirements [201]
The distribution of updates—related to the introduction of new features and to bug fixes— through app online stores is accompanied by a mechanism that allows users to rate releases using scores (i.e., star ratings) and text reviews. The former (i.e., the score) is usually expressed as a choice of one to five stars, and the latter (i.e., the review) is a free text description that does not have a predefined structure and is used to describe informally bugs and desired features. The review is also used to describe impressions, positions, comparisons, and attitudes toward the apps [134, 78, 203, 120, 200]. Therefore, online store reviews are free and fast crowd feedback mechanisms that can be used by developers as a backlog for the development process. Also, given this easy online access to app-store-review mechanisms, thousands of these informative reviews can describe various issues exhibited by the apps in certain combinations of devices, screen sizes, operating systems, and network conditions that may not necessarily be reproducible during regular development/testing activities.
By analyzing ratings and reviews, development teams are encouraged to improve their apps, for example, by fixing bugs or by adding commonly requested features. Accord-ing to a recent Gartner report’s recommendation [142], given the complexity of
mo-bile testing “development teams should monitor app store reviews to identify issues that
are difficult to catch during testing, and to clarify issues that cause problems on the users’ side”. Moreover, useful app reviews reflect crowd-based needs and are a valuable source of comments, bug reports, feature requests, and informal user experience feedback [76, 78, 97, 134, 200, 147, 191]. However, because of this easy access to the app stores and lack of control over the reviews’ content, relying on crowdsourced reviews for planning releases may not be widely used by mobile developers because of (i) the large amount of reviews that need to be analyzed, and (ii) some of these reviews may not provide tangible benefits to developers [78].
investi-gating to what extent app development teams can exploit crowdsourcing mechanisms for planning future changes, and how these changes impact user satisfaction as measured by follow-up ratings. We performed (i) a mining study conducted on 100 Android open source apps in which we linked user reviews to source code changes, and analyzed the impact of implementing those user reviews in terms of app success (i.e., ratings); and (ii) an online survey featuring 73 responses from mobile app developers, aimed at investigating whether they rely on user reviews, what kind of requirements developers try to elicit from user reviews, and whether they observe benefits in doing that. The study makes the following noteworthy contributions:
• A novel reviews-to-code-changes traceability recovery approach, called CRISTAL.
The approach combines classic Information Retrieval (IR) based traceability recovery
approaches (e.g., [61, 184, 209, 208]) with some specific heuristics to deal with (i)
diversity and noise in crowd reviews, and (ii) inherent abstraction mismatch between reviews and developers’ source code lexicon.
• Results of a survey conducted with 73 Android developers and aimed at investigating
the developers’ perception of user reviews, to what extent they address them and whether they observe any tangible benefits from such an activity.
• Results of an empirical study conducted on 100 Android apps. The study exploits
CRISTAL to provide quantitative evidence on (i) how development teams follow sug-gestions contained in informative reviews, and (ii) how users react to those changes.
• A comprehensive replication package [202]. The package includes all the materials
used in our studies.
In the following we summarize the research questions and corresponding results. The full details of the studies can be found in our ICSME’15 publication [201].
2.2.1 RQ1:To what extent do developers fulfill reviews when working on
a new app release?
Results obtained by mining 100 Android apps show that, in most cases, developers care-fully take into account user reviews when working on the new release of their app. Indeed, on average, 49% of the informative reviews are implemented by developers in the new app release. The survey respondents confirmed such findings, claiming that they often rely on the information in user reviews when planning a new release of their app (49% very often, 38% often). They mainly look in user reviews for bug reporting (75%) and suggestions for new features (68%). Also, they identify useful reviews by searching for the constructive and detailed ones (44%), containing more than just emotional expressions. The vast majority of the survey respondents (75%) indicate that just a small percentage
of user reviews is informative (<25%).
2.2.2 RQ2:What is the e↵ect of a crowd review mechanism (for planning
and implementing future changes) on the app success?
Developers of Android apps implementing user reviews are rewarded in terms of ratings; in fact, 90% of the surveyed developers (i.e., 66 out of 73) observed an increase of their app ratings as a consequence of user requests they implement. This is confirmed by the
observed positive correlation (0.59) between review coverage and change in overall score
between the old and the new app releases. Also, our qualitative analysis supports, at least in part, our quantitative findings. Answers provided by the surveyed developers confirmed that the small set of informative reviews represents a very precious source
of information, leading to the fixing of bugs difficult to catch during testing activities,
to the implementation of new successful features, and to the improvement of the app’s non-functional requirements. The vast majority of the respondents (90%) believes that
implementing requests from user reviews has a positive e↵ect on the app’s success (as
2.3
How Android Developers Detect and Fix Performance
Bottlenecks [161]
Despite the e↵orts of researchers [119, 174, 199] and mobile API designers in providing
developers with guidelines and best practices [9, 62, 60] for improving the performance of mobile apps, there is still a significant gap between research and practice in terms of dealing with performance issues by developers in the wild [174, 147].
Our work is empirical in nature and is aimed at filling this important gap and at increasing the understanding of current performance related practices by developers of Android apps. While previous empirical studies [119, 174, 199] focused on understanding
and categorizing performance bugs, the study described in this section [161], analyzedreal
practices that are followed andactual tools that are used by developers to fix performance related bugs. In the context of the study, 485 contributors of open source Android apps and libraries hosted on GitHub were surveyed, inquiring about their practices and tools for detecting and fixing performance bottlenecks; then, the repositories (i.e., bugs from the issue trackers and commits from the code change histories) of their apps were manually analyzed to study real performance bottlenecks and fix-inducing commits to investigate actual strategies followed by developers to deal with performance related issues. The study makes the following noteworthy contributions:
• To the best of our knowledge, this is the first study aimed at analyzingreal practices
of open source developers for detecting and fixing performance issues in Android apps;
• The study provides an overview and key insights into types of performance related
issues faced by developers as well as prevalent practices and tools used to deal with performance bugs and bottlenecks. The results also reveal current performance
related needs of developers that can be used to drive future e↵orts of researchers;
apps by providing the viewpoint of real developers via analysis of their practices;
• An extensive online appendix that includes the anonymized answers collected from
the survey, the list of tools reported by the participants, a taxonomy of practices for fixing performance bottlenecks, and examples of real performance bottlenecks in Android apps [25].
In the following we summarize the research questions and corresponding results. Com-plete details of the study can be found in our ICSME’15 publication [161].
2.3.1 RQ1: What practices are used by Android developers to detect
performance bottlenecks?
The results suggest that open source Android developers primarily rely onmanual testing
and analysis of the reviews for detecting performance bottlenecks. Manual execution of apps is also accompanied by tools that help measure and visualize performance-related measurements (e.g., execution time and memory). Despite the availability of tools for profiling performance-related measurements, a number of practitioners still rely on man-ually inserting statements in the code to measure and print execution time and memory consumption.
2.3.2 RQ2: What tools are used by Android developers to detect
per-formance bottlenecks?
Although there is a diverse set of available tools, Android developers mostly rely on tools for performance profiling and debugging of their apps; most of the tools are from Google, as expected. There is a preference towards tools supporting observation-based analysis, and most of the tools do not support automatic detection of bottlenecks. Only a few tools support automatic detection of a limited number of types of performance bottlenecks (Google’s StrictMode Android API and PerfChecker tool [174]), yet these tools are not
widely used. Static analysis tools are used less frequently and only in a few cases for detecting performance optimizations.
2.3.3 RQ3: What practices are used by Android developers to fix
per-formance bottlenecks?
We obtained 72 codes (after the open coding on free-text answers) identifying individual practices for improving performance bottlenecks. These 72 codes were further categorized into 16 groups by considering the type of practice (e.g., threading) or the goal (e.g., mem-ory management). Finally, these 16 groups were linked to the following types of high-level
categories: GUI lagging, Memory bloat, Energy leak, General-purpose, Unclear-benefit.
The first three categories represent performance bugs defined by Liuet al. [174]; thus, the
groups linked to these categories represent practices aimed at solving corresponding bug types (e.g., GUI optimization aims at reducing “Application Not Responding-ANR” errors and GUI lagging). The last two categories are for general-purpose cases (e.g., profiling) and when the perceived benefit is unclear. The complete taxonomy (codes, groups, and categories) is in our appendix [25].
The most frequent practices used by the surveyed developers for fixing performance bottlenecks include the usage of multi-treading to avoid lengthy operations in the main thread, GUI optimizations for reducing the complexity of the UI, caching to avoid redun-dant or blocking/time consuming resource accesses, memory management to avoid GC events and OOM errors, and source code optimizations.
2.4
How Developers Micro-Optimize Android Apps
Micro-optimizations consist of changes to the source code that are applied mostly at statement level and are not intended to change the system design or architecture. Some
of the tools for detecting potential micro-optimizations (e.g., FindBugs, LINT, PMD)
C/C++ systems. However, the e↵ectiveness of the suggestions (i.e., warnings about micro-optimization opportunities or bugs) provided by these tools has been previously questioned in the context of fault detection in C/C++ and Java systems [234, 247, 231, 230, 247, 66]. Moreover, little research has been done into understanding whether mobile developers per-form micro-optmizations, given the fact that mobile apps are more prone to perper-formance bugs [174].
In this section, we summarize the results of three empirical studies aimed at under-standing the usage of micro-optimizations in the wild, the reasons, and their impact when
optimizing Android apps5. First, we measured the persistence of micro-optimization
op-portunities6 in change histories of open source Android apps; in particular, we mined the
change histories of 3,513 Android apps hosted on GitHub to identify the most frequent
micro-optimization opportunities suggested by two static analysis tools (i.e., PMD and
LINT) in 297K+ snapshots of these apps (at commit level) and to understand if (and
when) developers implement these micro-optimization opportunities. Second, we analyze
the e↵ectiveness of micro-optimizations on the resource consumption of Android apps by
means of an in-depth analysis into whether implementing suggested micro-optimizations can help reduce memory and CPU usage in a sample of eight Android apps; to this we im-plemented a tool that automatically refactors micro-optimization opportunities and builds APKs from refactored source code. Finally, we investigated current practices of Android developers for improving the performance of their apps by conducting a survey involving 389 open-source Android developers to understand the state-of-practice with respect to micro-optimizing apps and the reasons for applying (or not) micro-optimizations in prac-tice. One limitation of our study is that Android-specific micro-optimizations for the GUI were not included, because they can not be automatically performed and their
implemen-5The publication supporting this Section is currently under review at the Journal: Empirical Software
Engineering. This is a joint work with Christopher Vendome and Michele Tufano from the SEMERU group.
6We use the term micro-optimization opportunities because (i) these are suggestions (more than must-do
changes) reported by static analysis tools, thus these tools might suggest false positives, and (ii) micro-optimizations e↵ectiveness might depend on the context (e.g., the impact of string micro-optimizations is noticeable with certain volume of string operations).
tation is always app-specific. Therefore, this paper represents a “starting point” for future
e↵orts in terms of validating the impact of existing Android-specific micro-optimizations
and providing developers with micro-optimizations that can have real impact on the per-formance of their apps.
The studies summarized in this sections make the following noteworthy contributions:
• To the best of our knowledge, this is the first set of studies aimed at analyzing
micro-optimization practices of open source Android developers.
• The studies contribute to understanding the nature of Android apps and the need
for specific practices that consider the context of the apps (i.e., device, OS); the theoretical assumption that practices with certain success in non-mobile systems can be transferred to mobile apps with the same results is not entirely valid as in the case of micro-optimizations, which require specific conditions that are not available in mobile apps (e.g., large number of String operations, or a large number of instantiations of objects in loops).
• An extensive online appendix that includes the anonymized answers collected from
the survey, a taxonomy of practices for detecting micro-optimzation opportunities, detailed results from the measurements study, and results from the mining study [26]. In the following we summarize the research questions and corresponding results. The publication supporting the results is under review at the journal of Empirical Software Engineering.
2.4.1 RQ1: What is the distribution of micro-optimization opportunities
across Android Apps at GitHub?
We utilizedLINT [32] andPMD [39] to identify performance-related warnings (i.e,
micro-optimization opportunities) in 3,513 Android open source projects. In total, we detected 56
suggest that Android open source developers mostly do not implement micro-optimizations to improve mobile apps performance. When analyzing the most recent snapshot of the 3,513 open source Android apps, we found a large number of micro-optimizations
oppor-tunities (detected byPMDandLINT). Importantly, we observed that the density of these
micro-optimization (i.e., normalized by the number of files and LOC) reflected the high
prevalence of micro-optimizations, since the densities mirrored the results for the raw fre-quencies. The top three micro-optimization types (i.e., MethodArgumentCouldBeFinal, LocalVariableCouldBeFinal, UnusedResources) amount to over 1.5 million instances where micro-optimizations might be implemented. The next two micro-optimization opportuni-ties in the top-5 list are UnusedIds and AvoidInstantiatingObjectsInLoops accounting for 53K+ instances.
2.4.2 RQ2: To what extent are micro-optimizations introduced or avoided
during the evolution and maintenance of Android apps?
The analysis method for RQ2 consisted of identifying the trends, by finding the function
that best describes (i.e., best fit) the evolution of the number of performance-related
warnings (i.e., micro-optimization opportunities) for each project at commit level. The
function fitting was implemented in MATLAB targeting a diverse set of functions to
avoid bias towards widely analyzed models (e.g., linear and power); in particular, for
the fitting, we used the following functions available with MATLAB: linear, quadratic, cubic, exponential, power, logarithmic, Weibull, sine, and first order Fourier series model (fourier1).
We observed a dominance of a first order fourier model fitting the number of
micro-optimization opportunities at each commit of the analyzed apps, when considering both
global data (i.e., al the micro-optimization categories) and data for each category. The
global distributions only showed linear-const as the dominant fitting at the 5th ranking
(i.e., top-5) of functions (235 projects), but it was prevalent for certain history sizes and particular warning categories. Of these projects, only 12 projects never had a
micro-optimization opportunity introduced during their revision history. However, we observed a
high prevalence oflinear-constantas the top two dominant function, when we investigated
the warnings categories. Additionally, we observe a decreasing function, in the top three fittings for the global data, but when normalized by LOC and only for projects with long histories. The results indicate that the most prevalent behaviors in terms of micro-optimization opportunities detected in the analyzed apps are (i) the opportunities increase during the app history, and (ii) the opportunities are constant, therefore, it suggests that developers mostly do not implement micro-optimizations in mobile apps.
2.4.3 RQ3: How do micro-optimizations impact CPU and memory usage
of Android apps?
To measure the impact of micro-optimizations, we focused on apps with a large number of micro-optimizations opportunities. Instead of measuring the impact of incrementally applying one, two, three, etc., micro-optimizations, we decided to measure the impact in a scenario when all the micro-optimizations opportunities are addressed. To this, we devel-oped a tool to automatically refactor (i.e., apply micro-optimizations) Android projects
(i.e., source code), based on the list of warnings reported byPMD and LINT. We utilized
a combination of AST-based analysis and textual transformations depending on the type of violation and required fix. The implementation of the micro-optimizations is based on
the practices and solutions suggested byPMD and LINT. The tool generates a refactored
version of an app (source code and APK) implementing either all the micro-optimizations belonging to a target category, or all the micro-optimizations in all the categories. Our tool after modifying the source code, automatically builds Android APKs. In addition to
our tool, we used the optimizations provided by Proguard [40], which is the state-of-the
practice tool for optimizing APKs. We used the specific configuration of Proguard for
optimizing apps as suggested by the related work [218]. In particular, this configuration performs (i) peephole optimizations for arithmetic instructions and casting operations, (ii) removes write-only fields, (iii) marks fields as private, if possible, (iv) propagates the
values of fields across methods, and (v) merges classes vertically and horizontally in the class hierarchy, whenever possible. It is worth noting that the micro-optimizations
imple-mented by our tool and the ones in Proguard are not the same, thus, each tool provides a
di↵erent set of optimizations. Also, note that the micro-optimizations performed by our
tool are done in the source code, meanwhileProguard optimizations work directly at the
bytecode level.
The results on eight open source apps (AnCal, AndroidBicycle, Hangeulider, Heatl-hFoodConcepts, SaveApp, RaspberrybusMalasya, Subsonic-Android, HeartsSky) with a large number of optimization opportunities, demonstrate that the analyzed micro-optimizations do not significantly improve CPU or memory consumption (except for the UnusedResources case), even in those apps that contain a high number of warnings. How-ever, we found evidence that developers can significantly reduce the memory consumption of the running app, by removing unused resources, which can be automatically detected
and performed by the AndroidLINT tool.
2.4.4 RQ4: What practices are used by developers for detecting
opti-mization opportunities in Android apps?
Although the current practices and tools based on dynamic analysis do not support au-tomatic detection of optimization opportunities, these techniques were preferred by the survey participants over static analysis tools for ad-hoc fixing of performance related is-sues or early detection of micro-optimization opportunities. In general, 371 informative answers from the survey revealed the existence of a diverse set of practices and tools for detecting optimization opportunities. However, the responses show a bias in preference towards dynamic-based practices and tools provided by Google. Only 82 participants in-cluded in their answers static analysis-based practices, and only 15 participants indicated
use of static analysis tools (e.g., PMD, FindBugs, LINT) in order to detect
optimiza-tion opportunities. Manual testing and profiling turned out to be the most preferred practices. Only two participants rely on automated unit testing tools. In the case of
profiling, the most used suites and tools belong to the Android ecosystem, such as Eclipse MAT[17], DDMS [114], Android Device Monitor [104], traceview [109], systrace [111], and dmtracedump [109]. Only 20 answers included third-party tools such as Valgrind [51], LittleEye [33], AT&T ARO [8], Intel Parallel Studio [29], Adreno profiler [34], among the others. A detailed taxonomy of practices is provided in the online appendix [26].
2.4.5 RQ5: What micro-optimizations are recognized (and used) by
de-velopers as useful for improving the performance of apps?
The practice of detecting and implementing micro-optimizations is not prevalent among Android developers who responded to our survey. Most of the participants are unaware of this practice, claiming that their apps do not require micro-optimizations, or that they do not trust in “premature optimization”. However, some developers reported successful usage of some optimizations, which suggests that, in general, the impact of micro-optimizations might depend on the application domain (e.g., games) and the operations workload involved in the micro-optimizations (e.g., large volume of String operations)
2.5
Energy Greedy APIs [165]
Programming errors, hardware interactions, and API misuses can cause high levels of
energy consumption (also known as energy bugs) in mobile apps [204]. To identify such
problems, e↵ective strategies for measuring energy consumption in mobile devices are
needed. In the literature, several di↵erent strategies have been proposed, based on real
measurements [77, 96, 127, 144, 152, 225] and power modeling [122, 123, 205, 206, 241, 246]. While previous work attempted at characterizing energy bugs in mobile devices [77, 82, 122, 205, 225], most of these classifications have been done either by mining software repositories (e.g., bug reports, forums, commit logs) [204, 229, 244] or by using dynamic tainting [172, 245]. Thus, there is a clear gap in the research literature on how and where the uses and misuses of APIs can lead to energy bugs based on large-scale
empirical data. Up-to-date, only the wakelock and GPS related APIs and their misuses have been studied and linked to energy bugs [206, 207, 229, 244].
Based on these considerations, we conducted a quantitative and, above all, qualitative
exploration into how di↵erent API usage patterns can influence energy consumption in
mobile apps [165]. We mined and analyzed thousands of instances of energy-greedy method calls and API usage patterns by measuring their energy consumption in 55 free Android
apps belonging to di↵erent domain categori
![Table 3.1: Overview of the Essential and Accidental Challenges Discussed (Relevant section numbers are indicated next to each challenge or solution, as well as corresponding links to detailed solutions in our online appendix [20] are given as citations](https://thumb-us.123doks.com/thumbv2/123dok_us/789313.2599796/61.918.161.808.276.689/overview-essential-accidental-challenges-discussed-relevant-indicated-corresponding.webp)