CONCEPTS ON MICROARRAY DESIGN FOR GENOME
AND TRANSCRIPTOME ANALYSES
HELDER I. NAKAYA, EDUARDO M. REIS, SERGIO VERJOVSKI-ALMEIDA
Departamento de Bioquimica, Instituto de Quimica, Universidade de São Paulo, 05508900 São Paulo, SP, Brazil.
Phone:+55-1130912173; Fax:+551130912186; E-mail:[email protected]
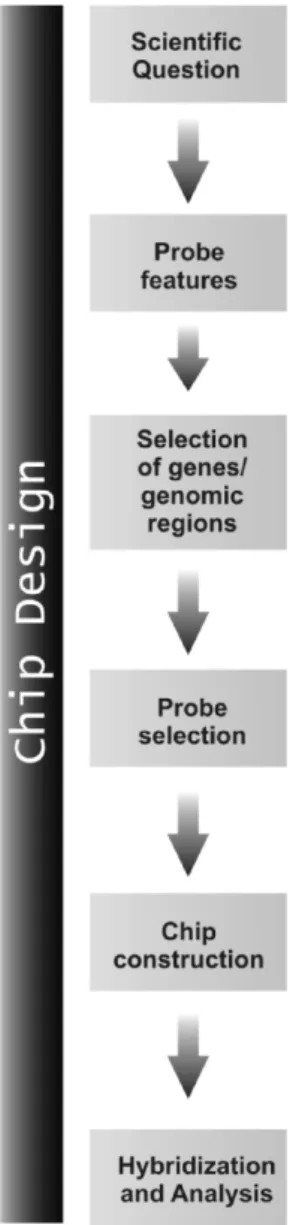
Abstract: Microarray technology has revolutionized molecular biology by permitting many hybridization experiments to be performed in parallel. With the size of a glass microscope slide, this tool can carry thousands of DNA fragments in an area smaller than a postage stamp. In this chapter, we will describe microarray chips that host nucleic acid probes, which are the most commonly used type of microarrays. Science in this field is mostly data-driven, where biological hypothesis are generated upon analysis and comparison of a huge amount of potentially meaningful differ-ential data derived from microarray hybridizations. DNA microarray technology is under a constant and rapid evolution. The first paper reporting DNA microarray as a tool for transcript-level analyses has been published in 1995, and that chip had about 1000 Arabidopsis genes. Almost 11 years have passed and advances in minia-turization, robotic, and informatics, as well as the development of alternative approaches to microarray construction have permitted to put more than 250,000 different spots into a single square centimeter. This rapid advance in the microarray field, combined with the falling price of technology and the acquisition of whole-genome sequence information for hundreds of organisms has caused biologists to abandon their home-made equipment in favor of one of an expanding range of commercial platforms now available on the market. However, we are still not able to represent the entire genome of any eukaryotic organism in a unique chip or even to analyze the great complexity of the human transcriptome. Therefore, how to choose and design the best probes to construct DNA microarray chips is a crucial step to the appropriate use of this powerful technique (Figure 1).
Keywords: Microarray chip, DNA microarray, spotted DNA microarray, cDNA microarray, antisense transcription, genomic microarray, comparative genomic hybridization, CGH, oligoarray, in situ synthesis, Affymetrix, NimbleGen, Agilent, microarray probe, gene-oriented array, oligonucleotide probe, epigenomic microarray, tilling array, CpG island, expression profiling, gene atlas, alternative splicing, transcript variants, pre-mRNA, transcriptome annotation, whole-genome oligonucleotide array,
A. Buzdin and S. Lukyanov (eds.), Nucleic Acids Hybridization, 265–307. © 2007 Springer.
microRNAs (miRNAs), methylation, bisulfite oligonucleotide array, methylated DNA immunoprecipitation, chromatin immunoprecipitation (ChIP), single nucleotide polymorphisms (SNPs), intronic transcription, noncoding transcripts, link-age disequilibrium.
Abbreviations: ASO, allele-specific oligonucleotide hybridization; ASPE, allele-specific primer exten-sion; BAC, bacterial artificial chromosome; BLAST, basic local sequence alignment tool; CAGE, cap analysis of gene expression; CGH, comparative genomic hybridization; ChIP, chromatin immunoprecipitation; Cy3, cyanine-3; Cy5, cyanine-5; DMD, Digital Micromirror Device; dNTP, deoxyribonucleotidetriphosphate; EST, expressed sequence tag; MAS, Maskless Array Synthesizer; MeDIP, methylated DNA immunoprecipitation; MiRNA, microRNA; MM, mismatch; MPSS, massively parallel signature sequencing; Oligo, oligonucleotide; PAP, poly(A)-polymerase; PCR, polymerase chain reaction; PM, perfect match; RACE, rapid amplification of cDNA ends; SAGE, serial analysis of gene expression; SBE, single-base extension; SNP, single nucleotide polymorphism; UV, ultra-violet; WGA, whole-genome amplification.
TABLE OF CONTENTS
1. Building a Microarray Chip . . . 266
1.1 Spotted DNA Microarrays . . . 268
1.2 In situ Synthesis . . . 271
2. Selecting the Probes . . . 277
2.1 Gene-Oriented Arrays . . . 278
2.2 Epigenomic Microarrays . . . 279
2.3 Tiling Arrays . . . 279
3. Specific Question, Specific Chip . . . 280
3.1 Transcriptional Profiling . . . 280
3.2 Comparative Genome Hybridization . . . 282
3.3 Alternative Splicing . . . 284
3.4 Transcriptome Annotation . . . 285
3.5 Small MicroRNA Profiling . . . 289
3.6 Methylation Pattern . . . 289 3.7 ChIP-Chip . . . 293 3.8 Genotyping . . . 295 3.9 Intronic Transcription . . . 297 4. Conclusions . . . 299 References . . . 300
1. BUILDING A MICROARRAY CHIP
Various types of microarrays with different probe materials can be produced, including DNA/RNA and oligonucleotides [1], soluble proteins [2], membrane proteins [3], peptides [4], carbohydrates [5], small molecules [6], tissue [7], and live cells [8], with each technology possessing distinctive characteristics while
providing unique opportunities to increase our understanding of how a living being operates. In this review we will concentrate on the construction and use of DNA microarrays.
The principle behind microarray chips composed of nucleic acid probes is simple: DNA or oligonucleotide probes representing genes or genomic regions of an organism capture, by preferential binding of complementary single-stranded nucleic-acid sequences, the labeled RNA, DNA, or cDNA molecules
(targets) applied to the chip. The intensity of the label signal from the captured targets reflects the abundance of that target within the hybridized sample.
Single-stranded DNA probes, in the form of DNA (e.g. cDNA and bacterial artificial chromosome – BACs) or oligonucleotides are placed on a substrate made by glass or silicon. Based on the principle of whether or not there is direct contact between the sample probe and the support substrate, a robot arrayer uses contact (using printing pins) or noncontact (using piezoelectrical deposition) printing methods. An alternative method of printing is the semiconductor-based technology, which consists in synthesizing oligonucleotides in situ, building up nucleotide by nucleotide each element of the array and using ink-jet printing or photolithographic methods, similar to those used in the semiconductor industry. This technology offers the advantage of higher density and consistency [9, 10]. Therefore, the key trends have been a shift from cDNA- to oligonucleotide-based microarrays and from “in-house or home-brew” to higher quality commercial platforms [11].
Oligonucleotide microarrays have several advantages in comparison to DNA microarrays. Today, microarray companies such as Agilent Technologies and NimbleGen offer custom oligo arrays with up to hundreds of thousands fea-tures, resulting in platforms with a very flexible custom design. Oligonucleotides contained in these chips have great sensitivity as discussed below. Also, overlap-ping sense and antisense transcription (RNAs transcribed from both strands of DNA in the same genomic locus), which is being recognized as a common event in the eukaryotic cells, can be discriminated by these oligonucleotide arrays.
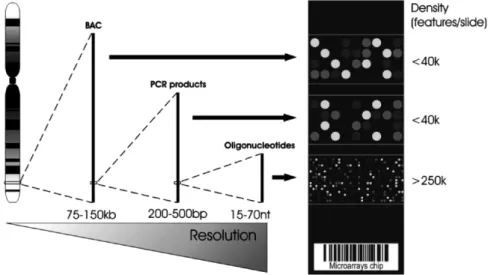
The type of microarray chip depends on the scientific question behind it. Chips comprised either by short (200–500 bp) PCR products of cDNA sequences or by oligonucleotides (17–70 bp) have high resolution but a limited genomic coverage (Figure 2). This kind of chip is largely used for measurement of mRNA transcript levels from annotated genes. Large genomic deletions or duplications are better detected by low-resolution microarray chips carrying fragments of several kilobases (kb) in length, such as BACs and cosmids (Figure 2). Although oligonucleotides can be either spotted or in situ synthe-sized onto a microarray chip, large DNA molecules can only be spotted.
1.1 Spotted DNA Microarrays
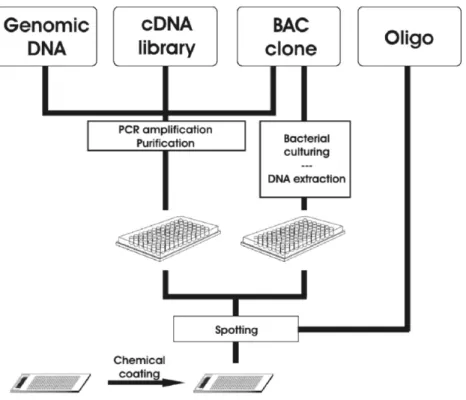
Selected DNA fragments spotted onto microarray chips can be derived from genomic regions, cDNA libraries, BAC clones, or synthetic oligonucleotides (Figure 3). In order to obtain the required concentration of a specific DNA for spotting, amplification and purification steps must be performed. For oligonu-cleotide microarrays, this is obtained by an appropriate dilution of the purchased oligo set. Printing of DNA fragments is then performed by a robot arrayer using printing pins or piezoelectrical deposition. In general, the latter printing method generates small, homogenous spots, whereas the results of contact printing depend largely on the quality of the printing pins. Successful printing also
requires controlled environmental conditions, such as optimized air humidity, temperature, and the absence of dust and dirt particles. The DNA within the created spots is fixed onto the array surface by covalent bonds randomly formed by cross-linking the DNA backbone of spotted probes to the chemically coated surface, using heat or ultraviolet radiation (UV) [12].
The advantages of being highly customizable and having a low manufacturing cost per array is balanced by the fact that substrate properties or pen-tip diam-eter of this type of microarray chip limit the density to less than 1000 features per cm2. Another limitation of cDNA microarrays is the possibilities of cross hybridization between mRNAs and other nonspecific elements of the cDNA clone, and the painstaking effort of maintaining accurate and viable cDNA libraries. Also, several reports show a widespread occurrence of antisense transcription in the human genome [13, 14] and double-stranded cDNA microarrays are unable to discriminate between sense and antisense overlapping messages. These problems are largely circumvented by the use of oligonucleotide arrays.
1.1.1 cDNA microarray
This common variety of microarray chip uses cDNA molecules immobilized to a glass slide to assay parallel expression of RNAs transcribed from particular genes. A cDNA is a nucleic acid molecule reversely transcribed from mRNA. To immobilize these molecules, a PCR amplification of cDNA libraries and purifi-cation of PCR products is needed. Double-strand DNA-amplified fragments
Figure 2. Array density and length of different DNA probes. Bacterial artificial chromosome (BAC)
clones can represent large spans of genomic DNA at the expense of low-tiling resolution. Spots comprised by PCR products provide better resolution than BACs using relatively few array features in comparison to spots comprised by oligonucleotides, which have the highest resolution.
are deposited onto coated glass slides by pen tips of a spotter robot. Following spotting, cDNAs are fixed to the slide surface by UV cross-linking. The glass surfaces of cDNA microarrays can be chemically modified in various ways to immobilize DNA and some studies show that the spotting cDNA concentration, surface chemistries, and blocking strategies affect the performance and quality of cDNA microarray data [15, 16].
1.1.2 Genomic microarray
Spots on a DNA microarray can represent large spans of genomic DNA (gDNA) for comparative genomic hybridization (CGH) analysis. This chip uses BAC clones, and facilitates global experimentation using relatively few array features, at the expense of low-tiling resolution [17]. Cloned gDNA for probes is isolated from bacterial cultures by standard DNA extraction protocols [18]. To avoid large-scale bacterial culturing, DNA fragments may be obtained by PCR amplification of BAC DNA using degenerate oligonucleotide primers [19] or
Figure 3. Types of spotted DNA microarrays. PCR reactions are performed in order to amplify the
DNA for spotting. For PCR reactions the templates are either genomic DNA, cDNA from a library, or BAC clones. Alternatively, BAC clones can be directly spotted following amplification with bacterial culturing and DNA extraction and purification. An appropriate dilution of the purchased oligonucleotide set is required to obtain the DNA amount necessary for spotting.
linkers [20]. While oligonucleotide and small PCR fragments facilitate a more detailed investigation at selected genomic regions, the large insert BAC clone arrays (typically ~150 kb in size) efficiently capture signals from samples of low DNA quantity and quality for genome-wide analysis, since BAC arrays require 200–400 ng of DNA, whereas oligonucleotide and cDNA platforms typically require microgram amounts [21].
1.1.3 Oligoarray
Microarray chips carrying spotted longmer oligonucleotides have recently become more widely used. Single-stranded probes with 50–70 bases representing exons of genes combine the advantages of flexible and controlled probe design with the higher probe specificity as compared to double-stranded cDNA. Presynthesis of oligos or cDNAs has the important advantage that the sequences eventually placed on the array can be exactly those desired; on the other hand presynthesis significantly increases the fixed cost attached to a multiprobe array and thus in practice limits the number of features spotted per array to a few thousands. Pen-tip spotting methods [1, 22] will continue to be a relatively low-tech but robust and affordable method for small laboratories to generate their own arrays, with a moderate number of features. Ink-jet methods also can be used to print presynthesized oligos [23]. With the recent and signif-icant improvements in spotting technology and acquisition of the genomic sequence from many organisms, whole-genome longmer oligonucleotide sets for printing are now available for many species.
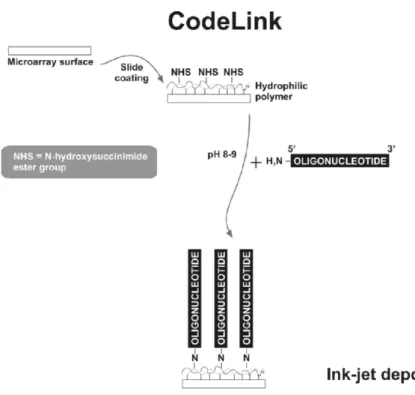
For example, a chip containing thousands of oligonucleotides has been com-mercialized by the GE Healthcare division of General Electric. This platform named “CodeLink Bioarray Platform” (Figure 4) is constructed by piezoelectrical deposition of presynthesized and functionally validated 30 mer oligonucleotide probes onto a proprietary 3D aqueous gel matrix [24]. The CodeLink platform offers several bioarrays for both expression and single nucleotide polymorphism (SNP) studies in humans, mice, and rats [25].
1.2 In situ Synthesis
Another approach to manufacture DNA arrays employs the in situ synthesis of oligonucleotides. Production of these microarrays requires more sophisticated and costly equipment, and these arrays are generally produced commercially [26]. The larger vendor corporations, such as Affymetrix, NimbleGen Systems, and Agilent Technologies (Figure 5) provide suites of components, reagents, and services. The main features of each platform are presented below.
Comprehensive comparative studies of data generated from the most widely used commercial platforms have been carried out by different laboratories [27–29]. In each study, gene expression measurements from the platforms being compared were generated from a common source of biologically different RNAs. Correlations in expression levels and comparisons for significant expression
Figure 4. CodeLink bioarray platform. A unique and well characterized 30 mer oligonucleotide for
each gene is deposited on a proprietary 3D gel matrix. Attachment is accomplished through covalent
interaction between the amine-modified group present on the 5′-end of the oligonucleotide and the
activated functional group present in the gel matrix. The 3D gel matrix provides an aqueous environment, allowing for maximal interaction between probe and target.
Synthesis in situ Spotting
Agilent Technoligies Affymetrix
AFFYMETRIX
NimbleGene
CodeLink
Whole Human Genome
NimbleGen Systems GE Healthcare (CodeLink)
Agilent
Figure 5. The four major vendors of microarray chips. For the three commercial microarrays on the
left the oligonucleotides are synthesized in situ, whereas for the array on the right they are pre-synthesized and spotted.
changes in genes present on all platforms, revealed considerable divergence across platforms [27, 29]. Unsupervised clustering and principle component analysis suggested that the largest variation in measurements from the commer-cial platforms was attributable to the platforms themselves. Although gene sets did overlap to some extent across these platforms, the majority of genes that were identified as differentially expressed were exclusively identified with each technology [27]. Other sources of divergence across platforms can be attributed to the detection of distinct types or sets of alternatively spliced transcript vari-ants, represented in each array [28] and by the labeling/hybridization protocols of each technology – one-color based microarrays (Affymetrix and CodeLink) compared to the two-color arrays from Agilent [29]. However, later analyses under more controlled conditions have demonstrated that good reproducibility can be achieved across laboratories and platforms [30–32]. The conclusion of these latter studies is that the main factors that influence variation are the bio-logical samples and human factors, rather than technical diversity. Specific attention can be given to these negative factors in order to minimize inconsis-tencies; nevertheless a small degree of variability is probably unavoidable with such a sensitive and complex technology.
1.2.1 Affymetrix
By applying photolithographic technologies derived from the semiconductor industry to the fabrication of high-density microarrays, Affymetrix of Santa Clara, California, pioneered this field and has dominated for many years. High-density Affymetrix oligonucleotide arrays, also called GeneChips have become the pharmaceutical industry standard owing to its extensive genetic content, high levels of reproducibility, and minimal start up time [11]. A major advan-tage of GeneChips is that they are designed in silico, thereby eliminating management of DNA clone libraries or oligonucleotide sets, and the possibility of misidentified tubes, clones, or features [33]. The disadvantage of this plat-form is that it demands a dedicated scanner and utilizes short 25 mer oligonu-cleotides, which are less sensitive than the longer 60 mers utilized in other technologies. Additionally, to increase sensitivity multiple oligonucleotides are required for transcript detection.
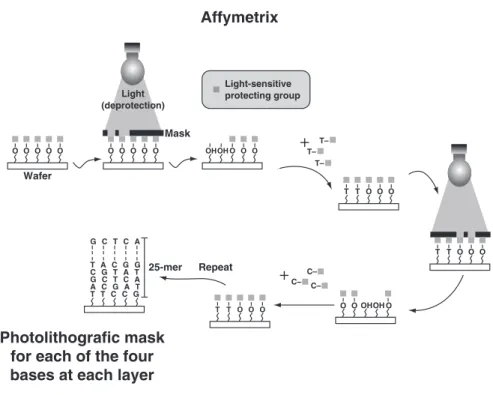
Affymetrix focused on light-directed synthesis for the construction of high-density DNA probe arrays using two techniques: photolithography and solid-phase DNA synthesis (Figure 6). The glass substrate, or chip, is first covalently modified with a silane reagent to provide hydroxyalkyl groups, which serve as the initial synthesis sites. Synthetic linkers modified with photosensitive pro-tecting groups are attached to a glass surface. Using a photolithographic mask, light is then directed to specific areas on the surface to remove the protection groups from the exposed linkers. The first of a series of chemical building blocks, hydroxyl-protected deoxynucleosides, is incubated with the surface, and chemical coupling occurs at those sites that have been illuminated in the pre-ceding step. Another mask is used to deprotect and direct light to, other sites.
New deoxynucleosides are added and the process is repeated until the desired length of oligonucleotide is synthesized. The amount of nucleic acid informa-tion encoded on the array in the form of different probes is limited only by the physical size of the array and the achievable lithographic resolution. A 1.28 × 1.28 cm array can include over a million different oligonucleotide sequences.
For gene expression purposes, the oligonucleotides are generally 25 bases long and each transcript is represented by 11–20 such probes. Probe sequences are ideally spread throughout the gene sequence, and are generally more concen-trated at the 3′-end. In addition, each perfect match (PM) probe is paired with a mismatch (MM) probe, an identical probe except for a single base difference in a central position. The MM probes act as specificity controls and enable subtraction of background and cross-hybridization. The use of multiple inde-pendent probes for each gene greatly improves signal-to-noise ratios, improves the accuracy of RNA quantization (averaging and outlier rejection), increases the dynamic range and reduces the rates of false positive and miscalls [9].
O O O O O O O O O O OHOH OH OH O O O T– T– T– C– C– C–
+
+
T T O O O T T O O O O O O T T O O O G C T C A T A C G G C G T A T G C T C A A C G A T T T C C G Wafer Mask 25-mer Repeat Photolithografic mask for each of the four bases at each layerAffymetrix
Light (deprotection)
Light-sensitive protecting group
Figure 6. Construction of an Affymetrix chip by light-directed oligonucleotide synthesis. Light
is directed through a mask to deprotect and activate selected sites, and new protected nucleotides (in this example, thymidine derivatives) couple to the activated sites. The process is repeated, activating different sets of sites and coupling different bases (in this example, cytosine derivatives) allowing arbitrary DNA probes to be constructed at each site.
1.2.2 NimbleGen systems
NimbleGen manufactures custom, high-density DNA arrays based on its propri-etary Maskless Array Synthesizer (MAS) technology. The MAS system is a solid-state, high-density DNA array fabrication instrument comprised of a maskless light projector, a reaction chamber, a personal computer, and a DNA synthesizer. NimbleGen builds its arrays using photo-mediated synthesis chemistry with its MAS system.
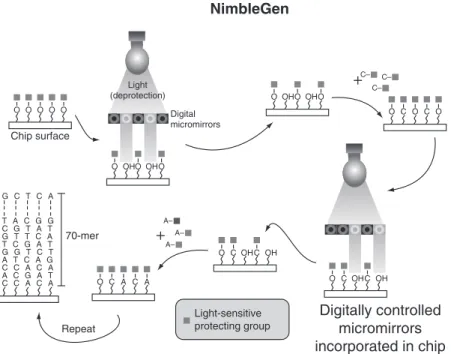
A digital micromirror device (DMD) employs a solid-state array of miniature aluminum mirrors to pattern up to 786,000 individual pixels of light (Figure 7). The DMD creates “virtual masks” that replace the physical chromium masks used in traditional arrays. These “virtual masks” reflect the desired pattern of UV light with individually addressable aluminum mirrors controlled by the com-puter. The DMD controls the pattern of UV light projected on the microscope slide in the reaction chamber, which is coupled to the DNA synthesizer. The UV light selectively cleaves a UV-labile protecting group at the precise location where the next nucleotide will be coupled. The patterns are coordinated with the DNA synthesis chemistry in a parallel, combinatorial manner such that up to 786,000 unique probe features are synthesized in a single array [34].
O O O O O O OHO OHO Chip surface 70-mer Repeat NimbleGen Light (deprotection) Digital micromirrors Digitally controlled micromirrors incorporated in chip Light-sensitive protecting group O C A C A O C OHC OH O C OHC OH O C O C O O OHO OHO C– A– A– A– C– C– + + G C T C A T A C G G C G T A T G T T C A T C G A T G G T C T A T C A G C C A C A A C G A T C C A C A
Figure 7. Construction of microarrays using NimbleGen System’s MAS technology. Digital
micromirrors reflect a pattern of UV light, which deprotects the nascent oligonucleotide and allows addition of the next base.
The light-directed synthesis methods, both photolithographic [35] and digital micromirror-based [34], have the potential to achieve feature sizes not much larger than a wavelength of light. This should enable substantial further reduc-tions in cost and in hybridization volume with consequent reduction in the amount of biological sample required.
1.2.3 Agilent technologies
Agilent Technologies uses proprietary SurePrint ink-jet technology and offers a flexible microarray platform. Oligonucleotides (60 mer long) are synthesized in situ and are built up a base at a time on standard glass slides, resulting in arrays with more than 230,000 unique features. The iterative oligonucleotide synthesis loop begins when the first nucleotide of each oligo is printed onto the activated glass surface of the microarrays. In phosphoramidite synthesis reactions, the reactive sites on the nucleotides are blocked with chemical groups that can be removed selectively. This allows the bases to be added to the oligo chain one base at a time in a very controlled manner. After the first base is printed, the trityl group that protects the 5′-hydroxyl group on the nucleotide is removed and oxidized to activate it, enabling it to react with the 3′-group on the next nucleotide. In between each step, the excess reagents are washed away so that they will not randomly react later in the synthesis. The process of printing a nucleotide followed by detritylation, oxidation, and washing is repeated 60 times (Figure 8). After the last base in the oligo chain is printed, the microarrays undergo a final deprotection step, before moving on to quality control testing [36]. Ink-jet synthesis yields are ~98% per stage with chemical deprotection, as opposed to ~95% for photodeprotection, allowing the ink-jet technology to be optimized with longer oligos and higher stringency hybridization conditions. In situ ink-jet synthesis should have a valuable niche for rapid turnaround of custom arrays in small lots, unless it is overtaken by the micromirror technologies.
This 60 mer oligonucleotide platform contrasts with the short 25 mers probes employed by Affymetrix. Although short oligonucleotides should in theory provide the greatest discrimination between related sequences, they often have poor hybridization properties. The 60 mers provide enhancements in sensitivity over 25 mers in part due to the larger area available for hybridization. In light-directed synthesis, failure of photodeprotection at any stage terminates the oligo. The yields per stage in the Affymetrix synthesis process are such that attempts to make 60 mers would result in very few of them running to even half that length; Affymetrix settled on 25 mers partly for this reason. Another advan-tage of Agilent chips is that only one 60 mer per gene or transcript is required [36]. The reason why Affymetrix uses multiple probe pairs to estimate the abun-dance of each target transcript is partly by the need to make up for the per-formance limitations of 25 mers.
2. SELECTING THE PROBES
For a given organism under study, DNA microarray probes can be designed as soon as a sequence of genomic region or transcript from that species becomes available. With several whole-genomes already sequenced and millions of expressed sequence tags (ESTs) deposited into public databases, microarrays are able to increase our understanding of basic biological processes if the investigator selects a set of probes that are suitable to answer specific question, as discussed in the following sections.
The probe sequences used in gene-oriented arrays are selected on the basis of gene and EST data from public databases according to a number of criteria; most importantly, they should be unique for the gene (avoiding, e.g. character-istic sequences of gene families). To minimize the probability of unspecific tar-get cross-hybridization, sequence comparison in silico tests can be performed between each probe and all known transcripts from that species using basic local sequence alignment tool (BLAST). Probes with a unique exact-match target are ideal; for 50–70 mer oligonucleotide probes, mismatched target sequences with no more than 35% identity with no gaps are usually desirable, to decrease the probability of cross-hybridization. In addition, probes should be relatively uniform
O O O O O O HO O O O O P MeO 5' 3' 3' O O O HO 5' 5' O P MeO N(iPr)2 O O O P MeO Oxidation Deprotection O O P MeO O DMT O DMT O O O O P MeO 3' O O O P MeO Base n+1 Ink-jet printer head deposition of nucleotides layer by layer Agilent Base n+2 Base n+2 Base n+1 Base n Base n Microarray surface Repeat Base n+2 Base n+1 Base n Microarray surface Microarray surface Me = methyl DMT = dimethoxytrityl iPr = isopropyl +
Figure 8. Ink-jet synthesis of probes in the Agilent microarray chips. This figure shows the general
in their hybridization properties, which are determined by a similar overall gyanine–cytosine (GC) content, melting temperature (Tm), and tendency to form secondary structure.
Microarrays aim to provide accurate measurements of true expression values of the phenomenon under study. This is achieved by a high specificity (reduced false–positive rate) and a high sensitivity (reduced false–negative rate) of microarray probes. cDNA probes or longer oligonucleotide probes provide greater sensitivity at the expense of reduced specificity.
In general, the specificity of oligonucleotide probes is evaluated by experi-ments using target RNAs that share various degrees of sequence similarity [36, 37]. For a given hybridization stringency condition and protocol, these experiments determine the maximal degree of sequence similarity for which no cross-hybridization is detected, thus revealing the probe parameters for good specificity. These parameters can be applied for the design of novel probes that should work well with the predefined hybridization protocol.
Probe sensitivity is generally defined as the lowest target concentration at which an acceptable accuracy is obtained [36, 38]. For a given organism, addi-tional control probes containing DNA sequences with no homology to any known transcript or to the genome sequence are often used to estimate the cut-off detection limit parameters. Moreover, tiling arrays can use signal intensity information of consecutive probes in a predefined transcriptional unit in order to determine a detection cutoff that can be applied to identify novel transcripts in nonannotated genomic regions [13, 14].
2.1 Gene-Oriented Arrays
Microarrays designed for measuring gene expression levels are generally biased toward known and predicted protein-coding genes. These genes can be deter-mined using several approaches, such as large-scale sequencing of ESTs, com-parative genomic annotation, or full-length cDNA cloning experiments. Once the gene sequence is obtained, cDNA or oligonucleotide probes can be designed and placed onto a microarray chip. Then, expression levels of genes can be assessed by relative hybridization between these probes and labeled targets derived from different cell conditions or types. Although independent experi-ments are required to validate selected probes in terms of specificity and sensi-tivity (discussed above), signal intensity comparison of a given probe under different controlled conditions can be used to estimate cutoff detection limit parameters that increase the specificity of measurements.
Compared to tiling arrays, the gene-oriented platform is a relatively easy-to-handle tool since it uses relatively few probes for each gene. A single chip is capable of measuring the expression levels of all known messages of specific types of transcripts, being these messages protein-coding genes [39] or, for exam-ple, intronic noncoding RNAs [40] and micro-RNAs [41]. Pre-mRNA splicing at every exon–exon junction [42] or SNPs [43] of thousands of genes can also be
monitored using this platform. Therefore, this tool has the advantage that a rapid evaluation of the differences between two or more transcriptomes can be made by hybridizing the different cDNA preparations to identical chips and comparing the hybridization patterns.
2.2 Epigenomic Microarrays
Only a minor fraction of eukaryotic genomes is occupied by genes; however, histone and nonhistone chromosomal proteins and methylated DNA bases are distributed over both genic and intergenic regions. Once mapped, the microar-ray platform can be used to obtain the profiling patterns of these widespread epigenomic features, such as DNA methylation [44], DNA replication [45], DNA binding, and chromatin-associated proteins and histone modifications [46]. Alternatively to the already-mapped sites, microarray-based strategies are able to identify novel DNA binding sites or novel DNA methylation regions by probing upstream and downstream regions of genes [47], or by probing pre-dicted CpG islands of a genome [44]. Certainly, epigenomic microarrays will become a standard research tool for understanding chromatin structure and gene expression during development [46].
Similar to gene-oriented arrays, epigenomic microarrays are easy-to-handle tools in comparison to tiling arrays and permit that many different experiments be performed at a low cost and lower labor analysis. However, for identification of the complete set of epigenomic features of an organism, a tiling-array plat-form is the best tool since it covers long contiguous genomic regions.
2.3 Tiling Arrays
With the completion of sequencing of many genomes, attention has shifted to determining the complete set of transcribed sequences and regulatory elements. This recent trend in genomics has involved the development of tiling arrays: microarrays that represent a complete non-repetitive tile path over a locus, chro-mosome or whole-genome, irrespective of any genes that may be annotated in that region [17]. Potential uses for such unbiased representation of gDNA include empirical annotation of the transcriptome [48], chromatin-immunopre-cipitation-chip studies [49], characterization of the methylation state of CpG islands [50], analysis of alternative splicing [48, 51], and CGH [52].
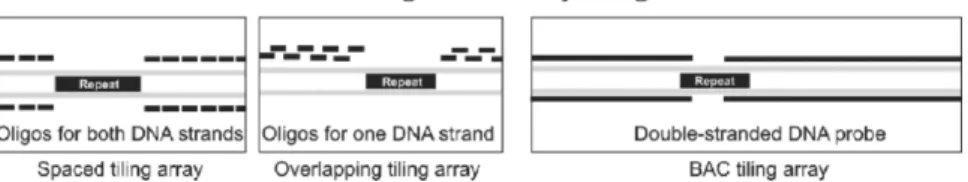
Numerous options exist for tiling genomic sequences with oligonucleotides or PCR products, leading to microarray designs of different sequence resolutions and feature densities (Figure 9). Oligonucleotide arrays comprise 25–70 bp probes, which are synthesized directly on the slides or prepared in solution and then deposited. The second type of tiling array is constructed using PCR prod-ucts typically of ~1 kb in length, or BAC arrays – typically at 1 Mb resolution (see Section 1). One caveat of PCR-based tiling arrays is that their construction is labor intensive and therefore they are not readily scalable to the study of large
genomes at a high resolution. As an example, tiling of the entire human genome using this platform would require approximately 2 million PCR reactions at 1 kb resolution and necessitate extensive informatics infrastructure to support the effort [53].
3. SPECIFIC QUESTION, SPECIFIC CHIP
The many applications of microarrays chip are being used to answer important questions in biology and medicine. Beside transcriptome analysis, microarrays chip is currently useful to determine the methylation status of CpG islands, to identify DNA binding sites of transcription factors and to discover novel genes or alternative isoforms of genes. Also, different types of DNA probes can detect from large chromosome deletions of millions of nucleotides that are associated to cancer as well as single nucleotide substitutions that may affect important proteins of different metabolic pathways. Thus, it is clear that the appropriate application is no longer determined by technical improvements but by the efficient chip design, derived from the specific aim of the assay. Here in this chapter, we focus on specific chip designs applied to answer specific biological questions.
3.1 Transcriptional Profiling
The power of microarray technology lies in its ability to simultaneously meas-ure the expression of thousands of genes, thus providing a snapshot of the tran-scriptome in different states of tissues and cells. The most common application of microarray chips is still the expression profiling of mRNAs. Comparison of mRNA expressions in a high-throughput way raises a number of hypothesis and points to important biological functions of genes inside cells under different sit-uations, such as disease states, tissues from a given organism, drug treatments, and gene disruptions. Large-scale EST sequencing [54], serial analysis of gene expression (SAGE) [55], and massively parallel signature sequencing (MPSS) [56] technologies also provide a transcriptional profiling of tissues and cell
Figure 9. Comparison of different whole-genome array designs. Probes can be overlapping or
spaced at regular intervals; comprised by oligonucleotides, PCR products or BAC clones; single- or double-stranded; and designed to interrogate one or both DNA strands of genomic regions without annotation bias. This figure shows three different combinations of whole-genome array design.
types. However, these techniques are relatively more expensive and less flexible than microarray technology.
In 1995, microarray technology was used for the first time to assess the tran-scriptional profiling of ~1000 Arabidopsis genes [1]. This number represents only 4% of the 26,330 annotated genes from Arabidopsis. Since then, microarray technology has evolved fast and cDNA/oligo microarray platforms containing all genes from this organism are now available (Figure 10). In 11 years of research, more than 60 papers were published by different labs across the world, reporting changes on transcriptional levels of Arabidopsis genes using microar-ray chips (Figure 10). Such simultaneous measurements of Arabidopsis gene expression helped scientists to gain comprehensive insights into the response of Arabidopsis to several environmental conditions.
Microarray probes can only be designed based on previous information of sequences of known or predicted genes. The exon structure of a gene defines where probes can be designed. In general, probes are designed close to the 3′-end of the transcript. The reason is that most of labeling protocols use the poly-A tail of target mRNAs for priming the labeling reaction.
Microarray chips are valuable tools for functional genomic studies and could accelerate the annotation of novel genes. Thanks to the large number of EST
1995 Oct
Number of transcriptional
profiling papers
1995 1996 1997 1998 1999 2000 2001 2002 2003 2004 2005 2006
Arabidopsis genes on the microarrays
0 0 2 4 6 8 10 12 14 16 18 Transcriptional profiling papers 5000 10000 15000 Year Release of Arabidopsis genome Oligo microarrays cDNA microarrays Publication date 20000 25000 30000
1996 Aug 1997 Jan 1998 Apr 1999 Feb 1999 Dec 2000 Oct 2001 Aug 2002 Jun 2003 Apr 2004 Feb 2004 Dec 2005 Oct
Figure 10. Use of microarray technology to assess transcriptional profiling. The line graph shows
the increasing number of Arabidopsis genes represented in oligo and cDNA microarrays that were used in the Arabidopsis transcriptional profiling papers, which were published between 1995 and 2006. The number of such published papers is shown on the bar graph.
sequencing projects and the complete sequencing of many genomes, bioinfor-matics analysis can predict thousands of genes. Tissue-specific pattern of mRNA expression of known and predicted genes can confirm their expression and give important clues about gene function [39]. The gene atlas of the mouse and human protein-encoding transcriptomes, described by Su et al. [39], identi-fies hundreds of regions of correlated transcription and show that some genes are subject to both tissue and parental allele-specific expression, suggesting a link between spatial expression and imprinting. Also, hypotheses about the biological roles of genes with unknown function can be raised by comparison of their expression levels with possible coregulated known genes [57]. In addition, the identification of groups of genes with similar expression profiles can uncover gene families or metabolic pathways that are affected in a specific condition [58].
The use of arrays as tools for gene expression profiling on a genomic scale has some limitations. One is that this technology is only able to measure relative levels of mRNA expression, and not absolute amounts. Another current limitation is that it is not reliable to compare the levels of different mRNAs from the same sample, due to differences on labeling and hybridization of each probe and target. Recently, these limitations started to be addressed by different approaches that allow quantitative estimation of absolute endogenous transcript abundances in cells, that are based on a common oligonucleotide reference [59] or on a set of exogenous RNA controls [60]. Moreover, most hybridization arrays are not designed to differentiate between alternatively spliced transcripts of the same gene and, in some cases, between highly homologous members of a gene family. Finally, a change in messenger RNA does not necessarily correlate with a change in protein expression [61], and the translated protein often requires further modifications to attain its full activity. These latter two points are a common and legitimate criticism of array technology because it measures an intermediate step (mRNA levels) and not a functional product (active protein). However, until sensitive and reproducible proteomic technologies become universally accessible to the research community, hybridization arrays will continue to be the best opportunity for studying gene expression on a genomic scale [62].
3.2 Comparative Genome Hybridization
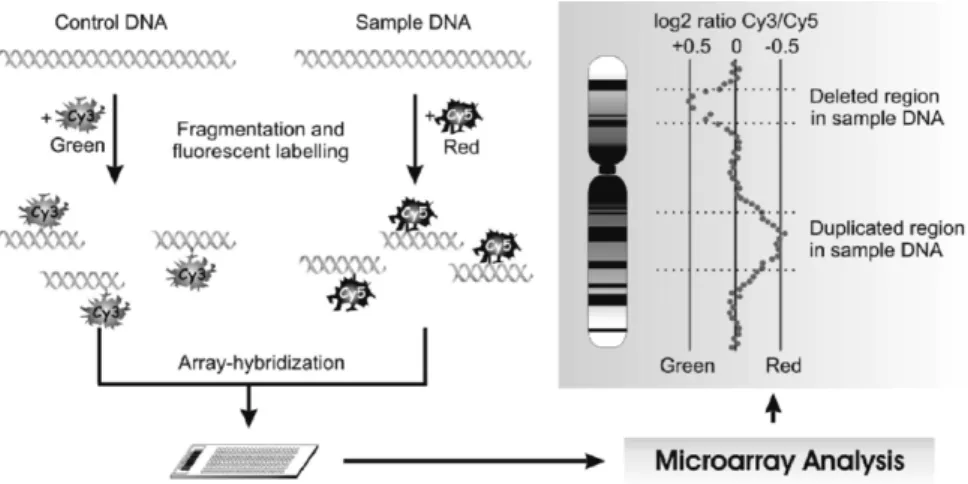
The CGH array technique allows the detection of chromosomal copy number changes on a genome-wide and with a high-resolution scale. It is used in human genetics and oncology, with great promise for clinical application. In typical CGH experiments, test and control DNA samples (e.g. tumor and normal cells) are isolated and used to create fluorescently labeled probes, typically cyanine-3 (Cy3) and cyanine-5 (Cy5). The probes are pooled and competitively cohy-bridized to a glass slide spotted with a known array of mapped genomic clones, cDNAs, or oligonucleotides. Log ratios of the Cy5–Cy3 intensities are measured for each clone. Next, a log ratio profile is assembled to determine relative copy
number changes between the test and control samples, which may comprise loss or gain/amplification of specific genomic regions (Figure 11).
Different CGH platforms differ in the spatial resolution (e.g. the number of genomic bases) for the detection of copy number changes. This can vary from megabase to kilobase resolution. The main factors affecting the resolution of CGH arrays are the number and size of elements on the arrays, the chromoso-mal distribution of printed elements, as well as the amplitude of a chromosochromoso-mal copy number change. Until recently, PCR-amplified BACs have been the main source of DNA for the assembly of CGH arrays covering large genomic regions, entire chromosomes, and eventually the whole human genome [52, 63, 64]. The large insert size of BAC clones (~150 kbp) provide multiple sites for target binding, giving a good sensitivity for detection of small changes in copy number. Genome-wide CGH arrays based on cDNA clones have also been developed. While cDNA CGH arrays provide a direct link to RNA expression measure-ments, they preclude the analysis of chromosomal gain or loss in nontranscribed regions. Furthermore, the smaller probe size requires larger amounts of gDNA for target generation and often result in a lower signal-to-noise ratio as compared to large-insert CGH arrays [64]. The large-scale operation required for DNA isolation or PCR amplification of large-insert clones necessary for manufacturing the arrays are elaborate, time consuming, and has to deal with the possibility of clone contamination along the process of array fabrication
Figure 11. Principles of array comparative genomic hybridization (CGH). Sample and control
DNA are fragmented and labeled with fluorescent dyes, combined, and cohybridized to a microar-ray containing spots of genomic material (tiling armicroar-ray). The sample and reference competitively bind to the spots and the resulting fluorescence intensity ratios are reflected by their relative quantities, as shown by the computer generated CGH fluorescence ratio profile (right). The center line in the
CGH profile represents the balanced state of the chromosomal copy number (log2ratio = 0). Gains
[65]. CGH arrays comprised of synthetic oligonucleotides are emerging as an alternative technology to eliminate the need for clone management and lessen probe identity errors. Assembly of high-density arrays composed of small (25-60 nt) oligonucleotide probes are likely to provide a better resolution than BAC and cDNA arrays [65]. Oligonucleotide CGH arrays are readily available through academic institutions (Sanger Center, UCSF, DKFZ) as well as through commercial suppliers (Agilent, Affymetrix, NimbleGen). In practice, current resolution of oligonucleotide CGH arrays is limited by the lower signal-to-noise ratio from individual probes, which requires that measured intensities from several adjacent probes are combined to calculate a moving average of signal intensities. Also, methods for reduction of genome complexity are often applied to limit nonspecific target binding to short oligonucleotide probes such as those present in Affymetrix platforms [66]. Future developments in gDNA target amplification and labeling will be required to expand the use of whole-genome tiling oligoarrays for CGH analysis [66].
3.3 Alternative Splicing
Almost all protein-coding genes of humans have a split structure with several exons and introns. Intronic sequences are removed from the primary transcript by the process of pre-mRNA splicing, an essential step in eukaryotic gene expression. Alternative splicing is the differential processing of exon junctions to produce a new transcript variant from one gene, and is a major determinant of the protein functional diversity underlying human physiology, development, and behavior [67]. Much of the available genomic information on alternative splicing is derived by the alignment and conservation analysis of large numbers of ESTs and messenger RNAs to genome sequences of different organisms [68, 69]. In general, exons are called “constitutive” when are presented in every example of a transcript from a given locus and called “alternative” if they are sometimes skipped. Efforts are now being directed at studying relevant tran-script variants generated by alternative splicing at a global level.
Microarrays offer a high-resolution means for monitoring pre-mRNA splic-ing on a genomic scale. The use of this technology has permitted the discovery of new alternative splicing events not previously detected in cDNA or EST sequences [42] and large-scale detection of cell- and tissue-specific alternative splicing events involving exons that were initially identified using EST/cDNA sequence data [70, 71]. Moreover, alternative splicing microarrays have facili-tated the global analysis of alternative exons regulated by specific splicing factors [72, 73] and have led to the discovery of sequence motifs that correlate with tissue-specific alternative splicing [74].
The splice array is based on the design of probes located on constitutive exons, alternative exons, as well as on the constitutive and alternative splice junctions. Frey et al. [75] designed a platform containing probes for all 1.14 million putative exons of the mouse genome and Johnson et al. [42] for every
exon–exon junction in more than 10,000 multiexon human genes. In addition, other groups [70, 76–78] used splicing-sensitive microarray containing both exon and splice junction oligonucleotide probes to assay splicing of a large number of human genes. This platform permits the detection of all different types of splice events: exon skipping, novel exon, internal exon deletion, intron retention, or alternative usage of splice donor or acceptor sites. Another microarray format employing a fiber-optic-based system for the detection of specific splice variants has been described, and this approach has been used to monitor splice variants in different transformed cell lines and tumors [79–81].
Probes should be designed with homogeneous Tmand similar lengths to obtain a common thermodynamic profile and junction probes being preferably centered on the splice site. This positional constraint for junction probes may complicate probe design, making probe composition not suitable to get the desired thermodynamic parameters. However, junction probes can be designed with a sequence up to two nucleotides off-centre, which maintained the expected specificity [82]. Cross-hybridization tests of probe sequences can be performed by BLAST analyses against the human EST databases using parameters for short, nearly exact matches. Although longer exon probes are better for detecting exons, longer splice junction probes present a unique problem. Since about half of a splice junction probe will be derived from one exon and about half from another, each junction probe has perfect complementarity over about half of its length to other RNA forms that contain a different exon [83]. Fehlbaum et al. [82] evaluated the speci-ficity of probes of splice arrays using three different probe lengths (24, 30, and 40 mer) and labeled targets from only two variants of a gene (long and short isoforms). Junction probes were designed to detect specifically each type of iso-form. Their results showed that the junction probes with 30 and 40 bases long detect both isoforms. Due to potential hybridization of half of the junction probes to a single exon, only the 24 mer seems to have the specificity required for isoform-specific detection of alternatively spliced events [82].
Alternative splicing analysis can use signals derived from the hybridization of labeled targets to the constitutive exon oligonucleotides relative to exon–exon junction probes [77]. In theory, constitutive exon probes measure the total amount of RNA from the particular gene, whereas hybridization signals from an exon–exon junction oligonucleotide would reflect the amount of RNA containing that particular junction (Figure 12). Therefore, the ratio of hybridization intensity from a probe spanning a specific exon–exon junction to that from a constitutive exon probe would provide exon-skipping or -inclusion indexes, reflecting the level of that alternatively spliced RNA in the two comparison samples (Figure 13) [77].
3.4 Transcriptome Annotation
Even with a finished genome sequence, computational gene prediction or tradi-tional molecular methodologies are not able to identify all of the transcription units. These approaches – sequencing randomly selected cDNA clones, aligning
Figure 12. Principles of alternative splicing detected by splicing-sensitive microarray. Probes
spanning all exons and all exon–exon and exon–intron junctions are designed and placed onto microarrays (upper panel). The standard splicing (sample 1) and two types of alternative splicing (samples 2 and 3) of a pre-mRNA are represented as three different samples (middle panel). Sample 1 is labeled with Cy3 (green) and sample 2 and 3 with Cy5 (red). Targets are mixed in two different combinations (sample 1 with sample 2, and sample 1 with sample 3) and each combination is hybridized to a microarray. The lower panel shows a schematic view of scanned images of these two microarray slides. Alternative splicing is detected by different hybridization signals of exon and junction probes.
protein sequences identified in other organisms, sequencing more genomes, and manual curation – successfully identified expressed transcripts for tens of thou-sands of genes, but they eventually reach a point of greatly diminished returns. These methods fail in detecting transcripts that are low abundance or expressed in rare cell types or in response to specific stimuli. Tiling microarrays can be used to circumvent some of these problems, allowing confirmation of the predicted gene models as well as being a tool for new exon and gene discovery (Figure 14) [84].
Microarray technology has permitted a refined high-throughput mapping of the transcriptional activity in the human genome. A pioneering study from Kapranov and colleagues [48] revealed a tenfold excess of transcriptionally active regions along chromosome 21 and 22 than originally predicted by map-ping of known genes. Later, this study was extended to ten human chromosomes where sites of transcription of polyadenylated and nonpolyadenylated RNAs were mapped at 5 bp resolution in eight cell lines [14]. Interestingly, the major proportion of the transcriptional output of the human genome was comprised by unannotated, nonpolyadenylated transcripts [14]. In another study, Bertone et al. [13] constructed a set of 134 high-density oligonucleotide microarrays to
Figure 13. Detection of alternative splicing by microarray. Panel A: Design of oligonucleotide
probes. The microarray probes contain oligonucleotides that target all possible exon-exon junction sequences (J1–2, J1–3, and J2–3). Probes E1 and E3 are complementary to flanking constitutive exons and probe E2 is complementary to alternative exon2. Panel B: Data collection and analysis. RNA samples 1 and 2 are isolated and labeled separately with Cy5 or Cy3 fluorescent dye, mixed, and hybridized to oligonucleotides in microarray. Red (Cy5) and green (Cy3) fluorescence are meas-ured and the ratio of the two values is calculated for each oligonucleotide. To assess differences in splicing pattern between the two samples, skipping indexes and inclusion indexes are calculated. The
skipping index of alternative exon2 is log2of Cy5/Cy3 from the exon1–exon3 junction
oligonu-cleotide (probe J1–3 in Panel A) divided by the mean of Cy5/Cy3 from the constitutive exons 1 and
3 (probes E1 and E3 in Panel A). The inclusion index of exon2 is log2of the mean of Cy5/Cy3 from
exon1–exon2 and exon2–exon3 (probes J1–2 and J2–3 in Panel A) divided by the mean of Cy5/Cy3 from exon1 and exon3 (probes E1 and E3 in Panel A).
represent ~1.5 Gb of nonrepetitive gDNA from each strand of the human genome. This approach identified thousands of new transcribed regions and confirmed the transcription of predicted genes on a global scale. Also, conser-vation between many of the novel transcribed sequences and well-characterized mouse proteins provides strong evidence that a large number of them are likely to encode functional transcripts [13].
Whole-genome oligonucleotide arrays have also been useful for studying another poorly understood aspect of the transcriptome, natural antisense tran-scription, because they can simultaneously monitor gene expression on both strands of a genome (Figure 14). Natural antisense RNAs are endogenous coding or noncoding transcripts that exhibit complementary sequences to transcripts of already known function, named sense transcripts [85]. These antisense messages might be involved in several biological processes, such as alternative splicing, alter-ation of methylalter-ation pattern, and competitive transcriptional interference (for RNA polymerase II) within the same locus [86]. In the oligonucleotide tiling array study of the human genome, a significant proportion of exonic sequence, represented by known exons, mRNAs, and ESTs, was found to exhibit antisense
Oligos for both DNA strands
Sense DNA strand Evidence of
a possible novel transcript or first exon
Probe position
Antisense DNA strand Evidence of a possible novel edxon
Probe position Probe intensity
Probe intensity
Figure 14. Mapping of the transcriptional activity in the genome using a tiling array. Tiling
microar-rays are designed to assay transcription at intervals of the genome using regularly spaced probes that can be overlapping or separated. For each DNA strand, transcription within a genomic region is represented by regions of greater fluorescent intensity. Annotated genes aligned with these microar-ray fluorescence intensities can reveal unannotated exons or novel transcripts.
transcription [13]. This result demonstrates the utility of tiling arrays for helping to unravel the high-complexity of eukaryotic transcriptomes.
3.5 Small MicroRNA Profiling
MicroRNAs (miRNAs) represent a class of small noncoding RNAs encoded in the genomes of plants and animals that are thought to regulate gene expression of target mRNAs. Mature miRNAs are about 22 nucleotides long and typically excised from 60- to 80-nucleotide foldback RNA precursor structures [87]. In ani-mals, most miRNAs function through the inhibition of effective mRNA transla-tion of target genes through imperfect base pairing with the 3′-untranslated region (3′UTR) of target mRNAs [88]. Some miRNA functions include control of cell proliferation, cell death, and fat metabolism in flies, neuronal patterning in nematodes, modulation of hematopoietic lineage differentiation in mammals, and control of leaf and flower development in plants [88]. Also, altered expres-sion of a few miRNAs has been found in some tumor types [89–92].
Several DNA chips have been designed to expression profile miRNAs or their hairpin precursors across several human and mouse tissues [41, 93–97], during mouse brain development [98] or in human B cell chronic lymphocytic leukemia [99]. Oligonucleotide probes with sequences complementary to miRNAs can be spotted [41, 93, 96–99] or in situ synthesized [94, 95] onto a microarray platform and used to capture labeled miRNAs (Figure 15). In general, miRNAs should be first isolated from total RNA by excision from poly-acrylamide gel or by size-fractioning using commercial column-purification kits. Then, methods involving PCR-based amplification or ligation strategies can be used to label mature and active miRNAs [94–99]. A direct tiling/labeling procedure and hybridization approach was also developed by others [41]. Essentially, polynucleotide tails 20–50 nt long are appended to the 3′-ends of all miRNAs by the poly(A)-polymerase (PAP) enzyme (Figure 15). The 3′-tail is a mixture of standard and amine-modified nucleotides, and tailed miRNAs can subsequently be labeled with any monoreactive NHS–ester dyes, such as Cy3 and Cy5 [41].
The application of DNA microarray technology to parallel expression meas-uring of the entire endogenous set of miRNAs may offer higher sensitivity, high throughput, and higher comparative capabilities over the other methods used to detect miRNAs, e.g. Northern blot analysis, cloning, and membrane arrays using radioactive detection methods [95]. However, the detection of miRNAs with microarrays still meet significant difficulties, mostly due to the short size of miRNAs and the sequence similarity between miRNA family members.
3.6 Methylation Pattern
DNA methylation in CpG dinucleotides is an epigenetic mark crucial in regulation of gene expression. DNA methylation is required to complete embryonic develop-ment, and has been directly implicated in genomic imprinting and X chromosome inactivation in mammals. Cytosine methylation is also important for silencing of repetitive elements such as transposons and retroviruses, and for epigenetic
regulation of endogenous genes, although the extent to which this DNA modifi-cation functions to regulate the genome is largely unknown. Aberrant DNA methylation may cause silencing of tumor suppressor genes and promote chromo-somal instability in human cancers. Thus, accurate determination of cytosine methylation status in CpG dinucleotides placed in promoter regions of cancer-related genes may provide diagnostic and prognostic value for human neoplasias.
Initial studies relied on array platforms generated by PCR amplification and interrogating a limited number (~3000) of promoter CpG islands in the form of PCR amplified DNA fragments [100, 101]. These arrays were hybridized to labeled probes generated from tumor and normal cells, previously enriched in methylated CpGs by means of digestion with methylation-sensitive restriction enzymes followed by PCR amplification (Figure 16) [101, 102]. Similar strategies
Total RNA Recover of small RNAs using column miRNA (21-22 nt) miRNA (21-22 nt) 5' 5' 5' 5' 5' 5' 3' 3' 3' or Label with Poly(A) Polymerase incorporating amine-modified UTP and UTP
UUUUUUUUUU3' Couple Cy dye to aminoallyl UTP UUUUUUUUUU3' Fluorescently labeled miRNA
Specific probe Mismatch probe Microarray hybridization
UUUUUU UUUU
UUUUUUUUUU
Lable of microRNAs
(T)n CCTCGGTG 3' Anneal with DNA oligo
(A)n GGAGCCAC
T7 promoter (T)nCCTCGGTG 3' Fill in with Klenow DNA Polymerase
Transcribe with RNA Plolymerase incorporating Cy-CTP
(A)n GGAGCCAC 5'
Fluorescently labled antisense miRNA
T7 promoter
(A)n GGAGCCAC (T)n CCTCGGTG
Ligation of 3' adaptor with T4 RNA ligase
Excision of small RNAs from gel Isolation of microRNAs 21 nt or 100 nt
Figure 15. Detection of microRNAs using microarrays. Size fractions of total RNA containing
microRNAs can be isolated by excision from poly-acrylamide gel or by size-fractioning using com-mercial column-purification kits (left upper panel ). Right upper panel shows two types of labeling. On the left, Poly(A) polymerase and a mixture of unmodified and amine-modified nucleotides are
used to append a poly-nucleotide tail to the 3′-end of each miRNA. The amine-modified miRNAs
are then cleaned up and coupled to NHS-ester modified Cy5 or Cy3 dyes. On the right, mature
microRNAs are coupled to 3′-adapter containing a T7 RNA polymerase promoter. Labeled
microRNAs are produced by in vitro transcription using T7 RNA Polymerase and fluorescent dyes. The lower panel shows the hybridization of labeled microRNAs to oligonucleotide probes. The specificity of these probes is guaranteed by no hybridization of microRNAs to mismatch probes.
Figure 16. Restriction enzyme-based strategies for DNA methylation profiling.
Methylation-sensitive restriction endonucleases and frequent cutter enzymes are used in the procedures. Adapter-specific aminoallyl-PCR’s selectively enrich unmethylated (left) or hypermethylated (right) DNA fractions. DNA fragments are fluorescently labeled and hybridized to microarray which contains DNA spots representing CpG island sequences.
were developed for use of higher coverage platform such as whole-genome BAC spotted arrays [103, 104], and more recently, for the unbiased fine-mapping of methylation patterns of chromosomes 21 and 22 using tiling microarrays consisting of over 340,000 oligonucleotide probe pairs [105].
A different strategy for methylation analysis is based on the use of bisulfite oligonucleotide arrays (Figure 17). Sodium bisulfite treatment of DNA deami-nates cytosine to uracil, but 5′-methylcytosine is protected. Unmethylated DNA that is treated with bisulfite contains uracil in place of cytosine and will hybridize relatively poorly to microarray oligonucleotides that contain guanines. Methylated cytosines in DNA sequences that cannot be changed by bisulfite
Figure 17. Bisulfite detection of methylation patterns. For each CpG island sequence, the
microar-ray contains two oligonucleotide probes; one to detect the unmodified sequence and another to detect the bisulfite-altered sequence.
treatment will retain their ability to hybridize to the oligonucleotide arrays. Built on this principle, microarrays were designed comprising oligonucleotides corre-sponding to methylated and unmethylated versions of the sequence of the CpG islands of a given gene, thus allowing detection of the methylation status of multiple genes simultaneously (Figure 17). The methylated version of a probe set should differ by at least 3 nt (of 21 bp) from the unmethylated one, which will eliminate any possible cross-hybridization between methylated and unmethylated DNA of a given gene [106]. As a result, a much stronger hybridization signal should be detected for a methylated probe set if there is methylation and vice versa. Oligonucleotide arrays interrogating CpG islands (19-25 mer) may be synthesized in situ [107] or result from spotting of presyn-thesized oligonucleotides [106, 108–111]. Although informative and precise, the use of bisulfite oligoarrays may be limited in genome-wide studies due to (1) loss of probe specificity resulting from the degeneration of the code caused by the conversion of unmethylated cytosines, and (2) the difficulty to design suitable oligonucleotide probes that would exhibit similar Tmand hybridization behav-ior [105]. In a variation of this method, bisulfite-converted DNA from different samples can be deposited in a solid support and used to interrogate labeled synthetic probes for methylated or unmethylated versions of specific CpGs [112].
An additional approach for analysis of DNA methylation patterns involves methylated DNA immunoprecipitation (MeDIP) with an anti-methylcytosine antibody, followed by hybridization of the purified genomic fragments to whole-genome microarrays. This methodology was employed to generate methylation profiles from normal and tumor cells of all human chromosomes at 80 kb reso-lution and for a large set of CpG islands using a tiled whole human genome BAC array [113]. Because genome tiling arrays can be synthesized to contain relatively short (25 mer) oligonucleotides, they can potentially identify sites of DNA methylation with unparalleled precision, in some cases with single-nucleotide resolution. Recently, the MeDIP approach was used to generate the first comprehensive DNA methylation map of an entire genome (the plant Arabidopsis thaliana), at 35 bp resolution [114], and is also being used to inves-tigate in the detail the methylation pattern of a region comprising 1% of the human genome using Affymetrix oligonucleotide tiling arrays [115]. As tiling arrays are universal platforms they are ideal for detecting correlations between DNA methylation and transcriptome mapping on a genome-wide scale.
3.7 ChIP-Chip
Chromatin immunoprecipitation (ChIP) coupled to hybridization onto DNA microarrays (ChIP-chip) is becoming a popular approach to investigate interac-tions between proteins and DNA that occur in vivo. In ChIP-chip experiments, cross-linked chromatin–protein complexes are extracted from a cell or tissue of interest and the DNA sheared, typically by sonication, down to relatively short (<1 kb) fragments (Figure 18). DNA fragments cross-linked to the protein of
Figure 18. Schematic view of ChIP-chip procedure. Formaldehyde is used to form DNA–protein
cross-links. After lyses, the extract is sonicated to shear the DNA fragments to the desired size, usu-ally 1 kb or smaller. DNA fragments cross-linked to the protein of interest are enriched by chro-matin immunoprecipitation (ChIP) using an antibody specific to that protein. Formaldehyde cross-links are then reversed and the DNA is purified. Enriched DNA is labeled with a fluorescent molecule such as Cy5 or Cy3. Genomic DNA prepared from IP input extract is generally used as a reference and similarly amplified and labeled with a different fluorescent molecule. The two probes are then combined and hybridized to the DNA microarray which contains elements that represent the entire genome.
interest are enriched by immunoprecipitation with a protein-specific antibody, the formaldehyde cross-links are reversed and DNA is purified. Amplification of immunoprecipitated DNA is usually required for microarray-based detection. Amplified immunoprecipitated DNA is labeled with a fluorescent molecule and hybridized to DNA microarrays, along with a reference (usually an aliquot of gDNA used as input for immunoprecipitation reactions) labeled with a different fluorophore (Figure 18) [49].
Different array platforms have been used in ChIP-chip experiments: spotted double-strand cDNA/DNA arrays, spotted oligonucleotide arrays, and in situ synthesized oligonucleotide arrays. Initial studies in yeast using arrays com-prised of PCR fragments spanning the whole yeast genome identified binding sites for individual transcription factors and of protein complexes related to DNA replication, recombination, and chromatin structure [49]. ChIP-chip stud-ies in mammalian genomes have utilized different types of PCR amplicon arrays, including arrays tiling a specific genomic region of interest, mainly CpG island arrays and promoter arrays [116]. Recently, an array comprising PCR fragment probes for 1% of the nonrepetitive complement of the human genome sequence (ENCODE array) was used to identify functional promoters in an unbiased fashion [117]. Arrays comprising of tiling DNA fragments (either PCR fragments or oligonucleotides) were devised as a way to increase the resolution of ChIP-chip experiments. The advent of commercially available whole-genome high-density oligonucleotide tiling arrays (Affymetrix, Agilent, NimbleGen) represented an additional gain in resolution and also eliminated the problems associated to PCR manipulations and mechanical spotting by relying instead on in situ oligonucleotide synthesis. The high-coverage of the whole-genome tiling arrays has paved the way for the unbiased mapping of DNA-interacting protein factors. As an example, a study using Affymetrix arrays representing essentially all nonrepetitive sequences on human chromosomes 21 and 22 found that most binding sites for the transcriptional factors Sp1, cMyc, and p53 were located far from the transcription start sites of known protein-coding genes [118]. It should be noted that the optimal length of arrayed fragments is a balance between the cost of having many elements and the desire for increased resolution, keeping in mind that arrayed elements shorter than the average size of a sheared chromatin fragment (generally 500–1000 bp) will not increase resolution [49]. A comprehensive comparison of using PCR spotted arrays and long- and short-oligonucleotide arrays for ChIP-chip experiments is not available and therefore, the best array platform for ChIP-chip experiments is not yet established.
3.8 Genotyping
SNPs are the most abundant form of genetic variation in the human genome, with estimates of more than 10 million common SNPs [119, 120]. These single nucleotide changes in human genes may cause genetic disorders and could provide
important help for explaining, e.g. disease susceptibility and cancer predisposition [121]. Therefore, it is clear that the accurate and robust detection of such SNPs plays a central role in the field of DNA diagnostics [122]. Microarray-based genotyping assays have been used in genome-wide linkage analysis of SNP markers associated to several diseases, such as prostate cancer [123], rheumatoid arthritis [124], and systemic lupus erythematosus [125].
Among the numerous methods for analyzing genomic variations, microarrays are one of the most powerful tools for high-throughput SNP genotyping. Genotyping platforms, released by Affymetrix, can interrogate up to 100,000 SNPs in parallel. An alternative technology, BeadArrays, developed by Illumina (San Diego, California) and not discussed in detail here, is particularly powerful for genotyping up to 500,000 SNPs in parallel. Essentially, the method involves (a) whole-genome amplification (WGA) to generate large amounts of amplified complex gDNA. (b) Hybridization of the WGA product to a specific and sensi-tive oligonucleotide probe array (50 mers). (c) An array-based allele-specific primer extension (ASPE) reaction that scores the captured SNP targets by incorporating multiple biotin-labeled dNTP nucleotides into the appropriate allelic probe, followed by a sensitive detection and signal amplification step to read the incorporated labels [120].
Microarray-based systems use different molecular strategies for distinction between SNP alleles. The robustness of these multiplexed systems is deter-mined by the reaction principles applied for SNP allele distinction and the microarray formats used. The major reaction principles – allele-specific oligonucleotide (ASO) hybridization, ASPE, and single-base extension (SBE) [126] – can be applied using different combinations of PCR strategies, array types, SNP selection, and labeling protocols and will not be discussed in this chapter [119]. However, a brief example of each reaction principle is pre-sented. GeneChip assays (Affymetrix) use the difference in thermal stability between a perfectly matched and mismatched ASO probe and its DNA target to distinguish between the SNP alleles [127]. Systems that use ASPE (Figure 19) or SBE [128] reaction principles are enzyme-assisted and provide a highly specific SNP genotyping. This is due to the high accuracy of nucleotide incorporation by DNA polymerase or the high specificity of DNA ligase in joining two adjacent and perfectly matched DNA strands. In SBE–TAG sys-tems [128, 129], a hybrid oligonucleotide primer containing a generic sequence tag followed by a locus-specific sequence is hybridized adjacent to the SNP and extended with fluorescent dideoxynucleotides. Multiple SBE reactions are performed in solution with each SBE primer marked by a dif-ferent unique sequence tag. The multiplex reaction is analyzed after hybridization to a generic tag array, which is generated by spotting the reverse complements of the sequence tags onto a glass microscope slide. Genotyping method using ASPE systems [120, 130] is briefly described in the legend to Figure 19.