India’s Financial Globalisation
Ajay Shah Ila Patnaik
Working Paper 2011-79
January 2011
India’s financial globalisation
Ajay Shah
Ila Patnaik
∗January 9, 2011
Abstract
India embarked on reintegration with the world econ-omy in the early 1990s. At first, a certain limited open-ing took place emphasisopen-ing equity flows by certain kinds of foreign investors. This opening has had myriad in-teresting implications in terms of both microeconomics and macroeconomics. A dynamic process of change in the economy and in economic policy then came about, with a co-evolution between the system of capital con-trols, macroeconomic policy, and the internationalisa-tion of firms including the emergence of Indian multi-nationals. Through this process, de facto openness has risen sharply. De facto openness has implied a loss of monetary policy autonomy when exchange rate pegging was attempted. The exchange rate regime has evolved towards greater flexibility.
JEL codes: F15, F23, F32, F36, G15.
Keywords: India, financial globalisation, capital con-trols, capital flows.
∗Both authors are with the National Institute of Public Finance and
Policy, New Delhi. This note was prepared as an entry titled ‘India’ in the forthcoming Encyclopedia of Financial Globalization, ed. Gerard Caprio, Elsevier. We are grateful to Stijn Claessens, Masahiko Takeda and Manmo-han Singh for numerous useful suggestions and insights. Email addresses: [email protected] and [email protected]
Contents
1 From autarky to reintegration 3
2 Empirical facts about reintegration 4
2.1 Composition of capital flows . . . 6 2.2 Internationalisation of firms . . . 8
3 Foreign portfolio investment in the equity market 11
3.1 Concerns about herding behaviour . . . 13
4 The role of FDI 15
4.1 Inbound FDI . . . 15
5 Foreign borrowing 18
6 Effectiveness of capital controls and the exchange
rate regime 19
7 Domestic finance and international finance 24 8 Policy questions about capital controls and
1
From autarky to reintegration
India’s integration into the world economy blossomed in the First Globalisation. The trade/GDP ratio rose from 1 to 2 per cent in 1800 to 20 per cent in 1914. In 1940, when India was un-der colonial rule, restrictions on international trade and capital mobility were imposed throughout the Sterling Area as wartime measures. India gained independence in 1947, but emphasised autarkic policies, with a marked closing of the economy in the 1960s and 1970s. By 1970, the trade/GDP ratio had dropped to 8 per cent.
By 1991, with experience and international comparisons for 44 years in hand, the intellectual and policy consensus shifted against autarky. India then embarked on reintegration into the world economy through trade and capital account liberalisation. By the mid 1990s, the trade/GDP ratio had got back to the 20 per cent value seen in 1914. Reintegration into the world economy took place on both the current account and on the capital ac-count. The early initiatives in capital account decontrol were based on three ideas:
• It was believed that debt inflows and all outflows were dangerous; hence strong restrictions against debt inflows and all outflows were kept in place.
• It was believed that inflows into the equity market were beneficial, but only if they originated from certain kinds of investors. Thus investment vehicles such as pension funds and university endowment funds were considered good, while hedge funds and individuals were considered bad. Hence, a limited opening was undertaken, where certain kinds of ‘foreign institutional investors’ (FIIs) were able to register in India with the securities regulator, and then given substantial flexibility including the lack of quantita-tive restrictions.
• While the official rhetoric was in favour of FDI, the re-moval of capital controls against FDI was limited in many sectors. Deeper liberalisation of capital controls against FDI took place later.
This opening of the economy was a key element of India’s growth acceleration of the early 1990s. The combination of these re-forms of the capital account, and trade liberalisation, unleashed a complex dynamic of change in the economy and in economic policy.
In this setting, the analysis of India’s reintegration into the world economy is usefully organised around the following key questions. What were the microeconomic and macroeconomic consequences of this partial opening? How did capital account and current account opening interact with each other? What dy-namic of change was unleashed in the political economy through the map of interests of gainers and losers associated with this mechanism of opening the economy? How did de facto open-ness evolve in the following two decades? While the bulk of these questions remain unanswered research puzzles, there is clarity on some sub-components of this larger picture, which is sketched in the following sections.
2
Empirical facts about reintegration
Direct reductions in customs duties which were spread over the period from 1991 till 2003 led to a rapid and sharp rise in trade. Trade also grew in response to reductions in transactions costs of transportation, and to the emergence of tradeable services based on computer and telecommunications technologies. Combining these, gross flows on the current account, expressed as per cent of GDP, grew dramatically from 8 per cent in 1990, to 31 per cent in 2000 and 71 per cent in 2008.
measure, which measures whether there were any segment where restrictions were completely removed, showed no change at -1.13 through the entire period. Within each restricted segment and market many steps in liberalisation did take place. This reflects the fact that the Chinn-Ito methodology, which is based on the IMF areaer data, tends to portray India as closed,
given the bureaucratic procedures which encumber all aspects of the Indian capital account. The Chinn-Ito result – of an unchanged score of -1.13 through the period – is correct in a cross-sectional sense, in that India’s capital account restrictions are more onerous than those used in most emerging markets. At the same time, in a time-series sense, India is significantly more open on a de jure basis in 2010 when compared with 1990, which is not shown by the Chinn-Ito measure.
The de facto capital account integration measured by the Lane and Milesi-Ferretti database showed little change from 1990 to 2000, with a gross investment position (excluding official re-serves) growing from 30 per cent of GDP in 1990 to only 42 per cent of GDP in 2000. However, significant change was visi-ble after that, with a value of 85 per cent in 2007. This marked acceleration of capital account integration after roughly 2000 recurs repeatedly in the discussion ahead.
The Lane and Milesi-Ferretti data understates capital account integration to the extent that economic agents engage in ille-gal capital account transactions, which appears to be a signifi-cant issue in India. There is some evidence of Indian residents holding significant assets outside the country, and evidence of a significant scale of misinvoicing on the trade account. While the literature has focused on evasion of customs duties as the rationale for misinvoicing, the Indian evidence shows no signifi-cant change in misinvoicing across a sharp reduction in customs duties. This suggests a role for misinvoicing in the evasion of capital controls.
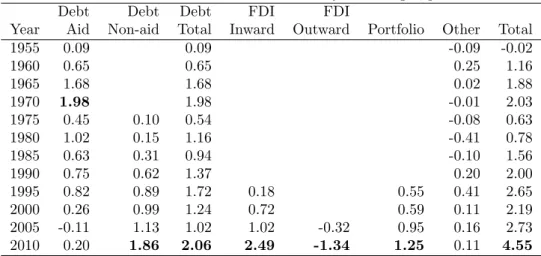
Five-year averages, percent to GDP Debt Debt Debt FDI FDI
Year Aid Non-aid Total Inward Outward Portfolio Other Total
1955 0.09 0.09 -0.09 -0.02 1960 0.65 0.65 0.25 1.16 1965 1.68 1.68 0.02 1.88 1970 1.98 1.98 -0.01 2.03 1975 0.45 0.10 0.54 -0.08 0.63 1980 1.02 0.15 1.16 -0.41 0.78 1985 0.63 0.31 0.94 -0.10 1.56 1990 0.75 0.62 1.37 0.20 2.00 1995 0.82 0.89 1.72 0.18 0.55 0.41 2.65 2000 0.26 0.99 1.24 0.72 0.59 0.11 2.19 2005 -0.11 1.13 1.02 1.02 -0.32 0.95 0.16 2.73 2010 0.20 1.86 2.06 2.49 -1.34 1.25 0.11 4.55
Table 1: Composition of capital flows
2.1
Composition of capital flows
Table 1 shows the composition of capital flows. Each value shown in the table is expressed as per cent to GDP, and rep-resents the average over the latest five years. As an example, the value for 1955 is the average of the five years leading up to 1954-55. In each column, the largest value is shown in boldface. In the early years, international financial integration was dom-inated by official assistance. Aid amounted to 1.68 per cent of GDP in 1961-1965, and 1.98 per cent of GDP in 1966-1970. These accounted for the bulk of the net capital flows in these years. Aid declined steadily therafter, and shows negligible val-ues after 1995, reflecting the onset of international financial in-tegration through the private sector.
Capital account decontrol took place in three phases. The first phase involved borrowing by the private sector, which was first visible in the five years ended 1975. This borrowing has risen steadily through this period, attaining a value of 1.86 per cent of GDP for 2006-2010. Since this rise went alongside a decline
of aid, the rise in overall borrowing has appeared subdued: the total debt inflow of 2.06 per cent of GDP for 2006-2010 is similar to the value of 1.98 per cent of GDP for 1966-1970.
In the early 1990s India faced a balance of payment crisis. This crisis was followed by an IMF structural adjustment program, economic reforms and liberalisation of the trade and capital accounts. Policy makers were, however, very cautious about opening up the economy to debt flows. The experience of the BOP crises as well as the lessons learnt from other developing countries suggested that debt flows, especially short term debt flows could lead to BOP difficulties if the country faced macroe-conomic imbalances and had an inflexible exchange rate. The emphasis was, therefore, on foreign investment - both FDI and portfolio investment. Even these were opened up slowly and a complex administrative system of capital controls remained in place. Within foreign investment, the attempt was to continue within the infant industry argument support for domestic indus-try. Consequently, while equity markets, which allowed foreign investors to invest in Indian companies in almost all sectors, were opened up to foreign investors, the foreign direct invest-ment regime was liberalised very slowly, sector by sector. The second phase of capital account decontrol thus involved in-ward flows of FDI and portfolio equity investment. Significant values for these first showed up for the 1991-1995 period. Both have grown strongly in the following years, with 2.49 per cent of GDP coming in through FDI and 1.25 per cent of GDP coming in through portfolio investment, in the 2006-2010 period. The third phase of capital account decontrol involved giving per-missions to Indian companies to do overseas FDI. This yielded significant outflows of 0.32 and 1.34 per cent of GDP in the 2001-2005 and 2006-2010 period. While there has been some easing of the rules about outbound investment by individuals, the magnitudes involved have been miniscule.
or below this all the way to 1990. After this, net capital inflows have largely risen consistently to an average of 4.55 per cent of GDP in the 2006-2010 period. In all components other than aid, the largest values for net capital inflow (or outflow) are seen in the 2006-2010 period.
In summary, in terms of the distinction between portfolio flows and FDI, in India’s case, capital account integration with the world economy was dominated by portfolio flows. FDI inflows remained small in the early period while portfolio flows took off. Much later, when FDI flows showed a sharp rise, two-thirds or more of these flows were accounted for by foreign private equity funds, who are financial investors, with decision making that is clearly linked to the stock market in terms of valuations and prospects of exit. Hence, the majority of what is reported as ‘FDI inflows’ into India actually reflects financial globalisation. India is thus unusual among emerging markets in having capital account integration dominated by the process of domestic firms
accessing foreign capital through both portfolio investment into listed equity and investments into unlisted firms by private eq-uity funds.
With both trade and capital account liberalisation, the opening of the economy has taken place gradually. As emphasised above, measures of trade and capital account integration showed sub-tantial change from roughly 2000 onwards. This reflected a com-bination of policy gradualism, and the numerous areas in which institutional change was required as a concomitant of opening the economy.
2.2
Internationalisation of firms
Firm internationalisation lies at the centre of India’s engage-ment with financial globalisation. There is sharp evidence of internationalisation at the firm level. Five dimensions of inter-nationalisation can be examined:
1. A firm could import, thus buying raw materials and/or capital goods from foreign providers;
2. A firm could export;
3. A firm could obtain equity capital from external sources; 4. A firm could obtain debt capital from external sources
(whether local-currency denominated or foreign-currency denominated);
5. A firm could expand overseas, thus placing foreign assets on its balance sheet.
In order to describe the extent of internationalisation of Indian firms, we define four categories:
None 0 percent
Low Between 0 percent and 10 percent
Medium Between 10 percent and 50 percent
High Above 50 percent
Using information from the CMIE database, we classify all large Indian firms into one of these four categories in all the four dimensions.1
Table 2 approaches internationalisation of Indian firms by re-porting the fraction of aggregate firm size in each category. For our purposes, size is defined as the average of firm sales and total assets.
In 2001-02, 64 percent of total firms size involved corporations importing in the Medium or High categories. By 2008-09, this had risen to 66 per cent, a rise of 2 per cent. With exports, in 2001-02, 15 per cent of this mass was in either Medium or High. By 2008-09, the total firm size with export intensity in
1In 2001-02, there were 6,575 listed firms in India and in 2007-08 there
Table 2: Internationalisation of India’s listed firms
Percentage of total mass of all listed companies
2001-02 2008-09
None Low Med. High None Low Med. High Imports 5.31 30.70 48.26 15.71 5.99 27.53 51.45 15.01 Exports 56.63 28.33 11.39 3.63 53.84 26.12 11.83 8.21 Foreign equity 22.27 37.33 36.72 3.66 3.70 33.99 56.56 5.74 Foreign borrowing 46.39 14.63 23.66 15.31 25.63 20.14 33.47 20.74 Overseas assets 60.29 39.04 0.45 0.21 43.49 50.00 5.17 1.32
Source: CMIE Prowess database.
the Medium-High categories had risen to 20 per cent, a rise of 5 per cent. With both these trade-based measures, the change in international economic integration over this period was small. While the macroeconomic data on trade integration shows a sharp rise over this period, this data for large firms does not show a sharp change.
Large changes are, however, visible across this period with mea-sures of financial internationalisation. In 2001-02, 40 per cent of the mass of Indian firms had either Medium or High equity investment. By 2008-09, this stood at 62 per cent: a sharp rise of 22 percentage points.
With foreign borrowing, in 2001-02, firms accounting for 39 per cent of the mass were in either Medium or High categories. In 2008-09, this had risen to 54 per cent – despite the stated policy of the government in aiming to deter debt inflows. Finally, with overseas assets, less than 1 per cent of Indian firms had either Medium or High overseas assets in 2001-02. By 2008-09, the number of Indian firms with Medium or High overseas assets had risen sharply to 6 per cent. Over half the mass of firms had non-zero outbound FDI.
A natural area of exploration lies in the interplay of internation-alisation and financing constraints. An early literature found that the domestic financial system, and particularly the equity
market, was sensitive to exporting status. Exporting firms faced reduced financing constraints. However, this evidence is based on the early 1990s, while the large changes in internationalisa-tion of firm financing took place after 2000. These quesinternationalisa-tions, hence, lie largely unexplored.
3
Foreign portfolio investment in the
equity market
In the early 1990s, India opened investment into listed equi-ties through the ‘FII framework’. This involved the following key elements. Some, but not all, foreign investors were eligi-ble to register with the Indian securities regulator (SEBI). Once registered, FIIs could buy shares in India without quantitative restrictions, or constraints on repatriation. No one FII was per-mitted to own more than 5 per cent of a firm, and there were weak restrictions on the ownership by all FIIs taken together. One response of global financial firms to the Indian FII frame-work has been the rise of a market for ‘participatory notes’, which are OTC derivatives on Indian underlyings which are traded offshore. A handful of global firms are book-runners on this market. A foreigner who is not a registered FII with the Indian authorities is able to transact on the PN market. The book-runners then hedge their net exposures of the book using the onshore market, to which they have access by virtue of being registered FIIs in India. One factor which has encouraged the use of PNs is the presence of transaction taxes on the onshore market, while PN transactions avoid these.
As the home bias literature has emphasised, there are many sources of home bias, and capital controls is only one element of these. In the event, when India embarked on a limited easing of capital controls against equity inflows, the home bias of for-eign investors did not strongly change in response. Many other
sources of home bias remained in place, including asymmetric information, capability of the domestic financial system, a lim-ited number of listed firms of adequate size from the viewpoint of international investors, etc.
The desire of policy makers to encourage foreign investors in the Indian equity market, in the early 1990s, helped in reopening long-standing policy questions about the equity market. For-eign investors faced many difficulties in accomplishing transac-tions in the Indian equity market. As an example, in August and September 1993, the settlement system (which was based on physical paper share certificates) found it difficult to handle the settlement volume of foreign investors. Similarly, foreign in-vestors who sent orders to the open outcry trading floor of the Bombay Stock Exchange found an array of problems including high transactions costs and low probability of order execution. A first response of many Indian firms was to issue in New York or London through GDRs and ADRs, thus using the institu-tional capability of these financial systems, and bypassing the infirmities of the domestic financial system. In the early 1990s, there was a sharp increase in this issuance.
When faced with similar conditions, many other developing coun-tries have experienced a hollowing out of domestic financial in-termediation. When a weak domestic financial system is difficult to reform for political reasons, domestic firms tend to interact with foreign investors in international financial centres like New York or London, leading to a shift in financial intermediation to offshore venues.
In the Indian case, from 1993 to 2001, the Ministry of Finance and SEBI led a strong reforms effort aiming at a fundamental transformation of the equity market. The changes on the equity market from December 1993 to June 2001 helped to increase liq-uidity, reduce risk, improve disclosure and increase the number of investors and trades in the market. These reforms led to a shift in the focus of foreign investors away from Indian
securi-ties traded in London or New York, and the primary markets for India-related equities trading became the NSE and BSE in Bombay.
These changes addressed one important source of home bias – the deficiencies of financial development in emerging markets – and were associated with a decline in home bias by foreign investors against investing in India. In 1991, the weight of Indian equities in the portfolio of international investors was zero. In the first decade of India’s opening, this share rose to only 0.04 per cent, reflecting a largely unchanged extent of home bias against India. By 2007, there was a six-fold rise in this weight to 0.24 per cent, suggesting an easing (though not elimination) of home bias.
While India obtained significant financial development and cap-ital account decontrol on the equity market, neither of these changes took place with the bond market and banks. In the same period, firms undertook strong deleveraging through emphasis on equity financing: the debt-equity ratio of large non-financial firms dropped sharply from 1.7 in 1991 to 0.7 in 2007. There may be a causal relationship here: when firms faced greater financing constraints on bond- or bank-financing alongside re-duced financing constraints for equity financing, they may have shifted in favour of greater equity financing. Consequently, while the share of foreign investors in equity rose sharply, in the bond markets it remained limited. Further there were regulatory caps on the stock of holdings of government bond by foreign investors. Corporate bonds were allowed to be held by foreign institutional investors only after 2004.
3.1
Concerns about herding behaviour
One major concern among policy circles has been of anen masse
exit by a herd of foreign investors in a crisis. However, with thousands of foreign investors in India, there have been
het-Table 3: Did FIIs exit en masse at times of domestic stress? Percent to mkt. capn. Event T-1 T T+1 Parliament attack −0.015 0.012 −0.015 12-12-2001 Gujarat riots 0.020 0.025 −0.0001 27-02-2002 UPA government −0.029 −0.060 −0.050 13-05-2004 Mumbai attacks 0.015 NA 0.015 26-11-2008 Source: Sinha (2010)
erogeneous views, and in each crisis, some foreigners have been buying while others have been selling.
Table 3 shows information about net FII inflows on the equity market in four recent episodes of market stress. In each of them, relatively small values are seen for the net sales by FIIs. The largest values in the table involve net sales of 0.11 percent of market capitalisation on the event date (‘T’) and the following day (‘T+1’) associated with the formation of the UPA govern-ment in 2004. The scenario of massive sales by foreigners when India is experiencing difficulties does not fit the evidence we examined.
In the literature on financial globalisation and emerging markets, there have been concerns about the limited knowledge with for-eign investors, which (in turn) leads to behaviour such as herd-ing, sudden capital flow reversals, etc. In the Indian experience on the equity market, the behaviour of foreign investors has been benign.
The exploration of the factors underlying this difference is im-portant. India’s path in capital account liberalisation – with no quantitative restrictions, access to the Indian market for a large number of heterogeneous foreign investors, and with the ability of foreign securities firms to operate in Indian financial
markets – has also been conducive to long-term investments by foreign financial firms in building teams which understand India. For a contrast, India’s rules on foreign investment into rupee-denominated bonds are inimical to the construction of teams and knowledge among foreign investors.
The presence of thousands of heterogenous foreign investors of many kinds – ranging from pension funds to hedge funds – has helped shield the economy from the liquidity motivated orders emanating from any one group of investors in distress or facing correlated regulatory compulsions. The early opening of the cap-ital account, where it was believed that only certain kinds of eign investors should be permitted, induced homogeneity of for-eign investors. However, incremental reform of capital controls has steadily increased the heterogeneity of the investor base. The size and prominence of India in the world economy may have helped in giving foreign investors adequate incentives to obtain information and understanding about India. In these respects, India has a natural advantage in engaging with globalisation when compared with smaller countries.
4
The role of FDI
4.1
Inbound FDI
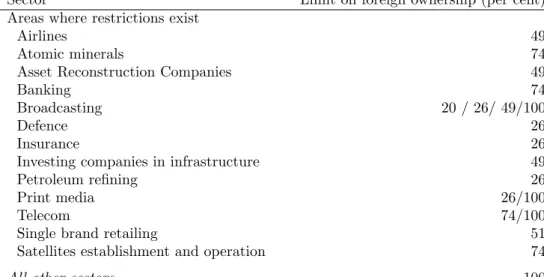
India opened up slowly to FDI in the 1990s. The limits on the share of foreign ownership was slowly increased in every sector. By 2000, while most sectors were open upto 100 percent, sectors where FDI was restricted include retail trading (except single brand product retailing), atomic energy, and betting. Table 4 shows the areas where FDI caps exist.
While inbound FDI investors have the ability to repatriate cap-ital, so far, in the Indian experience, this reverse flow of capital
Sector Limit on foreign ownership (per cent) Areas where restrictions exist
Airlines 49
Atomic minerals 74
Asset Reconstruction Companies 49
Banking 74
Broadcasting 20 / 26/ 49/100
Defence 26
Insurance 26
Investing companies in infrastructure 49
Petroleum refining 26
Print media 26/100
Telecom 74/100
Single brand retailing 51
Satellites establishment and operation 74
All other sectors 100
Source: Foreign Direct Investment Policy, April 2006, Department of Industrial Policy and Promotion, Ministry of Commerce & Industry.
Table 4: Sectoral FDI limits
has been tiny. As an example, in 2006-07, it was 0.01% of GDP. Hence, for all practical purposes, inbound FDI has been a one-way process of capital coming into the country.
When compared with other emerging markets, India has at-tracted relatively little FDI. The first phase of financial glob-alisation primarily involved Indian firms obtaining equity and debt capital from abroad, thus achieving a reduction in the cost of capital. This bolstered the competitive position of Indian firms competing against foreign companies producing in India through FDI and competing in global markets by exporting. The easing of capital controls, coupled with strong investment opportunities in India, gave a strong rise in FDI flows into India: from 0.14% of GDP in 1992-93 to 0.53% in 1999-2000 and then to 2.34% of GDP in 2006-07.
From April 2000 to August 2007, $44 billion came into India through FDI. In terms of the country composition, the bulk of
Country Value Share (Billion USD) (Per cent)
Mauritius 17.4 44.7 USA 3.8 9.9 UK 3.3 8.6 Netherlands 2.2 5.7 Japan 1.8 4.6 Singapore 1.7 4.3 Germany 1.3 3.3
Total (all countries) 44.4 100
Table 5: Country composition of FDI (April 2000 – August 2007)
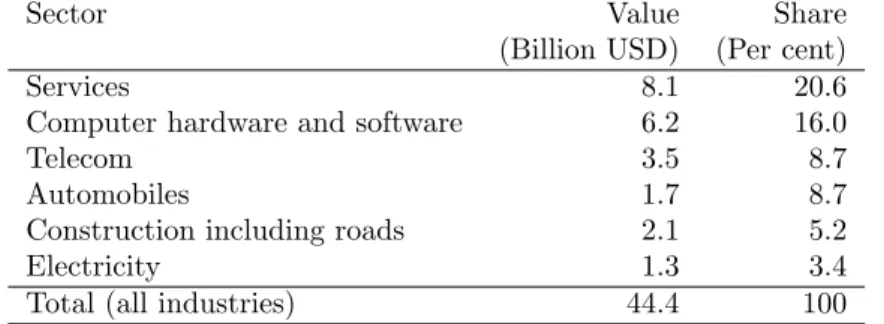
Sector Value Share
(Billion USD) (Per cent)
Services 8.1 20.6
Computer hardware and software 6.2 16.0
Telecom 3.5 8.7
Automobiles 1.7 8.7
Construction including roads 2.1 5.2
Electricity 1.3 3.4
Total (all industries) 44.4 100
Table 6: Sectoral composition of inbound FDI (April 2000 – August 2007)
FDI into India came in from Mauritius: the reason for this is that India has a preferential tax treaty with Mauritius.
Services, financial and non-financial, attracted the highest amount of FDI. Between April 2000 to August 2007 USD 8 billion, or 20.6 percent of all FDI flows, came into the services sector. Next was computer software and hardware which attracted 16 percent of flows. Telecom (8.7%), automobile industry(8.7%) , construc-tion (5.2%) and power (3.4%) came next.
When FDI into India did rise significantly from 2002 onwards, as much as two-thirds of this FDI took the form of foreign pri-vate equity funds buying large stakes in Indian unlisted
compa-nies. This phenomenon can also be interpreted as foreign capital bolstering the competitive position of Indian firms competing against foreign companies producing in India through FDI. This experience can be located in the debates about ‘FDI as bad cholesterol’ literature, where foreign portfolio investment is seen as a bigger accomplishment by an emerging market. FDI requires little institutional capability, while foreign portfolio in-vestment requires high quality firms, domestic financial devel-opment, and capabilities in the legal and regulatory system.
5
Foreign borrowing
In the international literature and in policy thinking amongst emerging markets, the question of currency exposure has come to prominence. When the exchange rate regime gives out expec-tations of low currency risk, firms and governments are encour-aged to borrow in foreign currency. Once currency mismatches are present, when large depreciations take place, this generates considerable distress.
Indian capital controls have been biased against foreign borrow-ing and particularly against short-dated foreign borrowborrow-ing. This policy framework does not reflect an appreciation of issues of currency exposure. Strong restrictions are in place against FII investment in rupee-denominated bonds, while a much larger scale of offshore borrowing in foreign currency takes place. This policy framework has encouraged unhedged currency by firms, particularly in periods when the exchange rate regime involved greater pegging.
These issues came to prominence in 2008, when exchange rate volatility rose, a sharp depreciation took place, and the global credit market experienced turbulence. This had an adverse im-pact on the balance sheets of many Indian firms, particularly those which had borrowed abroad. The experiences of this
pe-riod emphasised the weaknesses of India’s policy positions on the three issues of original sin, the lack of development of the domestic bond market and the lack of development of a domestic banking system.
6
Effectiveness of capital controls and
the exchange rate regime
India has an elaborate system of administrative capital controls. Rules differ according to investor classes, the markets operated in and the assets bought or sold. This implies that capital con-trols involve a number of institutions and regulators. Apart from the Government of India, capital flows are regulated by the Reserve Bank of India, the Securities and Exchange Board of India, the Forward Markets Commission, the Insurance ulatory and Development Authority, and the Pension Fund Reg-ulatory and Development Authority. Within the Government of India, the Ministry of Finance deals with portfolio investment, and the Ministry of Commerce with foreign direct investment policy.
The legal powers to regulate capital flows also emanate from a number of laws. Capital flows are regulated by the Reserve Bank of India under the powers it has through the Foreign Exchange Management Act, 1999. Reserve Bank of India is authorized to manage transactions and capital flows in consultation with the Ministry of Finance. In addition, the Banking Regulation Act, 1949, and the Reserve Bank of India Act, 1934 and Reserve Bank of India Amendment Act of 2006 which also provide the Reserve Bank of India with the authority to regulate capital flows.
The Acts then work through regulations, circulars and clari-fications. One, the Reserve Bank of India articulates policy with regard to capital account transactions through regulations.
These must be placed before Parliament. Further there are no-tifications. These require publication in the official gazette. In addition the Reserve Bank of India issues circulars, master cir-culars and clarifications.
The critical question in this field is: Are India’s capital controls sufficiently onerous and sufficiently effective to give monetary policy autonomy alongside exchange rate pegging? Or does the pursuit of pegging set off distortions of monetary policy, which could then force a shift away from pegging?
Across time, three factors are giving greater de facto openness: the gradual pace of de jure capital account liberalisation, the increasing sophistication of firms including their conversion into multinationals, and the increasing capability of the domestic financial system through which financial engineering can be un-dertaken to bypass capital controls. As an example, positions on equities and options can be combined to achieve synthetic corporate bonds, thus frustrating capital controls against debt positions.
Some evidence using firm data suggests that the effectiveness of the capital controls is relatively limited. The first dimen-sion of this evidence lies in the exchange rate exposure of firms. Capital controls in India have strong restrictions against dollar-denominated borrowing. If these controls were effective, firms should not be able to take on substantial currency exposure. However, the analysis of the currency exposure of firms shows firms were able to take on and lay off substantial exposures to the dollar (in response to the extent of exchange rate pegging). This suggests that the effectiveness of capital controls against dollar denominated borrowing was limited.
The second dimension of this is the episode where Lehman failed in September 2008. Indian capital controls do not allow firms to take foreign currency loans of maturity less than 3 years. Under a null hypothesis that India’s de jure capital controls were fully effective, India should have been quite disconnected from the
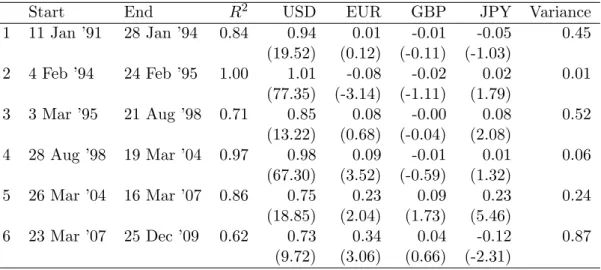
Start End R2 USD EUR GBP JPY Variance 1 11 Jan ’91 28 Jan ’94 0.84 0.94 0.01 -0.01 -0.05 0.45 (19.52) (0.12) (-0.11) (-1.03) 2 4 Feb ’94 24 Feb ’95 1.00 1.01 -0.08 -0.02 0.02 0.01 (77.35) (-3.14) (-1.11) (1.79) 3 3 Mar ’95 21 Aug ’98 0.71 0.85 0.08 -0.00 0.08 0.52 (13.22) (0.68) (-0.04) (2.08) 4 28 Aug ’98 19 Mar ’04 0.97 0.98 0.09 -0.01 0.01 0.06 (67.30) (3.52) (-0.59) (1.32) 5 26 Mar ’04 16 Mar ’07 0.86 0.75 0.23 0.09 0.23 0.24 (18.85) (2.04) (1.73) (5.46) 6 23 Mar ’07 25 Dec ’09 0.62 0.73 0.34 0.04 -0.12 0.87 (9.72) (3.06) (0.66) (-2.31)
Table 7: Evolution of the Indian exchange rate regime
global crisis, given that firms were prohibited from engaging in short-term foreign borrowing. However, in the event, the Indian money market was thrown into turmoil, and the operating pro-cedures of monetary policy broke down, despite a modest 1% of GDP of an exit by foreign portfolio investors in the immediate aftermath of the Lehman default.
The third dimension of this lies in the analysis of the onshore premium on currency forwards compared with that seen abroad on the NDF market. Over the years, mispricings between these have been arbitraged away more effectively, suggesting increas-ing de facto openness.
To the extent that capital controls are not effective, when mon-etary policy pursues a pegged exchange rate, significant distor-tions of monetary policy should build up. Hence, we examine structural change of the Indian exchange rate regime.
The rupee dollar exchange rate was administered by the RBI till 1993. After that the de jure exchange rate regime was de-clared a managed float. However, de facto currency regime was a peg to the US dollar. Details of the exchange rate regime can
be seen in Table 7. This reports estimation results of the ex-change rate regression, where a numeraire (the Swiss franc) is chosen. The regression explains weekly percentage changes in the rupee-franc rate, and the explanatory variables are weekly percentage changes of the USD/CHF rate, the EUR/CHF rate, the GBP/CHF rate and the JPY/CHF rate. These parameter estimates show how tight the USD peg was. If there is pegging to the USD, then fluctuations in the GBP, JPY and EUR will be irrelevant, and we will observe β3 =β4 = β5 = 0 while β2 = 1.
The coefficient reveals the tightness of the peg to the USD. The
R2 of this regression shows the degree of flexibility. Values near
1 suggest lower exchange rate flexibility.
Structural change econometrics is used to identify dates of struc-tural change. Hence, Table 7 shows the evolution of the ex-change rate regime.
In Period 1, which started in January 1991, the only significant coefficient in Period 1 was that of the USD, and there was high inflexibility with an R2 of 0.84. After an IMF program, India
embarked on a reform of the exchange rate regime, to a ‘market determined exchange rate’. In Period 2, the R2 actually went to 1.0, showing a shift to a fixed rate. The implementation of the exchange rate regime in Period 2, which involved unsterilised intervention, was associated with significant monetary policy distortions and helped kick off an upsurge in inflation.
The first experience with flexibility came in Period 3, in the Asian crisis, where theR2 dropped to 0.71. In this period, there was a small Yen coefficient but the focus remained the US dollar. In January 1998, an interest rate defence of the exchange rate was mounted, with a 200 bps rise in the short rate despite weak business cycle conditions.
Once the Asian crisis subsided, pegging to the dollar recom-menced with an R2 of 0.97 in Period 4. This was a period of
sterilised intervention, where large purchases of dollars were ac-companied by sale of government bonds. In December 2003, the
stock of domestic government bonds was exhausted, and this period soon come to an end.
Slighly greater flexibility came about in Period 5, with an R2
of 0.86. In this period, an unprecedented scale of currency in-tervention was accompanied by only partial sterilisation. This kicked off the largest ever credit boom in Indian history.
Finally, Period 6 shows the largest ever flexibility in the history of India’s exchange rate regime, with anR2 of 0.62. This reflects a combination of unusual turbulence in 2008, and a reduced scale of intervention by the central bank.
If Indian capital controls were effective and India was largely closed on the capital account, this complex interplay between the exchange rate regime and monetary policy autonomy would not have arisen. India would have been able to pursue exchange rate pegging without attendant distortions of monetary policy. However, as this evidence shows, the pursuit of pegging has re-peatedly induced substantial monetary policy distortions. Two periods of near-fixed rates stand out: Period 2 and Period 4. After the end of Period 4 in 2004, there has been significant movement towards greater exchange rate flexibility. This is sistent with an environment of relatively ineffective capital con-trols, and significant de facto openness.
The ‘Bretton-Woods II’ hypothesis predicts that countries like India should pursue exchange rate mercantalism with central banks building up foreign exchange reserves so as to undervalue the exchange rate. In the 19 years of experience summarised in Table 7, there are two periods where India’s behaviour fit these predictions: Period 2 (1 year) and Period 4 (5.5 years). These add up to a third of India’s experience. The Indian case, hence, does not support the Bretton Woods II proposition, that exchange rate undervaluation through currency intervention is a stable and sustainable solution for developing countries.
7
Domestic finance and international
finance
Some emerging markets have experienced a significant shift of financial market activity to international financial centres. By and large, this has not taken place in India.
In the equity market, for a handful of ADRs, liquidity in the US exceeds that found in India. In certain kinds of OTC in-terest rate derivatives, the offshore market is bigger than the onshore market. Looking across the financial system, the do-mestic financial system is the dominant venue, apart from two exceptions (some kinds of OTC interest rate derivatives and a few ADRs).
Bombay is also starting to become an international financial centre in some respects. Some elements of financial services production by global firms is being done in India (mostly in Bombay) through offshoring. A first ‘Indian Depository Receipt’ listing has taken place.
Improvements in domestic financial development, and in the ca-pabilities of domestic financial regulation, are likely to induce a stronger position for domestic financial intermediation and for Bombay as an international financial centre. In addition, three key factors will shape this evolution: increased de facto open-ness, domestic home bias and the tax treatment of international finance.
Domestic financial intermediation has held its ground owing to successful financial development in some areas. However, one factor which has assisted this is the system of capital controls. As an example, onshore customers of index futures are forced to use the onshore Nifty futures, and are unable to send orders abroad (to either the SGX-traded or the CME-traded futures on Nifty). Increased de facto openness will reduce the extent to which the domestic financial system enjoys this protectionist
ad-vantage. If changes in de facto openness are large, and progress on domestic financial development are weak, then a hollowing out of domestic financial intermediation could arise, as has taken place with many other countries.
A second key element of this lies in tax treatment of interna-tional finance. The Indian tax regime on these questions involves two key elements. First, there is a source-based tax treatment including a securities transactions tax. Second, once foreign investors route their investments into India through Mauritius, they get a residence-based treatment (i.e. exemption of taxation of non-residents) except for the securities transaction tax. Source-based taxation is inimical to onshore financial interme-diation. When India imposes taxes on non-resident financial activity in India, non-residents have an incentive to send orders on India-related contracts to venues such as Singapore, Lon-don and New York, all of which have residence-based taxation. Hence, until India gets to a framework of residence-based taxa-tion, and particularly if India removes or modifies the Mauritius tax treaty, there is a risk of a hollowing out of domestic financial intermediation.
The third key element lies in domestic home bias. The portfolios of Indian residents and Indian portfolio managers are strongly tilted in favour of India. This reflects a combination of informa-tion asymmetries and capital controls. Banks, pension funds and insurance companies have no international diversification. To the extent that this home bias is alleviated, the large flow of In-dian savings could attract international issuers. This could bol-ster onshore financial intermediation through issuance of shares and bonds in India.
In summary, so far, domestic financial intermediation has held up well, except for a handful of ADRs and some kinds of OTC interest rate derivatives, where an offshore market has greater liquidity than the onshore market. Bombay is in the early stages of becoming an international financial centre, through the
tradi-tional route (e.g. equity issuance by global companies in Bom-bay) and through a new and non-traditional route (some parts of global financial services production taking place in Bombay). But these relationships between domestic finance and interna-tional finance could fluctuate based on the four factors:
1. The extent to which domestic financial regulation improves, which would attract onshore activity,
2. Offshore finance will be able to better compete with on-shore finance owing to deepeningde factoopenness. Hence, onshore finance will lose ground unless domestic financial regulation improves.
3. The extent to which India is able to shift to a residence-based framework for taxation, which is essential for ensur-ing that foreign order flow comes to India, and
4. The extent to which the home bias of Indian portfolios is diminished, which would help to attract international securities issuance in India.
8
Policy questions about capital
con-trols and monetary policy
India has evolved a complex system of capital controls. If a single capital controls manual were released by the government, it would run to thousands of pages of detailed rules. As in other areas of public policy, complex and detailed systems of rules have many problems.
The first concern lies in the extent to which the rule makers are omniscient. As an example, India’s positions on foreign bor-rowing are out of touch with contemporary economic thinking in terms of blocking the onshore rupee-denominated bond mar-ket in favour of offshore foreign-currency borrowing. Many other
microeconomic distortions are visible, where a sophisticated pri-vate sector maximises given the ruleset, giving unintended con-sequences in the form of microeconomic distortions.
The second issue is the transactions costs associated with cap-ital controls. Bureaucrats, lawyers and accountants lead to an increased time and cost of undertaking transactions when com-pared with that seen in a simpler system. Reforms which remove these deadweight costs would give benefits. In addition, in the optimisation of the private sector, these fixed costs are justified for large transactions but not for small transactions. Hence, the Indian system of capital controls is biased in favour of giving large firms greater access to the international financial system. Third, there is more de facto openness than meets the eye. While India appears largely closed at first, the ingenuity of fi-nancial engineering coupled with legal engineering implies that for a sufficiently large expenditure of time and fees, many trans-actions are feasible. If India were largely closed, then the pursuit of exchange rate pegging would not have induced large mone-tary policy distortions. If India were largely closed, the failure of Lehman would not have triggered off a breakdown of the op-erating procedures of Indian monetary policy, despite a lack of exit by foreign investors.
These three issues will shape the policy analysis of the Indian system of capital controls. The second important group of policy questions concerns monetary policy. As India’s capital account openness has deepened, the pursuit of exchange rate pegging would imply an increased loss of control of monetary policy. In response to this, exchange rate flexibility has risen, with the R2
of the Frankel-Wei regression going down from 1.0 in Period 2 to 0.62 in Period 6.
However, all the changes of the exchange rate regime shown in Table 7 other than Period 2 were made without announcement by the central bank. This raises questions about the goals and operational procedures of monetary policy. What public
state-ments would be made about the exchange rate regime? Since a floating exchange rate is not a monetary policy regime, what is the best use of the lever of monetary policy, once autonomy has been regained through shifting away from exchange rate pegging? What framework for accountability and transparency should be employed for the central bank, once the central bank is not held accountable for achieving an exchange rate target? If monetary policy clearly moves away from the pursuit of ex-change rate pegging, then would this clear the decks for simpli-fication of the system of capital account restrictions, and de jure
References
Echeverri-Gent, J. (2007): “Politics of market
microstruc-ture,” in India’s Economic Transition: The Politics of Re-form, ed. by R. Mukherji, chap. 11. Oxford University Press, New Delhi.
Lahiri, A. K. (2009): “Indian financial reforms: National
priorities amidst an international crisis,” Purushotamdas Thakurdas Memorial Lecture, ADB.
Lane, P. R., and S. L. Schmukler (2007): “The
interna-tional financial integration of China and India,” Discussion Paper 4132, World Bank.
Mistry, P. (2007): “Making Mumbai an International
Finan-cial Centre,” Committee report, Sage Publishing and Ministry of Finance, Government of India.
Oura, H.(2008): “Financial development and growth in India:
A growing tiger in a cage?,” Discussion Paper 08/79, IMF.
Patnaik, I. (2005): “India’s experience with a pegged
ex-change rate,” inThe India Policy Forum 2004, ed. by S. Bery, B. Bosworth, and A. Panagariya, pp. 189–226. Brookings In-stitution Press and NCAER.
Patnaik, I., and A. Shah (2009-10): “Why India choked
when Lehman broke,” India Policy Forum, 6.
Patnaik, I., A. Shah, A. Sethy, and V.
Balasubrama-niam(2011): “The exchange rate regime in Asia: From crisis
to crisis,” International Review of Economics and Finance, 20(1), 32–43.
Pradhan, J. (2004): “The determinants of outward foreign
direct investment: a firm-level analysis of Indian manufactur-ing,” Oxford Development Studies, 32(4), 619–639.
ap-proach to capital account liberalisation,” Discussion Paper 14658, NBER.
Rajan, R. (2008): “Committee for Financial Sector Reforms,”
Committee report, Planning Commission, Government of In-dia.
Shah, A., and I. Patnaik (2007): “India’s experience with
capital flows: The elusive quest for a sustainable current ac-count deficit,” in Capital controls and capital flows in emerg-ing economies: Policies, practices and consequences, ed. by S. Edwards, chap. 13, pp. 609–643. The University of Chicago Press.
Shah, A., S. Thomas, and M. Gorham (2008): India’s
Financial Markets: An Insider’s Guide to How the Markets Work. Elsevier.
Sinha, U. K.(2010): “Working Group on Foreign Investment,”
Committee report, Department of Economic Affairs, Ministry of Finance.
Thomas, S. (2006): “How the financial sector in India was
reformed,” inDocumenting reforms: Case studies from India, ed. by S. Narayan, pp. 171–210. Macmillan India, New Delhi.