econ
stor
www.econstor.eu
Der Open-Access-Publikationsserver der ZBW – Leibniz-Informationszentrum Wirtschaft
The Open Access Publication Server of the ZBW – Leibniz Information Centre for Economics
Nutzungsbedingungen:
Die ZBW räumt Ihnen als Nutzerin/Nutzer das unentgeltliche, räumlich unbeschränkte und zeitlich auf die Dauer des Schutzrechts beschränkte einfache Recht ein, das ausgewählte Werk im Rahmen der unter
→ http://www.econstor.eu/dspace/Nutzungsbedingungen nachzulesenden vollständigen Nutzungsbedingungen zu vervielfältigen, mit denen die Nutzerin/der Nutzer sich durch die erste Nutzung einverstanden erklärt.
Terms of use:
The ZBW grants you, the user, the non-exclusive right to use the selected work free of charge, territorially unrestricted and within the time limit of the term of the property rights according to the terms specified at
→ http://www.econstor.eu/dspace/Nutzungsbedingungen By the first use of the selected work the user agrees and declares to comply with these terms of use.
zbw
Leibniz-Informationszentrum Wirtschaft Leibniz Information Centre for EconomicsNunnenkamp, Peter
Working Paper
Boom and bust in capital flows to developing
countries : what South Asia can learn from recent
financial crises
Kiel Working Papers, No. 853
Provided in cooperation with:
Institut für Weltwirtschaft (IfW)
Suggested citation: Nunnenkamp, Peter (1998) : Boom and bust in capital flows to developing countries : what South Asia can learn from recent financial crises, Kiel Working Papers, No. 853, http://hdl.handle.net/10419/1005
Kieler Arbeitspapiere
Kiel Working Papers
Kiel Working Paper No. 853
Boom and Bust in Capital Flows to Developing Countries
What South Asia Can Learn from Recent Financial Crises
by Peter Nunnenkamp
Institut fur Weltwirtschaft an der Universitat Kiel
The Kiel Institute of World Economics
Kiel Institute of World Economics Diisternbrooker Weg 120, D-24105 Kiel
Department IV
Kiel Working Paper No. 853
Boom and Bust in Capital Flows to Developing Countries
What South Asia Can Learn from Recent Financial Crises
by
Peter Nunnenkamp March 1998
The authors themselves, not the Kiel Institute of World Economics, are responsible for the contents and distribution of Kiel Working Papers.
Since the series involves manuscripts in a preliminary form, interested readers are requested to direct criticisms and suggestions directly to the authors and to clear any quotations with them.
Abstract
Politicians in Asia and some economists contend that developing countries are at the mercy of the rapidly changing winds blowing from international capital markets. We are indeed witnessing another episode of volatility in capital flows, with foreign investors suddenly fleeing emerging markets in Asia. However, speculative attacks are a symptom, rather than the cause of financial turbulences and currency crises in developing countries. In the era of globalization, policy consistency and government credibility have become still more important for sustaining external financing. South Asia would be ill - advised to forgo the benefits of capital inflows in order to avoid the risk of subsequent outflows. Rather, South Asian governments should not repeat the economic policy failures that are underlying the recent crises in Latin America and East Asia.
1
I. INTRODUCTION
According to Malaysia's Prime Minister, Mahathir Bin Mohamad, the verdict on foreign investors in developing countries (DCs) is clear: DCs "can be suddenly manipulated and forced to bow to the great fund managers who have now come to be the people to decide who should prosper and who shouldn't.... Quite a few people who are ... in control of the big money seem to want to see these South East Asian countries and in particular Malaysia stop trying to catch up with their superiors and to know their place. If they don't then they will just have to be made to do so and these people have the means and the wherewithal to force their will on these upstarts" (Mahathir 1997).
You may ask, of course, why these "hostile elements" were so eager to participate in the previous economic boom by investing in East Asia and lending money until recently. You may wonder still more why foreign investors were allowed to engage in Malaysia in the first place, and why Asian leaders were not complaining when they were receiving huge inflows of capital. In an interview with the Times of India (on December 31, 1997), a prominent economist, Jagdish Bhagwati suggests an answer to this kind of question: "Wall Street has become a very powerful influence in terms of seeking markets everywhere. Morgan Stanley and all these gigantic firms want to be able to get into other markets and essentially see capital account convertibility as what will enable them to operate everywhere .... Wall Street views are very dominant in terms of the kind of world
you want to see. They want the ability to take capital in and out freely" (quoted as in Wade and Veneroso 1998).
This seems to imply that DCs which complied with Wall Street demands by opening up towards international capital markets have acted against their own interest. Wade and Veneroso (1998) draw the logical conclusion: They argue that high-saving Asian economies do not need foreign savings, and advise Asian governments to close the capital account so that mobile capital cannot move freely in and out. Once again, Bhagwati provides support: Capital markets "are very volatile. Suddenly expectations can turn around. You may be very healthy but suddenly you can catch pneumonia. ... Markets may do something when you have done nothing wrong. ... I would put off capital account convertibility for quite a while".
Bhagwati's assertions on volatility and changing expectations in international capital markets are plain truth. Yet, much of the above reasoning amounts to shooting the messenger of bad news. Moreover, it would become more difficult for DCs in South Asia and in other regions to catch up economically with more advanced economies if DCs were to reverse the course of opening up towards international capital markets.
This proposition is substantiated in several steps in the following. First, I portray recent trends in capital flows to DCs. Second, I present a more balanced account on opportunities and risks of increased capital mobility for DCs. Third, I consider
volatility in international capital flows to be a symptom, rather than the cause of recent financial turbulences in Latin America and East Asia. Crises were caused by inconsistent economic policies, lack of credibility and government-induced incentive problems. Fourth, by reviewing the experience of South Asia, I show that openness has been instrumental to economic catching up. Finally, I discuss possible ways of limiting the risk of sudden capital outflows. I stress the role of foreign direct investment (FDI) in sustaining external financing and in overcoming financial crises.
II. FOREIGN CAPITAL FLOWS TO DCS
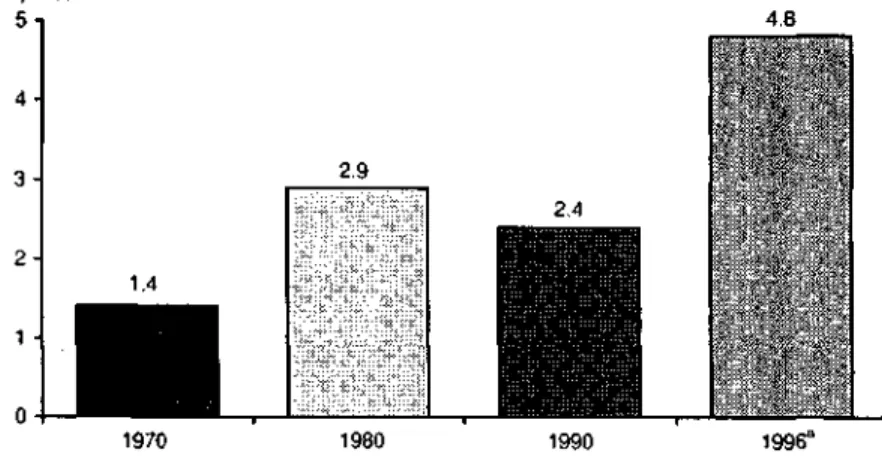
Foreign capital inflows are of increasing importance in DCs. Relative to GDP, net resource flows to all DCs doubled in the 1970s (Figure 1). The subsequent decline in this ratio can be attributed to the foreign debt crisis that hit particularly Latin American countries in the first half of the 1980s. In 1996, however, the ratio of net resource flows to GDP reached an unprecedented level of almost 5 per cent. FDI data underscore the improved attractiveness of DCs to foreign capital. In 1994/95, FDI inflows accounted for 8 per cent of gross fixed capital formation in DCs, about twice as much as in industrial countries (UNCTAD 1997). The share of DCs in worldwide FDI flows doubled from 17 per cent in 1985-1990 to 35 percent in 1994-1996.
Figure 1 — Net Resource Flows to All DCs (percent of GDP), 1970-1996 per cent 5 3 -4.8 2.9 2.4 1970 1980 1990 1996a Preliminary.
Source: World Bank (1997a).
Figure 2 portrays the development of capital flows to DCs from three major sources since 1980. Stylized facts are as follows:1
- External financing of DCs shifted from debt to equity finance. FDI inflows into the 14 DCs considered in Figure 2 increased tenfold in 1980-1996. FDI became the most important source of external financing in the mid-1990s. Furthermore, the steadily rising trend suggests that FDI was least affected by turbulence in international capital markets.
- Portfolio investment in DCs remained marginal throughout the 1980s. It soared from US$ 0.6 billion in 1989 to US$ 90 billion in 1993. In contrast to FDI,
however, portfolio investment proved to be extremely volatile. The Mexican peso crisis of 1994/95 was associated with a sharp fall in portfolio investment. The sudden reversal of portfolio investment was most pronounced in Mexico, but several Latin American economies, notably Argentina, suffered from contagion.
Figure 2 — Capital Flows to DCsa: FDI, Portfolio Investment and Other Investment
Liabilities, 1980-1996 (US$ billion)
100 I 80- 60-4 0 • 20 0 • -20 1980 1982 1984 1986 1988
FDI in reporting economies
1990 1992 1994 1996
portfolio investment liabilities
other investment liabilities (loans and other financial instruments)
aFlows to a group of 14 DCs (Argentina, Brazil, Chile, China, Colombia, Egypt, Indonesia,
Malaysia, Mexico, Philippines, Singapore, South Korea, Thailand and Venezuela); 1980 without China and Indonesia; 1981 without China; portfolio investment liabilities without Chile in 1980-1985; 1996 without Brazil, Indonesia, Malaysia and Philippines. The group of 14 DCs accounted for 65 per cent of FDI, portfolio investment and other investment in all DCs in 1993-1995.
Source: IMF (b).
- External financing through debt instruments (other investment liabilities in Figure 2) turned negative in the second half of the 1980s. This was probably
6
due to a combination of supply and demand factors. Foreign banks refused further loans to debt-ridden DCs, and various DCs preferred equity over debt finance. The situation changed in the 1990s when the significance of debt instruments fluctuated heavily. Booming other investment liabilities in 1995 are attributable to steeply increasing debt inflows into Brazil and some Asian DCs. The latter financed rising current account deficits by short-term borrowing abroad (see section IV.2).
Most recent data on foreign capital flows to DCs underline various of the above findings.2 Compared with 1996, net private capital flows to leading emerging
markets declined by one third to about US$ 200 billion in 1997. This decline is to be attributed to financial turbulence in East Asia. The five major problem countries in this region (Indonesia, Malaysia, Philippines, South Korea and Thailand), which had received capital inflows of more than US$ 90 billion in 1996, suffered capital outflows of US$ 12 billion in 1997. The East Asian crisis did not cause a sudden reversal of capital flows to emerging markets in other regions, which reported stagnating or even increasing inflows in 1997.3
The reaction to the East Asian crisis differed significantly between major types of foreign finance. FDI remained unaffected; FDI flows to all emerging markets
2 The subsequent data on net private capital flows to major emerging markets were
released by the Institute of International Finance in February 1998, and are summarized in Quinlan (1998).
3 It is expected that capital flows to Latin America will decline by about US$ 15 billion in 1998. However, the projected inflows of US$ 75 billion to this region in 1998 would still be twice as high as inflows in IW5 (Quinlan 1998).
7
continued to grow by about 20 per cent per annum, exceeding US$ 114 billion in 1997. By contrast, portfolio investment and bank lending revealed their volatile nature once again. Portfolio equity investment in emerging markets was reduced by about 40 per cent to less than US$ 20 billion in 1997,4 The sudden shift was
even more pronounced with regard to commercial bank lending to emerging markets, which was practically zero in 1997. Not surprisingly, this turnaround hit particularly East Asian economies. The previous lending boom came to an abrupt end, and these economies suffered debt-related capital outflows of US$ 21 billion in 1997.
III. INCREASED CAPITAL MOBILITY: CATCHING UP UNDER POLICY CONSTRAINTS
International capital mobility appears to be extremely high when looking at cross-border financial flows. By contrast, real capital mobility is revealed by the difference between investment and domestic savings, i.e., the current account balance. Current account deficits rarely exceeded 5 per cent of DCs' GDP over longer time periods. Econometric analyses pointed to de facto segmentation of capital markets in the 1960s and 1970s (Feldstein and Horioka 1980). Domestic savings have remained the key to investment in the 1990s. However, real capital mobility has increased over time. Feldstein (1994) shows that the correlation
4 According to IMF (a), equity securities accounted for 31 per cent of "overall
portfolio investment liabilities of all DCs in 1994-1995; bonds and notes accounted for more than two thirds, whereas the contribution of money market instruments and financial derivatives to overall portfolio investment liabilities was marginal.
coefficient between domestic saving rates and investment rates declined from more than 0.8 in the 1960s to about 0.6 in the 1980s.
Relaxation of capital controls in various emerging markets is one important factor underlying increased capital mobility. The European Round Table of Industrialists (ERTI 1996: 7) identified a "general deregulation and liberalization since the mid-80s in a tide of movement in many countries to make themselves more attractive to foreign investment". Likewise, the IMF (1997a: Box 9) reported a significant decline in an index of capital controls in emerging markets, especially since the early 1990s. The (negative) correlation between this index and capital inflows "provides some simple corroboration for the claim that liberalization of external transactions has been instrumental in attracting foreign capital" (ibid: 242).
Furthermore, recent analyses at the Kiel Institute of World Economics point to a strikingly strong correlation between DCs' attractiveness to foreign capital and their .economic growth performance. Gundlach and Nunnenkamp (1996) argue that globalized capital markets have improved the prospects of DCs to catch up economically with industrial countries. This view is supported by the following observations:
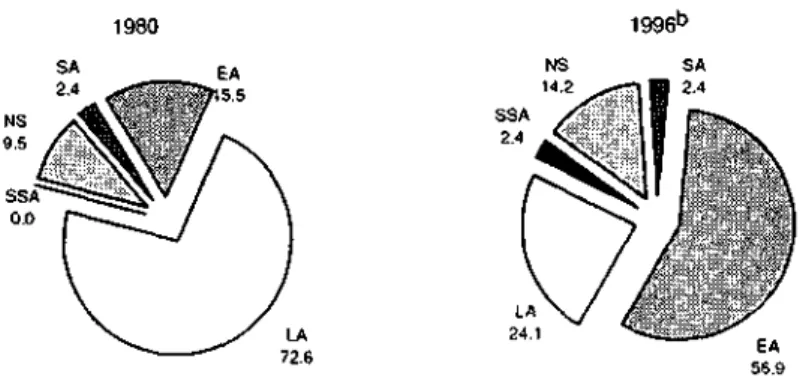
- As noted before, DCs attracted more than a third of worldwide FDI in the mid-1990s. At the same time, the regional distribution of FDI flows to DCs reveals significant shifts between 1980 and 1996 (Figure 3). Most notably, Latin
America lost its top position in attracting FDI to East Asia.5 The m/ra-regional
distribution of FDI flows changed as well. In Latin America, for instance,
Brazil suffered substantially impaired attractiveness; Argentina, Chile, Mexico
and some smaller economies increased their share in total Latin American FDI
inflows (for details, see Nunnenkamp 1997).
Figure 3 — Regional Distribution of (net) FDI Flows to DCsa, 1980 and 1996
1980 1996b
EA
5.5
EA: East Asia and Pacific (data on Hong Kong, Singapore, South Korea and Taiwan not reported in the source); LA: Latin America and Caribbean; SA: South Asia; SSA: Sub-Saharan Africa; NS: not specified.
Percentage share in FDI flows to DCs except Middle East and North Africa; this region is excluded because of negative (net) FDI flows in 1980. — bpr e|jmjn a ry.
Source: World Bank (1997a).
- FDI shifts between and within regions are clearly related to economic policies
pursued by DC governments. Typically, early reformers with a favorable
record on macroeconomic stability, investment and human capital formation
The constant share of South Asia in Figure 3 obscures that this region's relative attractiveness declined in the early 1980s and recovered thereafter, especially since 1991; sec also section V below.
10
gained FDI shares, whereas latecomers in reform (such as Brazil) lost FDI shares.^
- DCs which proved to be attractive to foreign capital were successful in catching up with industrial countries. The different experience of East Asia and Latin America is most striking again. Per-capita income growth in the latter region lagged considerably behind per-capita income growth in industrial countries, whereas the former region reported an outstandingly favorable growth performance (Figure 4). South Asia, too, caught up somewhat with Figure 4— International Comparison of Per-capita Income Growth, 1985-1995a
s
5*Industrial Sub-Saharan Latin America East Asia South Asia countries" A f r i c a
aAnnual average. — b i n d i n g some newly industrializing economies with high per-capita
income.
Source: World Bank (1997b).
For a detailed discussion of the link between economic policy and attractiveness to foreign capital, see, e.g., Gundlach and Nunnenkamp (1996) (for an inter-regional perspective), and Nunnenkamp (1997) (for a Latin American perspective).
11
industrial countries, though with less speed and from a fairly low level of per-capita income. Similarly, the intra-Latin American pattern of attractiveness to foreign capital is reflected in intra-regional growth differences. Chile, the region's frontrunner in economic reform, was most successful in catching up (Nunnenkamp 1997; 1998c).
I have dealt with correlations so far, and one may object that causation can run both ways when considering attractiveness to foreign capital and economic catching up. For example, various empirical investigations identified economic growth as an important determinant of FD1. Yet, there is reason to believe that openness towards international capital markets renders it easier to catch up economically. Openness implies that investment in DCs is no longer constrained by domestic savings. Higher investment, in turn, promotes labor productivity growth and, thereby, allows for higher per-capita income. This is all the more so as certain types of foreign capital inflows, notably FDI, offer more than just capital. FDI tends to provide for managerial know-how, easier access to foreign markets and, most importantly, access to internationally available technologies. Technology transfers reduce the risk for DCs, which are still playing a marginal role in generating technical progress, to fall behind technologically leading economies.
Recent analyses support the view that openness is instrumental to achieving high economic growth (Sachs and Warner 1995; Gundlach 1997). According to
12
regression results of Gundlach (1997), open DCs converge to the steady-state at a rate of about 5 per cent whereas closed DCs converge at a rate of about 1.5 per cent. This confirms theoretical predictions according to which convergence rates for open and closed economies should differ by a factor of about 2.5. Openness is defined as in Montiel (1994), who used the Feldstein-Horioka approach of measuring international capital mobility in a time-series context: DCs for which the correlation between the investment rate and the domestic saving rate turned out to be lower (higher) than 0.6 are considered to be open (closed).
These findings contradict the notion that, when opening up towards international capital markets, DCs are complying with Wall Street demands and acting against their own interest. However, openness involves risk. The risk of drawing on foreign capital, in order to supplement domestic savings, is twofold. First, an open capital account increases the impact of changes in world-market conditions on DCs. High capital flows to Latin America in the early 1990s, for example, were partly explained by external economic conditions, like recession in the United States and low international interest rates (Calvo, Leiderman and Reinhart 1992). The perceived "hot money" character of inflows raised several concerns at that time already. Capital inflows may adversely affect the international competitiveness of exports if they result in undesired real exchange-rate appreciation, and deficient financial intermediation in recipient countries may cause misallocation of capital inflows. Such risks are revealed once
world-13
capital-market conditions change. Rising international interest rates may lead to reduced inflows, or even capital outflows. Hence, access to foreign capital comes at the cost of higher macroeconomic vulnerability of recipient countries.
Second, even if capital flows to all DCs as a group are sustained, individual DCs with an open capital account may become the target of speculative attacks (IMF 1997a: 33-35). Increased capital mobility constrains economic policy choices in recipient countries. Policy failures have more serious consequences if capital can move freely in and out. Especially if exchange-rate flexibility is limited, individual DCs may be "tested" through a speculative attack on their exchange rate, combined with an abrupt loss of market access, whenever international capital markets are concerned about inconsistent macroeconomic policies and structural weaknesses. Relatively high inflation and a weak fiscal position can cause overvaluation of the domestic currency, which undermines the government's credibility in defending the nominal exchange rate. Government credibility is particularly low if short-term foreign indebtedness is high in relation to international reserves. A weak domestic financial system adds to the risk of changing expectations, particularly if financial institutions are heavily engaged in financing long-term investment projects of dubious viability by drawing on short-term foreign loans.
B l b l i o t h e k
14
IV. THE ROLE OF DC GOVERNMENTS IN SUSTAINING EXTERNAL FINANCING: VICTIMS OR CULPRITS?
Increased capital mobility has brought with it financial turbulence and currency crises in Asia, Europe and Latin America. The subsequent short account of the Mexican peso crisis in 1994/95 and the most recent turbulence in East Asia reveals that international capital markets tend to overshoot. Nevertheless, these episodes do not confirm Bhagwati's notion that "markets may do something when you have done nothing wrong". Rather, these episodes support the view that policy inconsistency and lack of government credibility are the cause of financial distress, while international capital mobility can multiply the social costs of government failure.
/. The "Tequila" Crisis
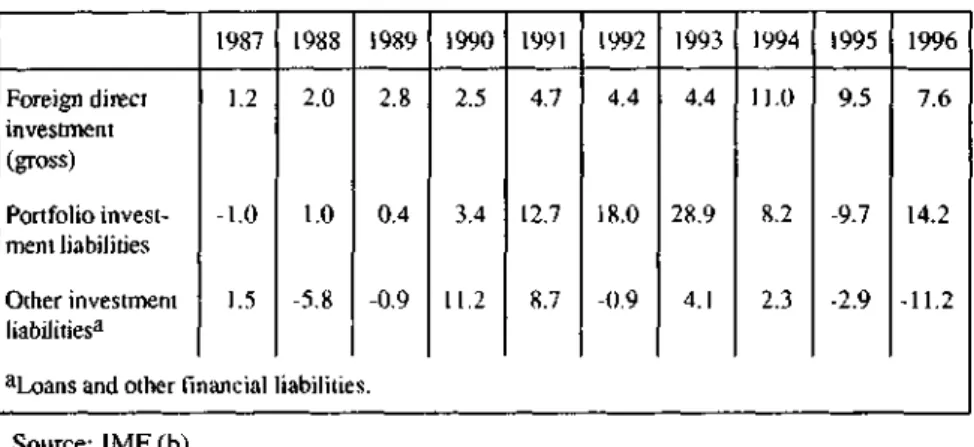
Mexico offers a telling example of boom and bust in capital flows. Far-reaching stabilization and structural reform measures since the late 1980s encouraged huge inflows of FDI, portfolio investment and debt finance (Table 1). Overall capital inflows peaked in 1993 (US$ 37 billion). Ihe crisis erupted only one year later. Overall capital flows turned negative in 1995, and recovered in 1996.
Volatility in overall capital flows to Mexico disguises different developments for specific sources of external finance. FDI flows proved to be relatively stable; FDI inflows in 1995 and 1996 remained significantly above inflows in the pre-crisis year 1993. By contrast, portfolio investment that had contributed 77 per
15
cent to overall capital inflows in 1993 turned negative in 1995. Even portfolio investment comprises relatively stable elements (e.g., investment by pension funds and life insurance companies); volatility in portfolio investment is mainly due to the short-term profit orientation of managed investment funds (country funds and mutual funds) (Langhammer and Schweickert 1995: 22).
Table 1 — Mexico: Foreign Capital Flows, 1987-1996 (US$ billion)
Foreign direct investment (gross) Portfolio invest-ment liabilities Other investment liabilitiesa 1987 1.2 -1.0 1.5
aLoans and other financial
1988 2.0 1.0 -5.8 1989 2.8 0.4 -0.9 iabilities. 1990 2.5 3.4 11.2 1991 4.7 12.7 8.7 1992 4.4 18.0 -0.9 1993 4.4 28.9 4.1 1994 11.0 8.2 2.3 1995 9.5 -9.7 -2.9 1996 7.6 14.2 -11.2 Source: IMF (b).
It is plausible to argue that factors beyond the control of Mexican authorities contributed to volatility. In 1991-1993, economic recession and low interest rates in major industrial countries stimulated capital inflows into Mexico and other DCs. Subsequently, economic recovery in industrial countries and rising interest rates in the United States may have led portfolio investors to withdraw from Mexico. Strikingly, however, portfolio investment in Asian DCs remained almost as high in 1995 as in 1993 (IMF a).7 Hence, there must have been something 7 Portfolio investment in Asian DCs jumped from US$ 8.3 billion in 1992 to US$
16
specific that triggered the "tequila" crisis.
It is by now widely accepted that internal factors played a prominent role in
causing the crisis of 1994/95, which falls into the category of failed attempts at
exchange-rate-based stabilization.^ The reversal of capital flows was related to
rising concerns about the sustainability of large current account deficits. Real
exchange-rate appreciation impaired the international competitiveness of Mexican
industry.9 Capital inflows had been used mainly to finance a private consumption
boom, i.e., they had replaced domestic savings rather than supporting sustainable
economic growth. Hence, real exchange-rate appreciation was in conflict with
economic fundamentals.
The government's attempt to stabilize the nominal exchange rate was not
credible, even though Mexico implemented an impressive fiscal consolidation
program. Nominal devaluation was kept low while inflation inertia was quite
substantial. Policy inconsistency can be traced back to 1990, when the rate of the
crawl was lowered while monetary policy became more expansionary and the
labor market remained regulated. In early 1994, the Mexican peso was
considered to be overvalued by 20-35 per cent. Rumors were that the government
would have to revise its exchange-rate policy sooner or later. Such rumors tend to
27.5 and 36.6 billion, respectively.
For detailed assessments, see, e.g., Fischer and Schnatz (1996) as well as Langhammer and Schweickert (1995); see also IMF (1997b: Box I).
In addition, political uncertainty mounted in Mexico in 1994 as a result of political assassinations, social unrest and regional uprising.
17
be self-fulfilling since investors withdrawing their funds in anticipation of depreciation add to pressure on the local currency. The speculative attack occurred in December 1994, and the peso lost about half its value within a few weeks.
2. The East Asian Crisis
Similar to the Mexican peso in 1994/95, various East Asian currencies plummeted in 1997/98. East Asian governments, too, had adopted a fixed or quasi-fixed exchange-rate regime. They were forced to give up this regime, although economic fundamentals seemed to be consistent with fixed exchange rates until recently. Throughout the 1980s and the first half of the 1990s, East Asia was given credit for high economic growth, sustained macroeconomic stability, outstandingly high saving and investment rates, and favorable export performance. At first sight, the contention that DCs are the victims of panicing world capital markets appears to be more reasonable in the case of East Asia than in the case of Mexico.
On closer inspection, however, the East Asian crisis bears resemblance to previous crises in that government failure was the cause of overshooting market reactions.10 The risk of speculative attacks on East Asian currencies increased
when (trade-weighted) effective real exchange rates appreciated by about 10 per
10 The subsequent paragraphs draw on Diehl and Schwcickert (1998). Krugman
18
cent between early 1995 and mid-1997. An exogenous event, namely the strengthening of the anchor currency, the US-dollar, against the yen and European currencies, was underlying this development. Asian governments failed to respond by allowing for more exchange-rate flexibility. Rising current account deficits, and drastically reduced export growth rates in Malaysia and Thailand in 1996 fuelled market concerns about overvaluation. Current account deficits were financed largely by short-term foreign borrowing. Mounting short-term debt, which exceeded international reserves held by Indonesia, South Korea and Thailand in mid-1997, undermined the governments' credibility with regard to sustaining the fixed exchange-rate regime.
The outbreak of the crisis might have been postponed if governments had taken timely measures to correct external imbalances. It is rather unlikely, however, that such measures would have been sufficient to sustain economic growth and financial stability in East Asia in the longer run. Serious internal financial problems were ignored within and outside the region until recently. With hindsight, today's problem countries were prone to crisis mainly because of the fragility of domestic financial systems (Krugman 1998b).
Weak financial institutions extended credit without sound risk evaluation. Excessive lending at high risk took different forms in the afflicted countries. In Thailand, essentially unregulated finance companies borrowed short-term, often in US-dollars, for long-term onlending to speculative investors. In this way,
19
finance companies incited particularly booming real-estate investment, which proved to be a huge speculative bubble later on. In South Korea, public authorities directed banks to continue lending to industrial conglomerates for investment projects of dubious viability. The common feature is that the risk exposure of financial institutions was not controlled by effectively supervising banks and by enforcing prudential standards according to international best practice. To the contrary, financial institutions perceived their liabilities to be guaranteed implicitly by the government.
It may be tempting to blame local financial institutions for having caused the crisis by taking excessive risk, as well as foreign banks and investors for having supported the financing of an unsustainable boom. However, government failure is lying behind the institutional weaknesses and incentive problems that induced moral hazard of financial institutions. Implicit government guarantees encouraged risky lending until they had to be honored. The crisis deepened as soon as financial institutions realized that guarantees were not credible. It turned out that honoring guarantees would have been too costly for the government when asset prices started to decline and vacancy rates in the real-estate sector increased.
Consequently, the failure of some large investors, who saw their profit expectations frustrated, triggered a downward spiral. Financial intermediaries stopped lending and tried to collect their claims, thereby reinforcing the decline in asset prices. It was only then that East Asian currencies came under serious
20
pressure. Foreign banks refused to roll-over outstanding loans or demanded higher risk premia, which added to the calamity of local enterprises and intermediaries. The latter tried to hedge liabilities by purchasing foreign exchange at the spot market. As in previous crises, the expectation of depreciation proved to be self-fulfilling. The brakes that could have prevented the crisis had been removed long before, namely when the governments' failure in ensuring prudent financial intermediation induced an unsustainable boom.
V. SOUTH ASIA: RECENT EXPERIENCE AND CURRENT CHALLENGES
/. Openness, Capital Inflows, and Economic Performance
According to a survey on improvements in conditions for investment in the developing world (ERTI 1996), South Asian economies have become considerably more open since the mid-1980s. In 1987-1992, India and Pakistan were among the six DCs which "stood at the forefront with their high speed of opening". India remained on a "very fast track of opening" in 1993-1996, and was considered to be "moderately open" at the end of 1996. The degree of openness achieved by Bangladesh and Pakistan at that time was regarded to be somewhat higher than that of India. Among South Asian economies, Sri Lanka ranked highest with regard to the degree of openness ("quite open"), although the speed of opening in 1993-1996 was "somewhat lower" in Sri Lanka (and in Bangladesh).
21
More welcoming attitudes towards FDI were part of "the broadly based liberalization of South-Asian economies" (UNIDO 1996: 30). Major policy changes were initiated in Sri Lanka in the late 1970s. Bangladesh and Pakistan represent intermediate cases with regard to the timing of reforms in South Asia. India was a latecomer to reform; some adjustment measures were launched in the mid-1980s, but major reforms only started in 1991.
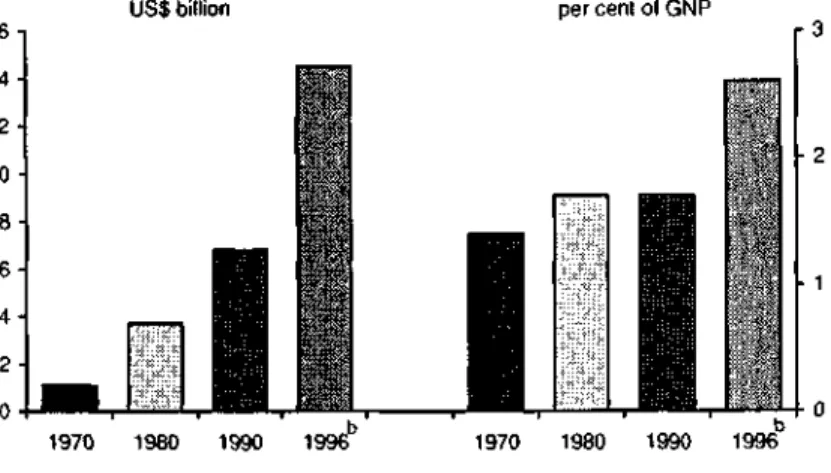
The process of economic opening was associated with a closer integration of South Asia into the international division of labor, and with improved attractiveness to foreign capital. The ratio of South Asian exports to GNP increased from 5.4 per cent in 1970 to 10.5 and 13.6 per cent in 1990 and 1996, respectively (World Bank 1997a). The ratio of (net) FDI inflows to South Asian exports quadrupled from 0.8 per cent in 1980 to 3.4 per cent in 1996. Net resource inflows (excluding grants) increased sixfold between 1970 and 1990, and further doubled until 1996 (Figure 5). Relative to South Asia's GNP, net resource inflows reached 2.6 per cent in 1996.
Net resource flows to the four major South Asian economies seem to be related to the timing of economic liberalization. Comparing net resource inflows in 1970 with average annual inflows in 1994/95, the increase was most pronounced in Sri Lanka, i.e., the frontrunner in reform (World Bank 1997a). Moreover, Sri Lanka reported the highest ratio of net resource inflows to GNP in 1980 and 1990 (6.6 and 4.5 per cent, respectively). Bangladesh, which was the next reformer (in
22
1983-1986), ranked second with 5.2 and 4.2 per cent, respectively. By contrast,
net resource inflows stagnated at about 1-1.5 per cent of GNP in India until 1990;
this ratio increased to 2.5 per cent in 1994, i.e., exactly when economic reforms
gathered momentum in India.1'
Figure 5 — Net Resource Flows to South Asiaa, 1970-1996
per cent of GNP 16 14- 121 0 8 6 4 2 -0 • US$ billion
H
1970 19801
JBLJ
1990 1996b 1970 1980 1990 1996"aSum of net flows of long-term debt (excl. IMF), net FDI, and portfolio equity flows; i.e.,
excluding grants. — ^Preliminary.
Source: World Bank (1997a).
FDI data provide further evidence for the link between economic liberalization
and attractiveness to foreign capital. Traditionally, South Asia was a minor host
of FDI (UNIDO 1996: 29). The region enhanced its attractiveness to FDI when
1' Net resource flows to India fell from US$ 7.3 billion in 1994 to US$ 2.7 billion in
1995, however; debt flows turned negative and portfolio equity flows declined, whereas FDI flows doubled in 1995 (World Bank 1997a).
23
major countries opened their economies. Average annual FDI inflows in 1987-1991 were twice as high as in 1980-1986 (Table 2). FDI inflows increased steadily from US$ 0.5 billion in 1991 to US$ 2.5 billion in 1995, which was mainly because of rising FDI flows to reforming India.
Table 2 — FDI Flows to South Asiaa, 1980-1995
1980-86b 1987-9lb 1992.95b US$ million 190 422 1296 thereof (percent): Bangladesh 0.2 0.5 0.6 India 37.0 40.6 53.9
aSum of Bangladesh, India, Pakistan and Sri Lanka. — bAnnua
Pakistan 41.7 48.6 35.1 average. Sri Lanka 21.2 10.3 10.4
Source: IMF (b); for India: World Bank Data Base (1980-1994); ADB (1997: Table A 17).
Openness and improved attractiveness to foreign capital, especially FDI, seem to have helped better economic performance in South Asia. In the 1970s, when all major economies were fairly closed, the region failed in narrowing the gap in per-capita income between South Asia and more advanced economies; the gap rather widened since South Asia reported slow growth of per-capita GDP of 1.3 per cent per annum (ADB 1989: Table A2). By contrast, the region achieved a higher growth of per-capita GDP than industrial countries in 1985-1995 (2.9 versus 1.9 per cent; Figure 4). On the level of individual South Asian economies, too, openness seems to have supported economic development:
24
considered to be more open than India (ERTI 1996). Nevertheless, economic reforms went along with higher growth of per-capita GDP.I2 Economic
reforms supported a stronger world-market orientation of Bangladesh.13
Favorable export performance was attributable to soaring exports of clothing in the first place. The country's clothing industry benefited greatly from relocation of production from economies like South Korea and Hong Kong. Especially Korean companies transfered managerial and technical know-how to Bangladesh. FDI data tend to understate the engagement of foreign companies in the manufacturing sector of Bangladesh, since foreign involvement in the clothing industry is frequently of a non-equity type such as subcontracting (Nunnenkamp and Gundlach 1995).
India's share in FDI flows to South Asia in 1980-1986 was less than half its
share in the region's GDP and population (Table 2). India's FDI share increased significantly exactly when economic liberalization gathered momentum. At the same time, the ratio of exports to GDP that had remained stable at about 6-7 per cent throughout the 1980s increased to 10.6 per cent in 1993/94.l4
Per-capita income growth amounted to 4.2 per cent per annum in 1992-1997, compared with 2.8 per cent in 1987-1991 (ADB 1997).
12 Per-capita income increased by 2.6 per cent, on average, in 1992-1997, compared
with 1.7 per cent in 1980-1986 (ADB 1989; 1997).
13 The ratio of exports to GDP more than doubled from 5.8 per cent, on average, in
1980-1986 to 12.7 per cent in 1992-1997 (IMF b).
25
Pakistan is an exception in that openness was not associated with improved
economic performance. This country had been the most important host of FDI within South Asia throughout the 1980s (Table 2). Absolutely increasing FDI flows in the 1990s notwithstanding, Pakistan's FDI share declined to 35 per cent in 1992-1995. At the same time, per-capita income growth declined from about 3 per cent in 1980-1991 to slightly less than 2 per cent in 1992-1997. Pakistan represented the taillight among major South Asian economies in terms of catching up with industrial countries (Nunnenkamp 1998c). As it seems, FDI in Pakistan contributed less to world-market orientation than elsewhere in South Asia. Pakistan clearly performed poorest among the four economies under consideration in terms of gaining world-export shares in 1980-1996 (IMFb).
Sri Lanka was most successful in catching up with industrial countries in
1980-1995 (Nunnenkamp 1998c). This country was also most successful in attracting FDI. FDI inflows were exceptionally high if accumulated inflows in 1980-1995 are related to population in 1995.15 Sri Lanka's reduced share of
about 10 per cent in FDI flows to South Asia since 1987 (Table 2) was still more than three times as large as Sri Lanka's share in South Asia's GDP. Yet, Sri Lanka could possibly have achieved greater gains from openness if internal
15 In per-capita terms, FDI inflows into Sri Lanka amounted to US$ 57; Pakistan
26
political conflict had not impaired its attractiveness to foreign capital. Political uncertainty seems to be a major reason for the rather unstable pattern of FDI inflows and economic growth.16
2. The Risk Involved
All in all, South Asia seems to have benefited from economic liberalization and greater openness towards international capital markets in recent years. However, as argued in section III, openness involves the risk of being affected by adverse capital-market developments. Current concerns are that financial turbulence in East Asia may spread beyond the countries afflicted so far. Contagion may affect South Asia in two ways. First, the East Asian crisis may induce foreign investors to reconsider country risk in all emerging markets. This may cause a general shift from generous to restrictive investment behavior in DCs; foreign investors would then retreat into the few remaining "safe havens". Second, South Asia's access to foreign capital may deteriorate if prolonged recession in East Asian problem countries leads China to renege on earlier commitments not to devalue the renminbi. In the case of a major devaluation in China, it would become more difficult for South Asian suppliers to penetrate markets in which China is a major competitor. Consequently, foreign investors would have weaker incentives to engage in export-oriented production in South Asia.
16 FDI inflows were at a low ebb in the mid-1980s, in 1989, and in 1995 (IMF b). Per-capita income growth declined from 3.5 per cent, on average, in 1980-1986 to
27
A thorough discussion of alternative scenarios concerning East Asia's future economic development and possible reactions of foreign investors, as well as a detailed account of the various factors shaping country risk in South Asia would be required in order to evaluate the significance of such fears. Section IV suggests that financial market conditions in South Asian economies would deserve particular attention in this context. This task is beyond the scope of this paper. In the remainder of this section, I discuss just two factors which, as previous crises reveal, are related to the issue of sustainability of capital inflows: the structure of external financing and vulnerability to a reversal of short-term capital flows.
An important caveat has to be kept in mind when interpreting the data presented in Table 3. Figures for individual South Asian economies refer to 1995. Hence, it is almost impossible to assess the present risk concerning the sustainability of external financing.1? Yet, Table 3 offers some interesting insights. First, FDI
contributed significantly less to net resource flows to South Asia than to net resource flows to all DCs and East Asian DCs. This suggests that there is still substantial scope for South Asia to improve the sustainability of external financing, considering that FDI has typically been the most stable item of external financing when capital-market conditions were unfavorable. Second, South Asia The structure of external financing may change significantly every other year. For example, FDI accounted only for 8 per cent of India's net resource inflows in 1994; the share of portfolio equity flows and long-term debt amounted to 60 and 25 per cent, respectively, at that time.
28
as a whole compared favorably with East Asia and all DCs as concerns the significance of short-term debt stocks. International reserves would decline by less than 30 per cent, compared with 70 per cent for all DCs, if the roll-over of short-term debt were to come to an abrupt and complete stop.
Third, Table 3 points to considerable differences between major South Asian economies in terms of external financing risk. The situation appears to be most critical in Pakistan. Short-term debt stocks exceeded international reserves, revealing Pakistan's high vulnerability to a reversal of foreign capital flows. Moreover, FDI and grants accounted for less than a quarter of net resource flows to Pakistan in 1995.
Table 3 —South Asia: Structure of External Financing and Significance of Short-term Debt, 1995 South Asiaa Bangladesh India Pakistan Sri Lanka memorandum: All DCsa East Asiaa FDI 15.3 0.2 39.6 16.3 10.0 38.5 52.6 portfolio equity flows per cent of net
31.8 3.6 46.2 29.0 9.7 16.1 11.1 long-term debt resource flows 38.2 21.3 -2.8 47.2 52.8 34.5 33.9 grants 14.7 74.8 16.9 7.5 27.6 11.0 2.4 Structure of external financing according to preliminary figures of 1996.
short-term debt stock in per cent of international reserves 29.3 8.7 22.1 128.0 25.6 70.2 48.4
29
VI. SUMMARY AND POLICY CONCLUSIONS
It is beyond serious doubt that international capital markets tend to overshoot once profit expectations in emerging markets turn negative. Sudden shifts from enthusiasm to panic, associated with the herding behavior of foreign investors, repeatedly prevented a "soft landing" and exacerbated the social cost of economic and financial tension in DCs. However, overshooting is a phenomenon prevailing not only in international capital markets, but also in commenting upon acute crises. Some politicians, like Malaysia's Prime Minister Mahathir, are blaming the messenger of bad news. Ignoring that international capital markets are reacting to changes in country risk, rather than being the cause of financial distress and currency crises, may have tremendous costs: "Return to normalcy may be delayed for a long time if leaders start looking for villains instead of solutions" (Krugman
1997: 34).
Some economists, too, have commented upon financial crises as if international capital markets are doing DCs nothing good. The evidence presented above is in strong conflict with the contention that openness of DCs towards international capital markets is exclusively in Wall Street's interest. Rather, open DCs have better opportunities than closed DCs to catch up economically with industrial countries. The recent experience of South Asia fits into this picture. It follows that Wade and Veneroso's (1998) suggestion to close the capital account, in order to avoid being at the mercy of volatile capital markets, amounts to shooting in
30 one's own feet:
- The opportunity costs of closing the capital account may be large even for the high-saving East Asian economies afflicted by the current crisis. Especially capital transfers in the form of FDI provide benefits in terms of managerial know-how, easier access to foreign markets and access to internationally available technologies, i.e., factors that help overcoming the crisis and resuming the process of catching up. Moreover, acquisitions by foreign investors limit the decline in asset prices. This implies that "the mere potential for FDI may act as a stabilizer against the risk of domestic financial panics" (Krugman 1998a: 9).
- DCs with rather low domestic saving rates are likely to suffer particularly high opportunity costs when closing the capital account. In contrast to various East Asian economies whose domestic savings accounted for about 35 per cent of GNP in 1996, South Asia is in greater need to supplement domestic savings by foreign capital inflows. In 1996, domestic saving rates were in the range of 12-16 per cent in Bangladesh, Pakistan and Sri Lanka; among major South Asian countries, only India reported a substantially higher saving rate (27 per cent) (ADB 1997: Table A7).
For DCs which do not want to forgo the benefits of capital inflows, the challenge is to reduce the risk of being affected by volatility in international capital markets. Recent crises offer some lessons in this respect (see also Diehl
31
and Schweickert 1998). First, DCs can prevent speculative attacks on their currencies by adopting a flexible exchange-rate regime and, thereby, denying speculators a fixed target. Second, this task is more demanding for DCs using the exchange rate as a nominal anchor for internal stabilization purposes. International capital markets may question the credibility of the government's commitment to a particular exchange rate for various reasons. Third, it follows that DCs should avoid repeating the policy failures that caused previous crises, rather than blaming international capital markets for internal economic and financial problems.
Credibility must be ensured on several fronts. Speculative attacks are most likely if monetary and fiscal policy is inconsistent with a fixed exchange-rate regime. However, it is not sufficient to avoid obvious macroeconomic inconsistencies. International capital markets may also turn their back on DCs, if rising real interest rates, high unemployment and low economic growth feed expectations that the government will change course and devalue in order to resolve internal economic problems.
Furthermore, the sustainability of external financing is at risk as long as major institutional weaknesses persist and domestic financial markets remain essentially unregulated. Financial institutions must be supervised effectively, prudential standards should be in line with international best practice and must be enforced, and governments must not create expectations that private sector liabilities are
32
guaranteed. Effective regulation of domestic financial markets is essential particularly in the early phases of financial liberalization.
Finally, the structure of external financing matters for reducing the risk of a sudden reversal of capital flows. In order to avoid excessive reliance on short-term financing and improve the management of foreign debt, lenders and borrowers need timely and comprehensive information on outstanding liabilities. This calls for improved data collection and data dissemination, both domestically and internationally. Among the different sources of capital inflows, FDI has typically proven to be the least volatile item. Hence, DCs should aim at a high share of FDI in overall external financing. The stabilizing properties of FDI help DCs in the midst of financial turbulence to limit the depth of the crisis. For other DCs, a strong reliance on FDI reduces the risk of contagion. All DCs attracting FDI have better chances to catch up economically with advanced economies since FDI provides for more than just capital.
33
REFERENCES
ADB (Asian Development Bank) (1989). Asian Development Outlook 1989. Manila.
— (1997). Asian Development Outlook 1997 and 1998. Oxford.
Calvo, G.A., L. Leiderman, and CM. Reinhart (1992). Capital Inflows and Real Exchange Rate Appreciation in Latin America: The Role of External Factors. IMF Working Paper 92/62. International Monetary Fund, Washington, D.C.
Diehl, M., and R. Schweickert (1998). Currency Crises: Is Asia Different? Kiel Discussion Papers 309. Institute of World Economics, Kiel.
ERTI (European Round Table of Industrialists) (1996). Investment in the Developing World: New Openings and Challenges for European Industry. Brussels.
Feldstein, M. (1994). Tax Policy and International Capital Flows. Bernhard-Harms-Lectures 16. Institute of World Economics, Kiel.
Feldstein, M., and C. Horioka (1980). Domestic Saving and International Capital Flows. Economic Journal 90: 314-329.
Fischer, B., and B. Schnatz (1996). Stabilitatspolitische Probleme bei der Integration in die internationalen Finanzmarkte: Mexikos Weg in die Peso-Krise. In H.-B. Schafer (ed.), Die Entwicklungsldnder im Zeitalter der
Globalisierung. Schriften des Vereins fur Socialpolitik 245. Berlin
(Duncker & Humblot): 13-39.
Gundlach, E. (1997). Openness and Economic Growth in Developing Countries.
Weltwirtschaftliches Archiv 133: 479-496.
Gundlach E., and P. Nunnenkamp (1996). Some Consequences of Globalization for Developing Countries. Kiel Working Papers 753. Institute of World Economics, Kiel.
IMF (International Monetary Fund) (a). Balance of Payments Statistics
Yearbook. Washington, D.C, various issues.
— (b). International Financial Statistics. Washington, D.C, various issues. — (1997a). International Capital Markets: Developments, Prospects, and Key
34
— (1997b). World Economic Outlook: Interim Assessment. Washington, D.C., December.
Krugman, P. (1997). Latin Lessons for Asia. Far Eastern Economic Review. September 25: 34.
— (1998a). Fire-sale FDI. Massachusetts Institute of Technology, Cambridge, Mass., Internet version.
— (1998b). What Happened to Asia? Massachusetts Institute of Technology, Cambridge, Mass., Internet version.
Langhammer, R.J., and R. Schweickert (1995). The Mexican Reform Process: Improving Long-Run Perspectives and Mastering Short-Run Turbulences. Kiel Discussion Papers 255. Institute of World Economics, Kiel.
Mahathir, B.M. (1997). Asian Economies: Challenges and Opportunities. Speech at the Annual Seminar of the World Bank. Hong Kong, September 20, Internet version.
Montiel, P.J. (1994). Capital Mobility in Developing Countries: Some Measurement Issues and Empirical Estimates. World Bank Economic
Review 8 (3): 311-350.
Nunnenkamp, P. (1997). Foreign Direct Investment in Latin America in the Era of Globalized Production. Transnational Corporations 6 (1): 51-81.
— (1998a). Dealing with the Asian Crisis: IMF Conditionality and Implications in Asia and Beyond. Intereconomics (forthcoming).
— (1998b). Ursachen und Konsequenzen der Asien-Krise. Wirtschaftsdienst (forthcoming).
— (1998c). Verlierer oder Gewinner? Entwicklungslander im Zeitalter der Globalisierung. Institute of World Economics, Kiel, mimeo.
Nunnenkamp, P., and E. Gundlach (1995). Regional Trends: Development Issues and Priorities. Institute of World Economics, Kiel, mimeo.
Quinlan, J. (1998). Global Capital Flows to Emerging Markets: How Asia Has
Fallen. New York, February, Internet version.
Sachs, J.D., and A. Wamer (1995). Economic Convergence and Economic Policies. NBER Working Papers 5039, National Bureau of Economic Research, Cambridge, Mass.
35
UNIDO (1996). Industrial Development: Global Report 1996. Oxford.
Wade, R., and F. Veneroso (1998). The Asian Financial Crisis: The
Unrecognized Risk of the IMF's Asia Package. New York, Internet version.
World Bank (1997a). Global Development Finance. Washington, D.C. — (1997b). World Development Report. Oxford.