UNIVERSITY OF CALIFORNIA
Santa Barbara
Overhauser Dynamic Nuclear Polarization to Study Hydration Dynamics
A Dissertation submitted in partial satisfaction of the requirements for the degree Doctor of Philosophy
in Physics
by
Brandon Dean Armstrong
Committee in charge: Professor Mark Sherwin (co-chair)
Professor Songi Han (co-chair) Professor Andrew Cleland
Professor Philip Pincus Professor Frederick Dahlquist
The dissertation of Brandon Dean Armstrong is approved. _____________________________________________ Songi Han _____________________________________________ Andrew Cleland _____________________________________________ Philip Pincus _____________________________________________ Frederick Dahlquist _____________________________________________ Mark Sherwin, Committee Co-Chair
iii
Acknowledgments
I thank Songi Han for being the driving force behind the work presented here. She is never short of ideas yet she gave me the independence to pursue my own scientific interests. Her positive attitude and enthusiasm for both the small and big successes made my graduate experience more enjoyable and rewarding.
The work presented here is also the work of many collaborators. I thank all my co-authors for their contributions and valuable insights. I especially thank Elliot Brown for his design of the microwave amplifier in chapter three and Silvia Cavegnero for providing samples and expertise for the work in chapter 4. I thank Mark Sherwin, Susumu Takahashi, Louis Claude Brunel, and Johan van Tol, who volunteered much of their time to help me understand and design the quasi-optical bridge of Chapter Five. Bruce Dunson, Terry Hart, Mike Johnson, and Richard Bock built much of the equipment used in these experiments and also contributed to their design. I thank all members of the Han group from 2005 to 2010 for many helpful discussions. I thank Colin Shepherd, Matt Shepard, Greg Dyer, Joe Paul, Charlie Wickersham, Ken Shen, and Gang Chen, with whom I spent many nights working on homework assignments. I thank Beth Wynstra for her wonderful support. I also thank my committee for taking time to critique my advancement exam and read this thesis. I thank my mom and dad who taught me to always work hard. By encouraging me to be curious and to try and solve problems myself, they laid the foundation for my pursuit of physics. Thank you for all your love and support. This dissertation is as much a reflection of your hard work as it is mine.
iv
VITA of Brandon Dean Armstrong May 2010
EDUCATION
B.S. in Applied Mathematics, University of Northern Illinois, May 2004 B.S.in Physics, University of Northern Illinois, May 2004
Doctor of Philosophy in Physics, University of California, Santa Barbara, June 2010 (expected)
SCHOLARLY PRESENTATIONS
Invited Speaker: Magnetic Resonance Gordon-Kenan Research Seminar, University of New England (June 2009). ―Water Dynamics of Apomyoglobin Folding using Dynamic Nuclear Polarization.‖
Seminar Speaker: Chemistry Seminar, Massachusetts Institute of Technology (2008). ―Dynamic Nuclear Polarization to Study Local Water Dynamics.‖Guest of Robert Griffin.
Seminar Speaker: National High Magnetic Field Laboratory, Tallahassee, FL. (2007) ―DNP as a Tool for Unique NMR Contrast.‖ Guest of Johan van Tol.
AWARDS AND RECOGNITION
Institute for Quantum and Complex Dynamics Travel Award: UC — Santa Barbara (2009).
Materials Research Laboratory Travel Fellowship: UC — Santa Barbara (2008) Experimental Nuclear Magnetic Resonance Conference Travel Award (2007) Dean‘s Award: Northern Illinois University (2003)
Nominated by department for campus award
University Scholar Award: Northern Illinois University (2001) Full tuition plus room and board scholarship for two years
v
PUBLICATIONS
B.D. Armstrong, J. Choi, C. J. López, D. Wesener, W. L. Hubbell, S. Cavagnero, and S. Han, ―Site–Specific Hydration Dynamics in Native, Molten Globular and Unfolded Apomyoglobin,‖ in preparation
B.D. Armstrong, D. T. Edwards, R. J. Wylde, S. A. Walker, and S. Han, ―A 200
GHz dynamic nuclear polarization spectrometer,‖ Phys. Chem. Chem. Phys. doi: 10.1039/c002290j
S. Garcia, J. H. Walton, B.D. Armstrong, S. Han, and M. J. McCarthy, ―L-band
Overhauser dynamic nuclear polarization,‖ J. Magn. Reson. 203 (2010) 138-143
B.D. Armstrong, P. Soto, J-E. Shea, and S. Han, ―Overhauser dynamic nuclear polarization and molecular dynamics simulations using pyrroline and piperidine ring nitroxide radicals,‖ J. Magn. Reson. 200(2009) 137-141
B.D. Armstrong, and S. Han, ―Overhauser Dynamic Nuclear Polarization to Study
Local Water Dynamics,‖ J. Am. Chem. Soc. 131 (2009) 4641-4647 E.R. McCarney, B.D. Armstrong, R. Kausik, and S. Han, ―Dynamic Nuclear
Polarization Enhanced Nuclear Magnetic Resonance and Electron Spin Resonance Studies of Hydration and Local Water Dynamics in Micelle and Vesicle Assemblies,‖ Langmuir 24 (2008) 10062-10072.
S. Han, E.R. McCarney, and B.D. Armstrong, ―Dynamic Nuclear Polarization
Studies of Local Water Dynamics at 9.8 GHz,‖ Appl. Magn. Reson. 34 (2008) 439-451.
B.D. Armstrong, M.D. Lingwood, E.R. McCarney, E.R. Brown, P. Blümler, and S. Han, ―Portable X-band system for solution state dynamic nuclear polarization,‖
J. Magn. Reson. 191 (2008) 273-281.
S. Han, E.R. McCarney, B.D. Armstrong, and M.D. Lingwood, ―Dynamic Nuclear
Polarization-Enhanced Magnetic Resonance Analysis at X-Band Using Amplified 1H Water Signal‖ (2008), In S.L. Codd and J. D. Seymour (Eds.),
Magnetic Resonance Microscopy: Spatially Resolved NMR Techniques and Applications (pp. 161-176). Weinheim, Germany: Wiley-VCH
B.D. Armstrong, R. Kausik, and S. Han, ―Local Hydration Dynamics in Soft Matter
by Dynamic Nuclear Polarization of 1H-water,‖ Magnetic Resonance in Porous Media: Proceedings of the 9th International Bologna Conference on Magnetic Resonance in Porous Media, AIP Conf. Proc., 1081 (2008) 14-17.
vi
B.D. Armstrong, and S. Han, ―A New Model for Overhauser-Enhanced Nuclear
Magnetic Resonance Using Nitroxide Radicals,‖ J. Chem. Phys. 127 (2007) 104508-10.
E.R. McCarney, B.D. Armstrong, M.D. Lingwood, and S. Han, ―Hyperpolarized Water as an Authentic Magnetic Resonance Imaging Contrast Agent,‖ Proc. Nat. Acad. Sci. USA. 104 (2007) 1754-1759.
B. Dabrowski, O. Chmaissem, P.W. Klamut, S. Kolesnik, M. Maxwell, J. Mais, Y. Ito, B.D. Armstrong, J.D. Jorgensen, and S. Short, ―Reduced Ferromagnetic
Transition Temperatures in SrRu1-vO3 Perovskites from Ru-site Vacancies,‖
vii
ABSTRACT
Overhauser Dynamic Nuclear Polarization to Study Hydration Dynamics By
Brandon Dean Armstrong
Hydrophobic and hydrophilic interactions of water with biomolecules are known to mediate important processes such as protein folding, protein aggregation, and the formation of lipid bilayers and vesicles. Yet the exact role water plays in many biological processes is complex, spanning a large range of length and timescales, and is not well understood in quantitative detail despite extensive interest and decades of study. Experimentally, water – surface interactions are difficult to study as water lubricating a protein surface or moving across a membrane does not have a unique spectroscopic signature. While nuclear magnetic resonance (NMR) is an ideal
technique for studying biological systems since it is non-invasive and uses low energy radio frequencies to irradiate the sample, it cannot differentiate between bulk and surface water. To overcome this obstacle, I advanced dynamic nuclear polarization (DNP) as a technique to study water interactions with biomolecules. I present here my work to develop a new theoretical model to quantify DNP experiments, apply DNP to experimentally measure the timescale of water interactions in an intermediate state of a protein, and in designing and building hardware to improve DNP performance and extend these techniques to large magnetic fields.
viii
TABLE OF CONTENTS
I. Overhauser Dynamic Nuclear Polarization
A. Motivation………...1
B. Theory of the Ovehauser Effect ...8
C. Modeling the Overhauser Effect………..15
D. Spin Labeled Electron Paramagnetic Resonance……….24
II. The Ovehauser Effect with Nitroxde Radicals A. Introduction ... .28
B. A new model describing the saturation factor ... ..30
C. Results and Discussion………..35
D. Conclusion………47
E. Materials and Methods………..48
III. Portable DNP and Improved Hardware A. Introduction………..51
B. Results and Discussion………..52
C. Conclusion……….61
D. Materials and Methods………..62
IV. Site Specific Hydration Dynamics of Apomyoglobin A. Introduction….………..66
B. Results and Discussion………..69
ix
D. Materials and Methods………..82
V. A 200 GHz Quasi-Optical DNP and EPR Spectrometer A. Introduction……….….88
B. Experimental……….91
C. Results and Discussion………..98
D. Conclusion………..105
VI. Conclusion………...107
1
I. Overhauser Dynamic Nuclear Polarization
A. MotivationNuclear magnetic resonance (NMR) is a powerful spectroscopic technique with applications ranging from reaction monitoring [1, 2], protein structure determination [3], medical imaging [4], and even quantum computing applications [5]. As the NMR experiment is both non-invasive and uses low energy radio frequency (RF) irradiation to excite the nuclear spins, it is an ideal tool for the study of biological samples and processes at ambient temperatures. However, NMR suffers from an inherit lack of sensitivity due to the small thermal polarization of nuclear spins which follow Boltzman statistics. For example, the world‘s largest NMR spectrometer currently operates at 23.5 T. At room temperature the 1H nuclear spin polarization at this field is still only 0.008%. Sensitivity becomes even more problematic with other nuclei which are less abundant and have smaller gyromagnetic ratios. Additionally, spectral overlap of the signal from like nuclei can complicate the spectra requiring two and three dimensional techniques to separate the peaks. The result is that some
experiments can be prohibitively time consuming requiring days or weeks of signal averaging, and in some cases cannot be performed at all due to lack of sensitivity. It is a testament to the wealth of information available from an NMR experiment that it is one of the most widely used spectroscopic techniques despite these shortcomings.
Of all the efforts put into improving the sensitivity of an NMR experiment, Dynamic Nuclear Polarization (DNP) offers the largest potential gain. DNP is the process by which an unpaired electron transfers its larger spin polarization to dipolar
2
or scalar (Fermi-contact) coupled nuclei, thereby enhancing the NMR signal by 2-3 orders of magnitude. The process was originally predicted in 1953 by Albert Overhauser for conduction electrons and nuclei in metals [6] and quickly verified experimentally by Carver and Slichter [7]. It was soon found that the effect was not confined just to metals but also to diamagnetic crystals and paramagnetic molecules in solution [8]. The e- spin polarization can be transferred to a coupled nuclear spin through several DNP mechanisms: the Overhauser Effect (OE) [6], the solid effect [9, 10], thermal mixing [10, 11], and the cross effect [12]. The OE is effective when the strength of the dipolar or scalar coupling is modulated by relative motion of the e- and nuclear spin. If the timescale of this motion is ≲ 1/𝜔𝑒, where 𝜔𝑒 is the e- Larmor frequency, then transitions involving mutual e- - nuclear spin flips will occur with a high probability, and the e- spin polarization can be transferred to the nuclei by irradiation of the e- resonance transition.
The other three DNP mechanisms occur in insulating solids where the dipolar or scalar coupling is essentially static or modulated very slowly. In this case, transitions involving mutual e- - nuclear spin flips are forbidden. In the solid effect, the width of the e- spin resonance is narrow compared to the nuclear Larmor frequency, 𝜔𝑛. Perturbation theory gives a small mixing of the energy levels such that high power irradiation at 𝜔 = 𝜔𝑒 ± 𝜔𝑛 can drive these ‗forbidden‘ transitions, thereby enhancing the NMR signal. Both thermal mixing and the cross effect can occur in systems where the width of the e- resonance is on the order of, or broader than 𝜔𝑛. In each case, the application of off-resonant irradiation of the electron resonance line induces mutual
3
spin flips of two e-spins separated in frequency by 𝜔𝑛, resulting in enhanced (positive
or negative) NMR signal. In the case of thermal mixing the e- spin resonance is homogenously broadened, while the cross effect describes the situation where the e
-spin resonance is inhomogenously broadened due to g or A anisotropy.
The overall focus of this dissertation is on using DNP to study the dynamics between an e- spin and nuclear spin, with a particular emphasis on hydration water surrounding biological molecules. As the OE is the only DNP mechanism that is effective in liquids, it forms the basis for most of the experiments presented in this work. Therefore, a detailed description will be given in the next two sections. We define hydration water as water molecules that have their translational, rotational, and hydrogen bonding dynamics perturbed by the presence of a surface. The interaction of water with hydrophobic and hydrophilic regions of biomolecules is known to play an important role to mediate processes such as protein folding, protein aggregation, and the formation and stabilization of lipid bilayers. However, as hydration water does not have a unique spectroscopic signature, there is a lack of experimental techniques capable of measuring the dynamics of water on the heterogeneous surface of a protein or macromolecular assembly with site-specificity. For example, both electron paramagnetic resonance (EPR) and femto-second fluorescence spectroscopy have been applied to study local water dynamics on the surface of proteins [13-16]. Both methods, however, indirectly measure local water dynamics and are sensitive not only to the local motion of water, but also to the local structure of the protein (e.g. alpha-helix or beta-sheet), complicating the interpretation of results.
4
In the Han group, we propose attaching a free radical (molecule with an unpaired
e-) with site specificity to biomolecules, and then use DNP to directly measure the 1H NMR signal enhancement of water. The dipolar interaction that causes the DNP effect is short range, with 80% of the relaxation occurring within 5 Å [17], so the 1H signal enhancement is heavily weighted to water close to the surface. As will be shown, the NMR signal enhancement from DNP is strongly dependent on the
distance of closest approach between the two spin bearing molecules, d, and the local diffusion of water. Thus, DNP can provide a measure of local water dynamics.
Several necessary steps were needed to achieve the goal of using DNP to study local water dynamics. First, the existing theory of the DNP parameter known as the saturation factor (to be defined shortly) for experiments using nitroxide free radicals (which have a nitrogen covalently bonded to an oxygen with an unpaired e-; see Fig. 1.2) as the source of unpaired electrons was inadequate to explain our experimental results. Nitroxide radicals will be discussed in more detail later, but they are a very important class of free radicals because they are stable, soluble in water, and are easy to covalently bind to biomolecules with site specificity. In chapter two, I show the shortcoming of the existing DNP theory. I then detail a modified description of the saturation factor and show experimental evidence to support the new model [18, 19].
In chapter three I detail our work on developing hardware for maximizing DNP signal enhancements. The original motivation for this work was to produce larger DNP enhancements for magnetic resonance imaging experiments. Our work in improving hardware resulted in nearly a factor of three improvement in our DNP
5
signal enhancements compared to a commercially available X-band (8 - 12 GHz) EPR bridge. Additionally, the setup was made portable by means of a tunable 9.5 – 10 GHz microwave cavity and a variable field Halbach magnet [20] allowing the necessary equipment to easily be taken to an imaging facility rather than having a dedicated instrument. However, for theoretical and practical reasons to be discussed, 0.35 T is a good choice of magnetic field to study local water dynamics with the OE, and our custom X-band amplifier has become a piece of standard equipment in our group‘s studies on hydration dynamics.
Armed with new theory and improved hardware, chapter four summarizes our work on applying this new technique to a sample of biological importance. Sperm whale apomyoglobin (apoMb) is widely studied in protein folding experiments because it has a stable intermediate that can be populated at low pH and salt
concentrations. Most importantly, the stable intermediate closely resembles a kinetic folding intermediate allowing a wide range of experimental techniques to be used to study what is normally a short lived state [21]. Though apoMb is widely studied, it is unknown if water is excluded from the hydrophobic core of the stable intermediate. This is an important question since protein folding models differ on whether the exclusion of water occurs after the initial collapse of a hydrophobic core or after the protein has found its native structure. In chapter four, our DNP results show strong evidence for a hydrated hydrophobic core in the intermediate state of apoMb. In addition to the work presented here, this new technique has been applied in our group
6
to study water diffusion across membranes [22, 23], inside coacervates [24], and to elucidate early forming species in the aggregation of tau protein [25].
While the experiments presented in chapters two through four were done at 0.35 T, most NMR experiments are done at much higher magnetic fields due to increased spin polarization and greater spectral resolution. Despite the wide range of samples that DNP experiments could be applied to at high magnetic fields (arbitrarily defined here as > 5 T), the technique has not been widely used, largely due to hardware difficulties. DNP requires resonant or near resonant irradiation of the electron Larmor frequency. Magnetic fields up to 16 T are commonly used in NMR experiments which would require a 450 GHz source for DNP experiments to be implemented. The problem is not just limited to the availability of high frequency sources, but other challenges must be overcome such as dielectric absorption by the sample, high microwave power needed to excite broad electron spin resonances, and difficulties building the necessary RF and microwave equipment into the bore of a
superconducting magnet without sacrificing spectral resolution. Recent technological developments in microwave technologies [26, 27] have renewed interest in high field DNP. The wider availability of hardware and increased interest has led to several commercial instruments, notably, a 9 T gyrotron-based system from Bruker Biospin for solid state magic angle spinning experiments (ssMAS) and a diode-based, 1.1 K dissolution DNP setup for liquid state spectroscopy from GE and Oxford. In the latter, the sample is cooled to 1.1 K during microwave irradiation in a 3.35 T magnet and then quickly dissolved and shuttled to a high resolution NMR magnet. The
7
former uses a gyrotron to produce high power (several watts) 250 GHz irradiation and over-moded waveguides to propagate the microwaves to the sample inside a ssMAS probe in a 9 T magnet. Both systems are expensive, require significant lab space, and do not incorporate the ability to detect the EPR signal of the sample which can also contain a wealth of information about electron-nuclei interactions. In chapter five we detail our work to bridge this cost—space—EPR gap with the development of a 7 T DNP and EPR spectrometer based on quasi-optical techniques with a low power, 200 GHz diode source. In this chapter we present our initial DNP and EPR results on a test sample at 4 K. Our experimental design allows for EPR and NMR detection in the same setup without changing the sample. Also, we show the benefit of using quasi-optical techniques for microwave propagation as the polarization of incident radiation can be changed to maximize DNP enhancements or isolate the small EPR signal from the large background.
As previously mentioned, all of the work at low field relies on the OE. As the goal of these experiments is to understand the dynamics of water on biological surfaces, an understanding of the theory is necessary. I therefore dedicate the next two sections to the theory of the OE and paramagnetic relaxation by dissolved solutes. I end this introductory chapter by giving a brief introduction to EPR with spin labeled
molecules because, as I show in chapter four, EPR and DNP can give complementary information and together paint a more complete picture of the dynamics of proteins.
8
B. Theory of the Overhauser Effect
The Hamiltonian for two coupled spins, I and S, in a magnetic field is given by Equation 1.1 [28]. Though the equation is general for any two spins, the focus in this dissertation is on the coupling between an unpaired electron spin, S, and nuclear spin¸
I, and this will be assumed throughout unless otherwise stated. 𝐻 = ℏ𝛾𝑠 S⋅H0 + ℏ𝛾𝐼 I⋅H0 + 𝐻𝑠 + 𝐻𝑑 (1.1a) 𝐻𝑠 =𝛾𝑠𝛾𝐼ℏ 28𝜋 3 𝜓 0 2 I⋅S (1.1b) 𝐻𝑑 = 𝛾𝑠𝛾𝐼ℏ2 I⋅S 𝑟3 − 3 I⋅r S⋅r 𝑟5 (1.1c)
The first two terms of Eq. 1.1a describe the Zeeman interaction of the spins in the applied magnetic field, H0. Hs is known as the scalar interaction, though in some
contexts it is referred to as the Fermi-contact term. The strength of the scalar interaction depends on the probability of the e- being at the position of the
nucleus, 𝜓(0) 2. In general, this is not known, making the scalar interaction difficult
to predict except in simple situations [29]. The final term, Hd, describes the dipolar
interaction between two magnetic moments where r is the distance between the two spins. The experiments described in this work are dominated by the dipolar
interaction so it is worth discussing this term in some detail. By evaluating the dot products in Eq. 1.1c, converting Ix, Iy, Sx, and Syto raising and lowering operators,
and writing r in spherical coordinates, (r, 𝜃, 𝜙), the effect of Hdis more easily
9 𝐻𝑑 =𝛾𝑠𝛾𝐼ℏ 2 𝑟3 𝐴 + 𝐵 + 𝐶 + 𝐷 + 𝐸 + 𝐹 (1.2a) 𝐴 = 𝐼𝑧𝑆𝑧(1 − 3 cos2𝜃) (1.2b) 𝐵 = −1 4 𝐼 +𝑆−+ 𝐼−𝑆+ (1 − 3 cos2𝜃) (1.2c) 𝐶 = −3 2 𝐼 +𝑆 𝑧 + 𝐼𝑧𝑆+ sin 𝜃 cos 𝜃𝑒−𝑖𝜙 (1.2d) 𝐷 = −3 2 𝐼 −𝑆
𝑧 + 𝐼𝑧𝑆− sin 𝜃 cos 𝜃𝑒𝑖𝜙 (1.2e)
𝐸 = −3 4𝐼 +𝑆+sin2𝜃𝑒−2𝑖𝜙 (1.2f) 𝐹 = −3 4𝐼 −𝑆−sin2𝜃𝑒2𝑖𝜙 (1.2g)
It is now clear that Hdcan cause mutual spin transitions. Let us assume, not only for
simplicity of the discussion, but also because it is appropriate for the OE experiments in this work, that spin Iis a 1H nuclear spin, ½. We also assume that the magnetic field is large enough that the energy of the Zeeman interaction is much greater than
Hs or Hdso they can be treated as a perturbation. We can then assume a four level
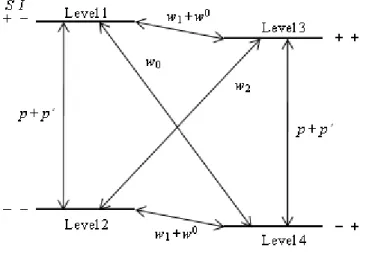
energy diagram as shown in Fig. 1.1. Term B in Eq. 1.2 is responsible for the zero quantum transition, w0. Terms C and D flip only the e- or 1H nucleus and are shown
as w1 and 𝑝′. Finally terms E and F represent the double quantum transition, w2,
where both spins flip in the same direction. It is important to note that the (I⋅r)(S⋅r) term in Eq. 1.1c is responsible for the double quantum transition. Therefore, if Hs is
the only important coupling term in the Hamiltonian then only the w0, w1, and 𝑝′
10
all possible. Determining these transitions rates is very important and will be
discussed in the next section. For now I will assume only that these transitions exist. Lastly, there are relaxation mechanisms of the electron and 1H nuclear spins that are not due to scalar or dipolar coupling, and these transition rates are denoted w0 = 1/T10
and p = 1/T1e, where T10 and T1e are the longitudinal relaxation times of the nucleus
and electron in the absence of any coupling between them. Also, the electron spin has much stronger relaxation mechanisms other than dipolar coupling to the nucleus so the assumption 𝑝 ≫ 𝑝′ will be made.
Figure 1.1. Four level energy diagram for two coupled spin ½‘s, appropriate for an electron and nucleus with a positive gyromagnetic ratio such as 1H.
Given these transition probabilities, we can write equations for the time rate of change of the population of each energy level by adding together the different
relaxation pathways in or out of that particular level. As an example, the equation for the population of level 1 (n1) is given in Eq. 1.3 with similar equations for the other
three energy levels. 𝑑𝑛1
𝑑𝑡 = − 𝑝 + 𝑤0+ 𝑤1 + 𝑤
0 𝑛
11
In an NMR experiment the net magnetization, ⟨𝐼𝑧⟩, is measured which is the total
number of spin up nuclei minus the number of spin down. ⟨𝐼𝑧⟩ ∝ 𝑛3+ 𝑛4− (𝑛1+ 𝑛2) (1.4)
Using Eq. 1.3 (and the equations for n2, n3, and n4,) and Eq. 1.4 we can write,
𝑑⟨𝐼𝑧⟩
𝑑𝑡 = − 𝑤0 + 2𝑤1+ 𝑤2 + 𝑤
0 ⟨𝐼
𝑧⟩ − 𝐼0 − 𝑤2− 𝑤0 ⟨𝑆𝑧⟩ − 𝑆0 (1.5)
where I0 and S0 are the nuclear and electron spin equilibrium magnetizations. This is
one of the famous Solomon equations for describing the magnetization of two dipolar coupled spin ½‘s [30]. There is of course a similar equation for the electron, but because the electron spin has other strong relaxation mechanisms not due to coupling with the nucleus we can ignore it. Using the relation 𝑆0 𝐼0 = 𝛾𝑠 𝛾𝐼, we can define the NMR signal enhancement, E = ⟨𝐼𝑧⟩/𝐼0, in the steady state by rearranging the terms in Eq. 1.5. ⟨𝐼𝑧⟩ 𝐼0 = 𝐸 = 1 − 𝜌𝑓𝑠 𝛾𝑆 𝛾𝐼 (1.6a) 𝜌 = 𝑤2− 𝑤0 𝑤0+ 2𝑤1+ 𝑤2 (1.6b) 𝑓 = 𝑤0+ 2𝑤1+ 𝑤2 𝑤0+ 2𝑤1+ 𝑤2 + 𝑤0 (1.6c) 𝑠 =𝑆0− ⟨𝑆𝑧⟩ 𝑆0 (1.6d)
In these equations 𝜌 is known as the coupling factor, f is the leakage factor and is the ratio of the dipolar relaxation rate to the total relaxation rate, and s is the saturation factor.
12
The most striking feature of Eq. 1.6a is the ratio 𝛾𝑆 /𝛾𝐼, which for an electron spin and 1H nuclear spin is ~ 660. It is therefore possible to achieve a large NMR signal enhancement by irradiating the electron spin resonance and driving ⟨𝑆𝑧⟩ away from its thermal equilibrium value and towards 0. Assuming the validity of the Bloch equations for the electron spin [31] and on-resonant irradiation of the EPR transition, the saturation factor can be written as function of the applied radiation power,
𝑠 = 𝛼𝑃
1 + 𝛼𝑃 (1.7)
where 𝛼 is a constant related to the electron spin relaxation times, T1e and T2e, as well
as the coil or cavity properties used to irradiate the sample [29]. To account for differences in the saturation factor due to different experimental setups or differences in applied power, a typical experiment consists of measuring the NMR signal
enhancement as a function of power. The results are then extrapolated to infinite power using Eq. 1.7 (where s→ 1) to measure the maximum possible enhancement, 𝐸max = 𝐸 𝑃 → ∞ .
An assumption in this discussion of the saturation factor is that the species
containing the unpaired electron has only a single resonance line. This is often not the case due to hyperfine coupling of the electron spin to a nucleus with non-zero spin. A widely used family of free radicals in DNP and EPR experiments is nitroxide radicals. An example of a nitroxide radical is shown in Fig. 1.2 along with its EPR spectrum. There is a hyperfine interaction between the unpaired electron and the spin = 1 14N nucleus, giving the 3-line EPR spectrum. A standard EPR spectrometer operates at X-band, so resonant cavities are typically employed to irradiate the sample. The use of a
13
cavity implies only a single line of the EPR spectrum can be irradiated due to the narrow bandwidth. Also, the nuclear spin polarization is very low, so the electron spin population is equally distributed among the three spin states of the 14N nucleus. This is easily seen by the nearly equal intensities of the EPR spectrum in Fig. 1.2.
Therefore, the saturation factor is usually modified by multiplying Eq. 1.7 by a factor of 1/n where n is the number of hyperfine lines. The maximum saturation factor for nitroxide radicals is then ⅓ instead of 1. This assumption will be shown to be
incorrect in Chapter 2 where a new saturation factor is derived for nitroxide radicals. Figure 1. 2. Chemical structure of the radical 4-Amino-Tempo and an X-band EPR spectrum taken in a TE102 resonant cavity. The B0 field is modulated at 100 kHz and slowly swept while the sample is continuously irradiated with microwaves, so the 1st derivative of the absorption signal is measured.
In many cases, the leakage factor can be easily determined. The denominator of Eq. 1.6c is just the sum of the different longitudinal relaxation rates, that is, 1 𝑇1 =
𝑤0+ 2𝑤1+ 𝑤2+ 𝑤0. Remembering that w0
is the relaxation rate in the absence of dipolar or scalar coupling we can rewrite Eq. 1.6c as
𝑓 = 1 − 𝑇1
14
For samples where a paramagnetic solute is being used to hyperpolarize the solvent, f
can be determined by measuring the longitudinal nuclear spin relaxation in the presence of the paramagnetic species (T1) and absence of the paramagnetic species
(T10). Thus, the leakage factor is a measure of how effectively the e- relaxes the nuclei
compared to other mechanisms. In the limit that all nuclear spin relaxation occurs via coupling to the electron spin, T1 << T10 and f approaches 1. The total relaxation rate
caused by the e- spins obviously depends on the concentration of electron spins. For a dilute concentration of electron spins compared to the nuclei, all dipolar relaxation rates are all linear in e- spin concentration. We can then write Eq. 1.6c as
𝑓 = 𝑘𝐶𝑇10
1 + 𝑘𝐶𝑇10 (1.9),
where k is known as the relaxivity constant and C is the unpaired e- concentration. The coupling factor is so named because it provides information on the type of interaction between the electron spin and nuclear spin. If the coupling is purely scalar, the double quantum transition does not exist, and 𝜌 is negative. If the coupling is purely dipolar, then w2 > w0 (this will be shown in the next section) and 𝜌 is positive.
Additionally, as Eq. 1.6b contains only transitions rates caused by coupling to the e-
spin, there is no concentration dependence in 𝜌. This makes 𝜌 the fundamental
parameter to determine from an Overhauser DNP experiment. The transition rates, w0,
w1, and w2, contain information on the type of coupling as well as the dynamics
modulating the coupling. It is therefore important to calculate these transition rates so that useful information can be extracted.
15
C. Modeling the Overhauser Effect
In the previous section, we showed that both s and f can approach one, and thus large NMR signal enhancements are possible if there is efficient cross relaxation. In this section we show under what conditions this is in fact true. We also now narrow the focus to the dipolar coupling between an electron of a paramagnetic solute and the nucleus of a solvent. In this situation, the dipolar Hamiltonian, Hd, is time dependent
due to the diffusion of molecules. This implies that I, S, and r, are all functions of time. Since diffusion is a random process, Hd is stationary, so the evolution from time
t to t′depends only on their difference, 𝜏. The transition probability between two energy levels from time dependent perturbation theory is then [32]
𝑤𝑚𝑛 = ⟨𝑚 𝐻 𝑒𝑑 𝑡 𝑛⟩⟨𝑛 𝐻𝑑 𝑡 + 𝜏 𝑚⟩ −𝑖𝜔𝑚𝑛𝜏𝑑𝜏 (1.10)
∞ −∞
where the bar represents a statistical average. Eq. 1.10 looks like a Fourier transform, and we can define a spectral density function, J(𝜔), and a correlation function, G(𝜏),
𝐽 𝜔 = 𝐺 𝜏 𝑒−𝑖𝜔𝜏 ∞ −∞ (1.11) where 𝐺 𝜏 = 𝐺 −𝜏 = ⟨𝑚 𝐻 (1.12). 𝑑 𝑡 𝑛⟩⟨𝑛 𝐻𝑑 𝑡 + 𝜏 𝑚⟩ The first equality of Eq. 1.12 is true because G(𝜏) is stationary. If the time dependence of r, 𝜃, 𝜙 in Eq. 1.2 is known, the transition rates can be calculated. However, in general an exact calculation of the transition rates is not possible as not only the diffusion of the two molecules needs to be modeled, but also the electrostatic
16
forces interacting between them. Fortunately, the field of paramagnetic relaxation enhancement (PRE) is an active community with applications ranging from aiding in protein structure determination to magnetic resonance imaging (MRI) contrast agents, so much theoretical and experimental work has been done [33-42]. Three relatively straight forward scenarios exist that have relatively simple solutions and apply to a wide range of samples: a translational Brownian diffusion model where the spins are centered on hard spheres with no forces acting between them (force, free hard sphere model; FFHS, also referred to as the translational model) [36, 38], a rotational model where the two spins form a bound complex so that r is a constant and Hd is modulated
by rotational motion [29, 32], and a model combining these two theories for samples that exhibit both types of relaxation [42]. In chapter two we show that the FFHS model approximates the nitroxide radical – 1H of water system fairly well. We therefore calculate 𝜌 and T1 using this model to show the behavior of the DNP signal
enhancement as a function of dynamics and magnetic field. We also compare these results to a simple rotational model to show how the two differ and how the different phases of motion may be separated.
The FFHS model is a simplified case of a more general treatment of paramagnetic relaxation developed by Hwang and Freed and remains a widely used model to describe dipolar relaxation in liquids mediated by translational diffusion. The
important parameter describing the dynamics between the two spin bearing molecules is the translational correlation time defined as
𝜏𝑡 =
𝑑2
𝐷𝐼+ 𝐷𝑆
17
where d is the distance of closest approach and DI and DS are the diffusion
coefficients of the spin bearing molecules. Eq. 1.13 is important for determining local hydration dynamics with the OE. If we can determine 𝜏𝑡 from a DNP experiment, we can gain knowledge of the local diffusion of water. The FFHS model also includeds the spin lattice and spin-spin relaxation times of the electron. If these times are long compared to 𝜏𝑡, which is the case for nitroxide radicals, they can be ignored and there is a single reduced spectral density function for all the dipolar transition rates [36],
𝑗 𝜔, 𝜏𝑡 = 1 + 5 2 8 𝜔𝜏𝑡 1 2+𝜔 𝜏𝑡 4 1 + 2𝜔𝜏𝑡 1 2+ 𝜔𝜏 𝑡 + 23 𝜔𝜏𝑡 3 2+ 16 81 𝜔𝜏𝑡 2+4 2 81 𝜔𝜏𝑡 5 2 + 𝜔𝜏𝑡 3 81 (1.14)
(Note: In reference [36], equation 2 is correct, but in equation 4 the 𝜔𝜏𝑡 2 term in
the denominator is incorrectly missing). The total 1H nuclear spin relaxation rate of water in this model is [43]
1 𝑇1 = 32𝜋𝑁𝐴 4.05 × 10⁵𝛾𝐼2𝛾𝑆2ℏ2𝑆 𝑆 + 1 𝐶 𝜏𝑡 𝑑3 𝑗 𝜔𝑆− 𝜔𝐼, 𝜏 + 3𝑗 𝜔𝐼 + 6𝑗(𝜔𝑆+ 𝜔𝐼) + 1 𝑇10 (1.15) where S is the electron spin (1/2 for a nitroxide radical), NA isAvogadro‘s number, C
is the molar concentration, and 𝜔𝑆 and 𝜔𝐼 are the electron and 1H angular Larmor frequencies.
The dominator of Eq. 1.6c is also the total relaxation rate, 𝑤0+ 2𝑤1+ 𝑤2+ 𝑤0.
The first term of Eq. 1.15 corresponds to the zero quantum transition rate, w0, the
18
involve simultaneous electron – 1H spin flips, and thus depend on 𝜔𝑆, while the single
quantum transition involves only a nuclear spin flip and therefore depends on 𝜔𝐼. Since 𝜔𝑆 ≫ 𝜔𝐼, the double quantum transition rate is about six times larger than the zero quantum transition rate. Thus upon irradiation of the electron spin resonance, the population of level 2 in Fig. 1.1 will become more populated than level 4 due to preferential relaxation through w2, resulting in an NMR signal that is inverted
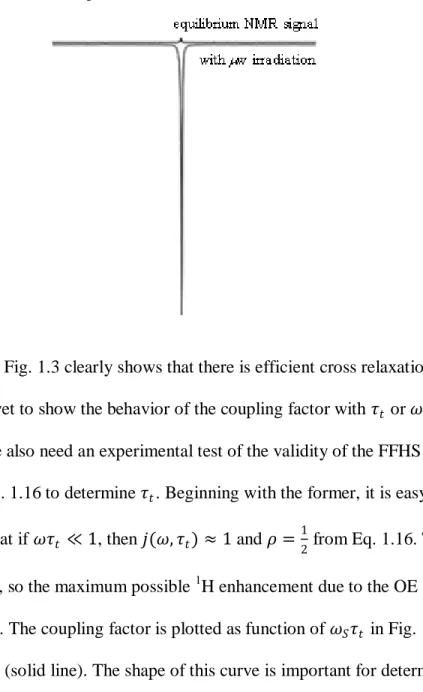
compared to thermal equilibrium. An example of this is shown in Fig. 1.3 where a -130 fold signal enhancement of the 1H nuclear spin of water was recorded at 0.348 T. We can also rewrite Eq. 1.6b in terms of the reduced spectral density function,
𝜌 = 5𝑗 𝜔𝑆, 𝜏𝑡
7𝑗 𝜔𝑆, 𝜏𝑡 + 3𝑗 𝜔𝐼, 𝜏𝑡 (1.16)
where we have made use of the assumption 𝜔𝑆± 𝜔𝐼 ≈ 𝜔𝑆. By determining 𝜌 in a DNP experiment, Eq. 1.16 can be used to calculate 𝜏𝑡. Eqs 1.16, 1.14, and 1.13 form
the foundation for using DNP to study hydration dynamics. By measuring the DNP signal enhancements, the leakage factor with Eq. 1.8, and determining the saturation factor with the model to be developed in chapter 2, 𝜌 and 𝜏𝑡 can be calculated. It is important to remember that the coupling factor can be found from Eq. 1.6a without invoking a dynamic model. Additionally, Eq 1.16 is not specific to the FFHS model, but is applicable anytime the system can be described by a single spectral density function. This will be the case whenever the electron spin relaxation times do not contribute to the time dependence of Hd, i.e. T1e and T2e >> 𝜏𝑐, the correlation time
19
Therefore determining 𝜌 can still yield qualitative results even if an appropriate dynamic model is not known. Given the lack of experimental techniques capable of measuring hydration water, this makes DNP a particularly promising technique. Figure 1.3. The 0.348 T 1H NMR signal of water taken without (top trace) and with (bottom trace) irradiation of the center electron resonance for a 15 mM concentration of the nitroxide radical 4-oxo-Tempo dissolved in water. The signal enhancement is ~ 130 fold.
The result in Fig. 1.3 clearly shows that there is efficient cross relaxation at 0.35 T, but we have yet to show the behavior of the coupling factor with 𝜏𝑡 or 𝜔.
Furthermore, we also need an experimental test of the validity of the FFHS model if we are to use Eq. 1.16 to determine 𝜏𝑡. Beginning with the former, it is easy to see from Eq. 1.14 that if 𝜔𝜏𝑡 ≪ 1, then 𝑗(𝜔, 𝜏𝑡) ≈ 1 and 𝜌 =
1
2 from Eq. 1.16. This is the
upper limit on 𝜌, so the maximum possible 1
H enhancement due to the OE from Eq. 1.6a is -330 fold. The coupling factor is plotted as function of 𝜔𝑆𝜏𝑡 in Fig. 1.4 using the FFHS model (solid line). The shape of this curve is important for determining how sensitive Overhauser DNP is to changing dynamics through 𝜏𝑡. For 1< 𝜔𝑆𝜏𝑡 <
20
30, 𝜌 decreases rapidly with increasing values of 𝜔𝑆𝜏𝑡, while outside this region, 𝜌
varies slowly with 𝜔𝑆𝜏𝑡. In our experiments at 0.35 T, the electron resonance frequency is ~ 9.8 GHz. From the above condition, the OE will be a good technique for studying translational dynamics on the timescale of ~ 10 – 500 ps. This timescale nicely covers the range of values other reports have found for the dynamics of
hydration water [15, 16, 44-46]. Thus, from a theoretical standpoint, 0.35 T is a good choice of magnetic field to perform these experiments. It also turns out to be quite fortuitous as this is the standard field for EPR studies so that much of the hardware needed for DNP is commercially available.
Figure 1.4. Comparison of the field dependence of the coupling factor for the FFHS translational diffusion model and the rotational diffusion model.
The total relaxation rate (Eq. 1.15) contains the same information as the coupling factor and can also be used to study hydration dynamics, though it is experimentally more difficult. The method of nuclear magnetic resonance dispersion (NMRD) measures the relaxation rate of a system as a function of magnetic field, and uses the data to find the shape of the spectral density functions. Typically, milli-molar concentrations of nitroxide radicals are needed for an NMRD experiment due to the
21
concentration dependence of the relaxation rate. The solubility of proteins is generally lower than this, so it is difficult to generate much contrast in the field dependence of the relaxation data. DNP, on the other hand, is still a viable technique as the contrast generated is the 1H NMR signal enhancement, and concentrations as low as 50 𝜇M of nitroxide radicals can still give measurable enhancement [18]. However, NMRD is a widely used and powerful technique because the relaxation curves can be used to distinguish different dynamic models. An example of this is shown in Fig. 1.5 where the FFHS model is compared to a rotational diffusion model to be discussed shortly. The initial decrease in the relaxation rate for both models is due to a decrease in w0
and w2 which fall off at lower magnetic fields due to their 𝜔𝑆 dependence. The w1
transition doesn‘t begin to decrease rapidly until much later and causes the high field behavior. The field dependence of DNP data, in principle, also discriminates between diffusion models as seen by the different behavior of 𝜌 with the translational and rotational models shown in Fig. 1.4. This is experimentally difficult to realize as several microwave sources and resonant structures would be needed to irradiate the electron resonance over a large enough field range to fit the data to a dynamic model.
Though the dipolar relaxation rates decrease monotonically with increasing field, this is not the case when looking at the relaxation rates as a function of 𝜏𝑡 at constant field. Fig. 1.6 shows the leakage factor with the FFHS model at 0.35 T for a 200 𝜇M concentration of free radical as a function of 𝜏𝑡. At small values of 𝜏𝑡, f is small while is 𝜌 is quite large as seen in Fig 1.4. If 𝜏𝑡 increases due to slower diffusion, as
22
Figure 1.5. Comparison of the dipolar relaxation rate due to translational motion and rotational motion. Each plot was made with the 𝜏𝑐 = 20 ps and C = 5 mM. For the two models, d = b = 2.5 Å
was used. The bound water lifetime was neglected in the calculation as explained in the text.
Figure 1.6. A plot of the leakage factor for the 1H – electron system, using the FFHS model with C = 200 𝜇M and d= 2.5 Å.
𝜏𝑡, f can approach 1 even for very small concentrations of radical, while 𝜌 is nearly 0. This observation is important for interpreting DNP signal enhancements with Eq. 1.6a as will be discussed in chapter four with apoMb. It seems somewhat counter-intuitive at first that a larger leakage factor can result in smaller measured DNP enhancement, but this turns out to actually be the case if the increase in 𝜏𝑡 is due to slower local
diffusion and not due to a change in the distance of closest approach, d. If the distance of closest approach increases, the relaxation rates also decrease, because of the factor
23
of 1/d3 in Eq. 1.15. Therefore, a decrease in 𝜌 that is associated with an increase in f
is likely due to slower local diffusion while a decrease in 𝜌 accompanied by a similar or smaller f is more likely caused by an increase in d.
It is appropriate to briefly discuss dipolar relaxation mediated by rotational motion as some proteins are known to have strongly bound water molecules that tumble with the protein as a whole [47]. In this case, the distance between the e- and
1
H nuclear spins is taken to be a constant and Hd is modulated by rotational diffusion.
The relaxation rate is given in 1.17a [42], 1 𝑇1= 𝑃𝑚 𝑇1𝑚+ 𝜏𝑚 (1.17a) 1 𝑇1𝑚 = 𝛾𝐼2𝛾𝑆2ℏ2 10𝑏6 𝜏𝑐 7𝑗 𝜔𝑆, 𝜏𝑐 + 3𝑗 𝜔𝐼, 𝜏𝑐 (1.17b) 𝑗 𝜔, 𝜏 = 1 1 + 𝜔2𝜏2 (1.17c) 1 𝜏𝑐 = 1 𝜏𝑟 + 1 𝜏𝑚 (1.17d)
where 𝑃𝑚 is the mole fraction of bound water, which is proportional to concentration,
b is the distance between the two spins when bound, 𝜏𝑚 is the lifetime of bound
water, 𝜏𝑟 is the rotational correlation time of the bound complex, and 1/𝑇1𝑚 is 1H
relaxation rate in the bound complex. It has already been assumed in Eq. 1.17 that the spin of the electron is ½ and 𝜔𝑆 ≫ 𝜔𝐼. Though the rotational model appears
somewhat complicated because we have to account for the lifetime of the bound complex, it is often the case that 1/𝜏𝑟 ≪ 1 𝜏𝑚 ≪ 1 𝑇1𝑚 so that 𝜏𝑚 can be ignored. From Figs. 1.4 and 1.5, we can see that the spectral density function for rotational
24
motion remains fairly constant until higher fields than in the translational model, but then falls off much more rapidly as the magnetic field is increased. Because of this different behavior, NMRD experiments are useful for evaluating different relaxation models and will be done in the next chapter. Combining the two models for mixed modes of relaxation can be done by adding the relaxation rates together: 1 𝑇1= 1 𝑇 1 𝐹𝐹𝐻𝑆 + 1 𝑇 1 𝑅+ 1 𝑇10.
As a final note for this section, it is now clear as to why the OE, though
discovered in 1953, has not found widespread use in NMR spectroscopy (unlike the nuclear OE that is a standard technique in NMR). The coupling factor rapidly
decreases at higher magnetic fields, and small sample volumes must be used to avoid dielectric absorption. The DNP signal enhancements at high field are not substantial enough to overcome the loss in sample volume or hardware difficulties. However, our focus is not on increasing absolute sensitivity, but on gaining information on the dynamics between the two spin bearing molecules. As the preceding discussion has shown, and chapters two through four will prove, DNP is well suited for this role.
D. Spin Labeled Electron Paramagnetic Resonance
Electron paramagnetic resonance using nitroxide spin labels (often referred to as electron spin resonance, ESR, with organic radicals) is widely used to study the structure and dynamics of biological systems [48]. Unlike NMR, EPR is not limited by the size of the paramagnetic label or spin labeled protein and can be used with 𝜇M sample concentrations. Hence, many proteins that are inaccessible to NMR can be studied with EPR. The same will be true for measuring hydration dynamics with DNP
25
since the 1H NMR signal of water, and not that of the protein, is being measured. EPR is also sensitive to a faster dynamic timescale than NMR due to the larger Larmor frequency of the electron spin. Protein conformational motions in the 𝜇s timescale, for example, are averaged in a NMR experiment, but show up as distinct peaks or changes in the lineshape of an X-band EPR spectrum. As our proposed method of measuring local water dynamics with DNP relies on spin labeled molecules, EPR is a natural technique to employ in our study of these systems. In chapter four we show how the two methods give quite complementary information and can be used together to narrow the possible interpretations of the results for complex systems. One
important point is that EPR spectra are usually taken in continuous wave, meaning the sample is irradiated with low power microwaves at constant frequency while the B0
field is swept slowly. A direct absorption peak could be measured, but to increase sensitivity, the B0 field is usually modulated at 10—100 kHz and the signal detected
with a lock—in amplifier. The resulting spectrum is the derivative of the absorption signal and most EPR spectra presented in this dissertation are derivative spectra.
The electron g and A tensor values (A being the strength of the hyperfine interaction with the 14N nucleus) of a nitroxide radical are anisotropic since the unpaired electron resides in a p-orbital. For fast rotational motion, (tens to hundreds of ps at 0.35 T) the g and A values are averaged, and the spectrum appears isotropic as in Fig. 1.2. As the tumbling of the nitroxide slows, the anisotropic values for g and
A result in line broadening and spreading out of the spectrum. A rigid-limit powder spectrum of a nitroxide, shown in Fig 1.7, is drastically different from the liquid
26
spectrum in Fig 1.2. Thus, an EPR spectrum can be used to estimate rotational motion of molecules occurring on the nanosecond timescale at X-band. Additionally, the g
and A tensor values depend on the local environment of the nitroxide. Azz in particular
is sensitive to local polarity [49-51]. Much effort has been put into calculating and fitting EPR spectra to gain information about the local dynamics of the molecule the label is attached to, such as protein backbone dynamics. This is not a trivial matter as there are many free parameters. In addition to g-values, A-values, and rotational motion, the lineshape can also be influenced by unresolved hyperfine couplings and local order parameters. At X-band excitation frequencies where most EPR is done, there is significant spectral overlap of these quantities, and care must taken when fitting spectra and interpreting results. Nevertheless, the importance of spin labeled EPR of biological samples with nitroxide radicals has motivated the development of two programs to fit spectra, Easyspin [52] and NLSL [53-56]. Details of the fitting procedure will be given in chapter four where we use NLSL to estimate the local motions and polarity of apoMb.
Though an EPR spectrum contains a wealth of information about the local environment of the spin label, it is not directly measuring water dynamics. Certainly the rotational motion of the protein backbone is influenced by the motion of local water, but the EPR spectra will also depend on whether the spin labeled residue is in an 𝛼-helix, 𝛽-sheet, or an unstructured loop. Further, the spectrum is influenced by the rigidity of the bond linking the nitroxide radical to the protein backbone [57]. This
27
Figure 1.7. Rigid-limit EPR spectrum of the nitroxide radical, 4-oxo-TEMPO. The sample was prepared by 1 mM 4-oxo-TEMPO and 100 mM trehalose sugar in water and then drying the sample.
is not meant to imply that valuable information cannot be gained from EPR, but to emphasize that Overhauser DNP and EPR are measuring different interactions. DNP directly measures the 1H NMR signal enhancement of water which depends on the dynamics of 1H—e-interactions, while EPR reports directly on the rotational motion and local environment of the spin probe.
28
II. The Overhauser effect with nitroxide radicals
A. IntroductionNitroxide radicals have been used in liquid DNP studies for over 30 years and are commonly used in proton—electron double resonance imaging experiments [58-64]. Two of the advantages of these radicals are their stability and that they can be
functionalized for different applications. For example, the amine (NH2) group of
4-Amino Tempo shown in Fig 1.2 can be replaced by a hydroxyl or carboxyl group, as well as many other functional groups. This is very useful for attaching nitroxides to various molecules as local spin probes. Due to their usefulness in DNP experiments, several studies have been performed to quantify which radicals of this family have the largest coupling factor [65-67]. However, the results of these studies have varied greatly with values of 𝜌 ranging from ~ 0.2 to larger than the theoretical maximum of 0.5. The differences are not consistent with the experiments being done at different magnetic fields. All three of these studies were done at low magnetic fields in the range of 6 to 15 mT. In this field range, 𝜌 should be varying only slowly with
increasing field, and dramatic differences should not be observed (see Fig 1.4). There is also no explanation for a measured 𝜌 > 0.5. Common to these studies was the use of Eq. 2.1 for the saturation factor
𝑠 =1 3
𝛼𝑃
1 + 𝛼𝑃 (2.1).
To account for variances in applied power, the DNP enhancement is measured as a function of power, and the result extrapolated to infinite power. Thus we define
29
𝐸max = 𝐸 𝑃 → ∞ = 1 − 𝜌𝑓𝑠max 𝛾𝑆
𝛾𝐼 (2.2) where 𝑠max = ⅓ from Eq. 2.1. The leakage factor depends on the radical
concentration through Eq. 1.9, but can be measured and accounted for with Eq. 1.8. Thus, no matter what concentration of radical is used, Eq. 2.2 can be used to find 𝜌. As we show in the Results and Discussion section, this method fails for nitroxide radicals. The three hyperfine lines of the nitroxide radical are not independent, but are coupled through collision induced electron spin exchange and through rapid
relaxation of the 14N nucleus of the nitroxide due to slow molecular tumbling [68]. A model for the saturation factor taking into account e- spin exchange was originally proposed in 1977 by Bates and Drozdoski [69] in a rarely cited paper that I will discuss shortly. We show that this model works very well for nitroxides dissolved freely in solution, but does not explain our experimental results of spin labeled proteins and gels. These results require a model incorporating nitrogen nuclear spin relaxation into the saturation factor. It is important to note that in none of the studies investigating the coupling factor mentioned above (one as recent as 2006), did the authors use the work of Bates and Drozdoski in explaining their experimental data. Though nitroxide radicals were being widely used in Overhauser DNP experiments, and effort was being put into determining the ones that gave the best performance, a thorough investigation into these radicals and a quantitative understanding was lacking.
We also apply the FFHS model to the DNP and NMRD results as a check on the validity of this model. Our results show that the FFHS model fits the NMRD data
30
well. However, there is an unresolved discrepancy between the DNP and NMRD analysis. These experiments are important for showing that DNP can be used to gain information on hydration dynamics and for evaluating the limitations of the
technique. Finally, we compare the DNP, NMRD, and molecular dynamics (MD) simulations results of two widely used types of nitroxide radicals; a pyrroline (5-membered ring) based and piperidine (6-(5-membered ring) based ring structure. We show that the change in ring structure does not measurably change the coupling factor or relaxation behavior. This is relevant because a particular structure can be chosen for spin labels based on symmetry or ease of chemical modification, and the DNP results can still be compared. For example, 5-membered rings are usually used as spin labels for proteins and lipid tail groups, while 6-membered rings are often used on poly-electrolytes and lipid head groups. Additionally, our MD experiments discussed below show that the local diffusion coefficient of water is unaffected by the presence of the nitroxide radical. Hence, the measured DNP enhancements reflect the actual timescale of water diffusion and are not significantly perturbed by the spin label.
B. A new model describing the saturation factor
Bates and Drozdoski proposed that collision based electron spin exchange mixes the three hyperfine lines of a nitroxide radical. Since spin exchange requires a collision between two radicals, the effect will depend on concentration. Instead of assuming the simple four level model of Fig. 1.1, all three hyperfine states must be included. The new 12-level model is shown in figure 2.1 along with the possible exchange transitions with rate, 𝜅 = 𝜅′𝐶. Only exchange transitions involving
31
electrons in opposite spin states are shown as these result in a change of electron spin population for a particular set. However, the total electron spin population is
conserved. In the figure, F represents e- transitions induced by the applied microwave field and is only applied to one of the hyperfine states. Bates and Drozdoski made four assumptions: (1) the energy difference between the three hyperfine states is small so that the dipolar transition rates in each of the hyperfine sets can be considered equal, i.e. w0 in set I equals w0 in sets II and III. (2) The 1H nuclear spin does not
change during a spin exchange transition. (3) The rates p, F, and 𝜅 which involve only electron spins are much faster than the rates involving nuclear spin so small and second order terms can be ignored. (4) The 14N nuclear spin is constant. I first
summarize the results from Bates and Drozkoski and then discuss what happens when this fourth assumption is removed.
Figure 2.1. 12-level diagram describing the energy levels for a coupled e-—1H system when using a nitroxide radical. The exchange transitions were first proposed in ref [69] while inclusion of 14N nuclear spin transitions was part of my original work [18]. Only dipolar coupling is assumed.
Using the 12 level model, a set of 12 equations similar to Eq. 1.3 can be written, but we now include spin exchange transitions and explicitly include transitions induced by the microwave field, F. I leave the explicit details of how the equations were set up and solved to the original work [69], but the end result is
32 𝐸 = 1 − 𝜌𝑓 𝜔ESR 𝜔NMR 1 3 𝑎 𝑝 𝑃 1 + 𝑎 1+𝜅 𝑝 𝑝 1+3𝜅 𝑝 𝑃 (2.3)
where we have assumed F = aP, and a is constant relating microwave power to F. There are several important aspects of Eq. 2.3 to notice. The first is that the power dependence is exactly the same as Eq. 1.7 and 2.1 as it should be since this is observed experimentally. Secondly, 𝛾𝑆 𝛾𝐼 has been replaced by 𝜔ESR 𝜔NMR. This implies that the maximum possible DNP enhancements depend on which hyperfine state is being irradiated. Bates and Drozdoski did observe this effect at magnetic fields of 5 to 9 mT, but at 0.35 T where our experiments were done, this change is negligible. Most importantly, however, is the inclusion of 𝜅 into the equation for E. Since 𝜅 = 𝜅′𝐶, there is now an extra concentration dependence of the DNP
enhancements in addition to f. The result of this is seen more easily if we take the limit of infinite power; then
𝐸max = 1 − 𝜌𝑓1 3 1 + 3𝐶 𝜅′ 𝑝 1 + 𝐶 𝜅′ 𝑝 𝜔ESR 𝜔NMR (2.4).
This equation is very similar to Eq. 2.2, but now smax depends on the concentration of
radical and T1e. Additionally, in the limit of very high radical concentration
𝐸max 𝐶 → ∞ = 1 − 𝜌𝜔𝐸𝑆𝑅
𝜔NMR (2.5).
Thus, if electron spin exchange is very fast compared to 1/T1e, irradiating one
hyperfine line can effectively saturate the entire electron spin population, contrary to the previous assumption that only ⅓ of the e- spins can be fully saturated. However,
33
we recover this lower limit as 𝐶 → 0. While Bates and Drozdoski predicted this effect and used it to explain their larger than expected DNP enhancements, they did not attempt to quantify the effect by fitting for 𝜌 or measuring T1e and 𝜅′.
A previous EPR study found that an isotope enriched 15N-nitroxide radical dissolved in solution had a 15N nuclear spin relaxation rate several orders of magnitude faster than the e- spin relaxation rate for a range of tumbling times appropriate for spin labeled proteins [68]. Since 14N is a quadrupolar nuclei even faster nuclear spin relaxation effects are expected, but no experimental studies were found in the literature. This work, along with our DNP experimental results on spin labeled molecules, motivated us to develop a model for the saturation factor that takes nitrogen nuclear spin relaxation into account. In developing the model, we follow the work of Bates and Drozkoski, but we allow the 14N nuclear spin to change by ±1 with rate wN as shown in Fig. 2.1. Upon adding these new transitions, the DNP
enhancement factor is given by [18]:
𝐸 = 1 − 𝜌𝑓 𝜔ESR 𝜔NMR 1 3 1 − 2𝑤𝑁𝜔𝑁 𝑝𝜔ESR 2 +𝑤𝑁 𝑝 + 6𝜅 𝑝 × 𝑎𝑃 𝑝 1 +𝑎𝑃 4+ 𝑤 𝑁 𝑝 + 2𝜅 𝑝 𝑤 𝑁 𝑝 + 6𝜅 𝑝 +2 3𝑤 𝑁 𝑝 + 8𝜅 𝑝 𝑝 2+𝑤 𝑁𝑝 +6𝜅𝑝 2+3𝑤 𝑁𝑝 +6𝜅𝑝 (2.6)
where 𝜔𝑁 is the 14N Larmor frequency. The first term in parenthesis in this equation
is ~ 1 even if wN/p is large due to the 𝜔𝑁/𝜔ESR term, and will be ignored in the
34
same as Eq 2.3, agreeing with experimental results, but now the saturation factor depends on the e- spin exchange rate, 1/T1e, and wN. In the limit of infinite power, the
maximum saturation factor becomes
𝑠max= 1 3 2 +𝑤𝑁 𝑝 + 6𝜅 𝑝 2 + 3𝑤𝑁 𝑝 + 6𝜅 𝑝 4 + 𝑤𝑁 𝑝 + 2𝜅 𝑝 𝑤𝑁 𝑝 + 6𝜅 𝑝 + 2 3𝑤𝑁 𝑝 + 8𝜅 𝑝 (2.7).
If wN is unimportant, then Eq. 2.7 reduces to the saturation factor of Eq. 2.4.
However, in the absence of any e- spin exchange we still have
𝑠max 𝜅 = 0 =1 3 2 +𝑤𝑁 𝑝 2 + 3𝑤𝑁 𝑝 4 +6𝑤𝑁 𝑝 + 𝑤𝑁 𝑝 2 (2.8).
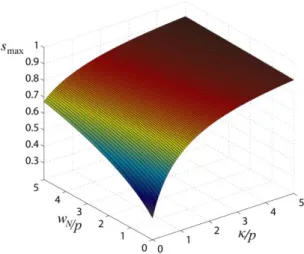
Thus, if the nitroxide radical is tethered to a larger molecule to eliminate e- spin exchange, smax can still approach 1 if wN >> p. A plot of Eq. 2.7 is shown in Fig 2.2.
As either 𝜅 or wN becomes large compared to p,smax approaches 1 due to efficient
mixing of the hyperfine states. As they both go to 0, smax reduces to ⅓ as expected.
Also, smax increases more rapidly with 𝜅/p than with wN/p. This is because an
exchange interaction is a bimolecular process involving two nitroxide radicals, whereas nitrogen nuclear spin relaxation involves only one molecule.
Lastly, we also derived a saturation factor for a 15N enriched nitroxide radical where there are only two hyperfine states. The maximum saturation factor is
𝑠max( N) =1 2 1 +𝑤𝑁 𝑝 + 2𝜅 𝑝 1 +𝑤𝑁 2𝑝 + 𝜅 𝑝 (2.9). 15
35 Figure 2.2. The maximum saturation factor using Eq. 2.7.
Of course if there is no mixing of hyperfine states, then a 15N nitroxide radical will have a larger smax of ½ compared to ⅓ for natural abundance 14N. For fast nitrogen
nuclear spin relaxation or e- spin exchange, smax for both 14N and 15N nitroxide radials
will converge to 1, though the 15N nitroxide converges slightly faster. However, for spin labeled molecules where wN/p can be on the order of 100-1000, using a 15N
labeled nitroxide has no advantage over the 14N natural abundance nitroxide.
C. Results and Discussion Quantifying the saturation factor
To test the model of Bates and Drozkoski, 1H of water DNP experiments were performed with different concentrations of the nitroxide radical 4-oxo-TEMPO (Fig 2.3b) at 0.35 T (see Materials and Methods Section at the end of the chapter for more details). The NMR signal enhancements were measured at various microwave
powers, and the results extrapolated to infinite power to find Emax. The leakage factor
36
mixing of the hyperfine states, then knowing Emax and f would be enough to
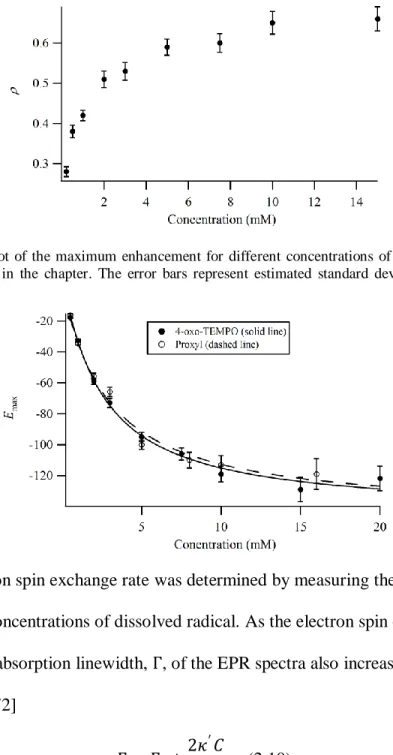
determine 𝜌 with Eq. 2.2 since all the concentration dependence is included in f. The calculated coupling factors using this method are shown in Fig 2.5. Clearly 𝜌 is not constant as would be expected if smax = ⅓. Also, 𝜌 was found to be greater than the
theoretical maximum for every concentration above 2 mM. The experimental data for the leakage factor on the other hand, is accurately described by Eq. 1.9. Since f
depends on the same dipolar relaxation rates as 𝜌, with the addition of w0, and Eq. 1.9 fits the data for f well, it is unlikely that there is an unaccounted for dependence of 𝜌 on C. Thus we must re-examine the data using a model that incorporates mixing between the different hyperfine states.
The rotational correlation time of nitroxide radicals freely dissolved in solution (i.e. not being used as a spin label) is on the order of 20 ps and wN/p is expected to be
small [68, 71]. Thus, we can neglect wN/p in this case and use Eq. 2.4 to analyze the
DNP results. A plot of Emax vs. C for 4-oxo-TEMPO is shown in Fig. 2.6 (solid
circles; proxyl will be discussed below) and the data was fit to equation 2.4 with two fit parameters, 𝜌 and 𝜅′/𝑝. The model fits the data well and gives 𝜌 = 0.22 ± 0.01 and 𝜅′/𝑝 = 1.0 ± 0.3. The electron spin exchange rate and relaxation time can be
measured independently to serve as a check for the validity of this model, and the assumption that wN/p can be ignored. Note that 𝜌, however, can actually be found
37
Figure 2.3. Chemical structures of two nitroxide radicals used in this chapter. a) 3-carbamoyl-2,2,5,5-tetramethyl-3-pyrrolin-1-oxyl (proxyl), and b) 4-oxo-2,2,6,6-tetramethyl-1-piperidinyloxy (4-oxo-TEMPO). Structures used in MD simulations of c) proxyl and d) 4-oxo-TEMPO created with PyMOL [70] and an example of the orientation of hydrogen bounded water molecules as discussed in the text.
Figure 2.4. The leakage factor measured with Eq. 1.8 for different concentrations of 4-oxo-TEMPO. The solid line is the fit of the data to Eq. 1.9 and gives k = 0.217 mM-1s-1.
38
Figure 2.5. Calculated coupling factors for 4-oxo-TEMPO at various concentrations assuming
smax = ⅓. 𝜌 is clearly not constant under this assumption, and even exceed the theoretical maximum of 0.5.
Figure 2.5. A plot of the maximum enhancement for different concentrations of 4-oxo-TEMPO and proxyl discussed in the chapter. The error bars represent estimated standard deviations from the fit parameters.
The electron spin exchange rate was determined by measuring the EPR linewidth for different concentrations of dissolved radical. As the electron spin exchange rate increases, the absorption linewidth, Γ, of the EPR spectra also increases according to the equation [72]
Γ = Γ0+2𝜅
′𝐶