Abstract—Prediction of an event at a time series is quite important for engineering and economy problems. Time series data mining combines the fields of time series analysis and data mining techniques. This method creates a set of methods that reveal hidden temporal patterns that are characteristic and predictive of time series events. Time series data mining examines the time series in a phase space. In this paper, a prediction algorithm using time series data mining based on fuzzy logic is proposed. Earthquake prediction has been done from a synthetic earthquake time series by using investigating method at first step ago. Time series has been transformed to phase space by using nonlinear time series analysis and then fuzzy logic has been used to prediction optimal values of important parameters characterizing the time series events. Truth of prediction algorithm based fuzzy logic has been proved by application results.
Keywords—Event, fuzzy logic, time series analysis, time series data mining
I. INTRODUCTION
time series data is obtained at determined time interval from any system. Daily price change of a market, current and voltage data of an induction motor and the population distribution according to year in a country may be considered as a time series. Such a time series contains events of interest [1]. One innovate approach is to identify critical, time-ordered structures, called temporal pattern, which are hidden in eq. (1) and are characteristic of interesting events [2]. Time series analysis is fundamental to engineering, scientific, and business endeavors [3]. Investors are interested in predicting future values from past time series data. A time series example has been given in equation (1).
} ,..., 1 , {x t N X = t = (1) In such a time series, t is time index and N is the total number of observations. Important events are formed over the time. For example, an earthquake from a synthetic seismic time series, instantaneous fall at stock prices and incipient faults in an induction motor are considered as an event for a time series. Time series is analyzed for prediction of these events. Traditional time series analysis methods such as
Box-I. Aydin is with Erzincan University, Erzincan, Zip code 24600 Turkey (phone: 0090-533-428-56-92; fax: 0090-446-751-30-21; e-mail: [email protected] ).
M. Karakose is with the Computer Engineering Department, University of Firat, Elazig, Zip code 23119 Turkey (e-mail: [email protected]).
E. Akin is with the Computer Engineering Department, University of Firat, Elazig, Zip code 23119 Turkey (E-mail: [email protected]).
Jenkins or Autoregressive Integrated Moving Average (ARIMA) method can be used to model such time series. However, the ARIMA method is limited by the requirement of stationary of time series and normality and independence of residuals. An event characterization function g(t) can be employed to characterize the event in equation (1) as shown in equation (2). ) ,..., , ( ) (t g x x 1 x1 g = t t− (2) This event characterization function changes according to the prediction aim. For example, if xt represents today’s
closing price of a stock and our aim is to predict the percentage change of tomorrow’s price, then the event characterization function can be defined as shown in equation (3). The event characterization function is defined such that its value at t time index correlates highly with the occurrence of an event at some specified time in the future [1]. If earthquake prediction is wanted to do one step before, the event characterization function in equation (4) can be selected.
t t t x x x t g()= +1− (3) 1 ) (t =xt+ g (4) Event characterization functions at equation (3) and (4) can be defined by different ways for event predictions at different time series. Before the event characterization function is determined, the aim is to select this function which predicts important events. This is not trivial task due to nonlinear behaviors of most time series in the real world applications.
An important disadvantage in time series analysis is that the time series should be converted to stationary and periodic series in order to analyze it [4]. As an emerging discipline, data mining is the process of discovering hidden and useful information from huge data. Data mining is defined as extracting useful and meaningful information using statistic, machine learning, artificial intelligence and pattern recognition techniques from large data sets [5]. Data mining is the analysis of data with the goal of uncovering hidden patterns. Weiss and Indurkhya [6] defined data mining as “the search for valuable information in large volumes of data”. Time series data mining combines data mining and nonlinear time series analysis to analyze a time series. When data mining is applied to time series data, an event is considered as an interesting pattern. Povinelli [1] defines time series data mining as “combining of data mining, time series analysis and genetic
I. Aydin, M. Karakose, and E. Akin
The Prediction Algorithm Based on Fuzzy
Logic Using Time Series Data Mining Method
algorithm techniques”. He used the genetic algorithm to discover interesting patterns in a time series by data mining.
Time series should be examined in a phase space in order to get interesting pattern from it. The main goal in time series data mining is to use time delay embedding and phase space based on Taken theorem [7]. The phase space of a time series in equation (1) is generated by using time delay embedding and embedding dimension in order to get interesting patterns. Elements of Xt form time lagged shape of original time series
with embedding dimension b and time delay factorτ. The phase space of the time series in equation (1) according to time delay factor τ and embedding dimension b is presented in equation (5). X is a matrix whose row vector is a point in the phase space. b t b t b t t x x x R X =( −( −1)τ, −( −2)τ,..., )∈ (5) Where τ=1, 2,….,k is time delay embedding which allows the phase space to be spanned over nonconsecutive time-lagged instances. For instance, τ=3 and b=3, the vector is shown by Xt=(xt-6,xt-3,xt). This transformation preserves the
nonlinear dynamics of the original time series and the temporal patterns are represented by data points Xt in the phase space
[2]. The temporal patterns representing the characteristic of time series are used to prediction of the important events. This method is successfully applied non-periodical, nonlinear, and complex time series.
Data mining is the process of discovering useful pattern in data that are hidden and important pattern. It comes from several fields, including statistics, database and machine learning [5]. It uses techniques such as clustering, association rules, and classifications models to identify hidden and useful information in large databases. Others who have applied data mining concepts to finding patterns in time series include Keogh and Smyth [8], [9]. Their approach uses a dynamic programming method for aligning the time series and a predefined set of templates. Moon et al. [10] proposed a new time subsequence matching method. They used the dual match for time series similarity. Time series data mining has been used in a lot of fields such as clustering and event prediction in literature. One of these methods is classification and fault diagnosis in induction motors [11], [12]. Povinelli [1] was suggested an application in order to event prediction. In his study, he did different applications such as earthquake prediction, sharp fall of stock price. At first step, he transformed a time series to phase space. He selected different event characterization functions for each application. Optimal temporal pattern cluster with radius r and temporal pattern center v was found by using genetic search algorithm. Despite the novelty of this method, several problems limited its applications and must to be addressed. First, temporal pattern cluster in this study was defined by a rigid region with fixed center and radius. This restriction made it hard to adjust to the situation when there is noise in phase space and often generated high degree false-positive prediction. The second disadvantage is the computational complexity and stability. The genetic algorithm yields heavy computing load. The
optimization results were often inconsistent. The choices of embedding dimension b and time delay τ were always based on user’s experience with trial-and-error. Feng et al. [2] suggested new time series data mining for identifying temporal patterns. In his study, temporal pattern cluster was chosen as a fuzzy set with Gaussian shaped membership function. An efficient two step optimization strategy was proposed to search the optimal temporal cluster in the phase space. Time delay embedding τ and embedding dimension b is chosen by mutual information and false nearest neighbor method, respectively. Gradient descent optimization algorithm is chosen in order to find optimum temporal pattern cluster. Multilayer feed-forward neural network was performed on the D-stock prediction [13]. The goal was predicted next day’s closing price change, with the input of today as well as four previous day’s price change.
In this paper, proposed time series data mining method is based on fuzzy logic. This method uses the fuzzy logic for earthquake and Lorenz series prediction. Therefore, event prediction doesn’t include complex mathematical equations and the prediction is simplified. The prediction is flexible due to property of fuzzy logic method. Because temporal pattern cluster is selected as a fuzzy set, each of point in temporal pattern cluster belong to cluster with a specific membership degree. So the event prediction is predicted accurately. The heavy load which the genetic algorithm yields is removed. Because user experience about event prediction is shown in phase space and augmented phase space easily, the fuzzy rules is also determined, easily.
The paper is organized as follows: Section II provides brief review of time series data mining using phase space strategy. We introduce and discuss our application results in section III. Conclusion and future study are discussed in section IV.
II. APPLICATIONS OF TIME SERIES DATA MINING
Data mining is a technique of discovering useful pattern in data that are hidden and unknown in normal circumstance. Data mining consist of machine learning, statistics and database design [2]. It uses methods such as clustering, classification, association rule mining and probabilistic graphical dependency models to identify hidden and useful information from large databases [2], [3].
Predictive data mining is a search for very strong patterns in big data that can generalize to accurate future decisions [2]. Data mining refers to extracting or “mining” knowledge from large amounts of data [5]. Keogh et al. [8] used piecewise linear approximation representation of time series for clustering, classification and association rule mining of time series data. They have examined the first extensive review and empirical comparison of time series segmentation algorithms from a data mining perspective. They have developed an efficient sequential pattern for identifying frequent temporal patterns. Faloutus et al. [14] have developed efficient time series similarity search methods namely subsequence matching. Povinelli et al. [15] have proposed a new signal analysis and classification method based on reconstructed phase space. They have used statistical method to estimate of phase space. Bayesian likelihood and artificial neural network
have been used for classification and compared two techniques. Feng et al. [2] have proposed fuzzy set and the Gaussian shaped membership function to define temporal patterns in time delay embedding phase space. The resulting objective function represents not only the overall value of the event function, but also the weight of the vector in temporal pattern cluster to which it contributes. Gradient descent optimization method has been used to search temporal patterns. Furuta et al. [16] have applied soft computing techniques for earthquake acceleration data. Applicability and efficiency of chaos prediction and neural network method have been compared and examined using the time series data of earthquake acceleration.
III. PROPOSED PREDICTION ALGORITHM BASED ON FUZZY
LOGIC USING TIME SERIES DATA MINING
Time series data mining method establishes a method that uncovers hidden patterns in a time series. Methods based on the time series data mining technique are able to successfully characterize and predict complex, non-periodic, irregular and chaotic time series [1]. The time series data mining methods overcome limitations of traditional time series analysis techniques by adapting data mining concepts for analyzing time series. Method used here is based on time delay embedding. If the embedding is performed correctly, the theorems involved guarantee that the reconstructed dynamics is topologically identical to the true dynamics of the system, and therefore that the dynamical invariants are also identical [17]. The time series which is applied data mining should be examined in a phase space. This is an extremely powerful correspondence; it implies that conclusions drawn from the embedded or reconstruction-space dynamics are also true of real dynamics. Time delay embedding τ and embedding dimension b are important parameters in constituting a reconstructed phase space or briefly called phase space.
The phase space of a time series given in equation (1) is a matrix whose elements are time lagged version of the original time series data as follows:
= − − − − + − + + − + τ τ τ τ τ τ ) 1 ( ) 2 ( 2 2 ) 1 ( 2 1 1 ) 1 ( 1 ... . . . . . . . . ... ... b N b N N b b x x x x x x x x x X (6)
Where, xN is the original time series data, N is number of
observations; b is embedding dimension and τis time delay. It is important to point out that each row vector of X is a single point in the phase space. Here, the time lag τ is determined using first minimum of mutual information technique or autocorrelation function and the embedding dimension b can be estimated using false nearest neighbor method.
Block diagram of proposed prediction method based on fuzzy logic is given in Fig. 1. According to this diagram, before
target information is extracted from time series all data must be preprocessed and initial parameters are selected. In this stage, the embedding dimension b and time delay embedding
τ is determined using false nearest neighbor and mutual information techniques, respectively. Then time series must be transformed to the phase space. After event characterization function g(Xt) is defined, Euclidian distance from initial points
of center points v of temporal cluster and cluster radius r are selected as inputs of prediction algorithm.
Fig. 1 The prediction algorithm scheme based on fuzzy logic using
time series data mining
A. Estimation of Time Delay Embedding
It must be selected an appropriate time delay τ for phase space. If τ is small compared to the internal time scales of the system, successive elements of the delay vector are strongly correlated. All vector of X are then clustered around the diagonal in the Rb, unless b is very large [4]. The two methods for estimating τ are the information of autocorrelation and mutual information. First method is the autocorrelation functions. For a time series given in equation (1), time delay is estimated by calculating autocorrelation between X and t
τ − t X as shown in equation (7). C(Xt,Xt−τ)= } )] ( {[ ) ( ) ( 2 2 t t t t t X E X E X E X X E − − −τ (7)
If we plot values Xtversus the corresponding values a fixed lag v earlierXt−τ , the autocorrelation C quantifies how these points are distributed. If they spread out evenly over the plane, then C is zero. If they tend to crowd along the diagonal, then C becomes big from zero. The autocorrelation function takes the estimate of time instance when the autocorrelation function
first crosses zero as the time delay. The mutual information is computed by:
∑
∑
− + j i i i j i ij ij t p p p p X , , t )= ( ) ln ( ) 2 ln X , M( τ τ τ (8)It is sometimes advocated that one look for the first minimum of time delayed mutual information. This is the information we already possess about the value Xt+1 if we know Xt. The
expression we have to compute is based on Shannon’s entropy. On the interval explored by the data, we create a histogram for the probability distribution of the data. Denote by pi the
probability that the signal assumes a value inside the ith bin of histogram, and let pij(τ) be the probability in bin i and Xt−τ is in bin j. The first minimum of mutual information function marks as the time lag [4].
B. Estimation of the Embedding Dimension
When we start to analyze a nonlinear time series, we must determine the embedding dimension. One way to estimate the embedding dimension b is using the nearest neighbor method [4]. This means that a b-dimensional phase space will have the same topological properties as the original phase space [2]. A phase space is a b dimensional metric space into which a time series is unfolded. Takens [7] showed that if Q is large enough, the phase space is homeomorphic to the state space that generated the time series. Taken’s Theorem provides the theoretical justification for reconstructing state spaces using time-delay embedding. Taken’s proved that the state space of an unknown system can be reconstructed. If the embedding is performed correctly, Takens’ Theorem guarantees that the reconstructed dynamics are topologically identical to the true dynamics of the system. The algorithm of finding false nearest neighbor is described as follows:
For each data point which is denoted by X in Rbi b, its nearest neighbor is found by
|| || min arg bj b i X b j X X X b j − = , (9)
Where ||Xib−Xbj || is the Euclidean distance between the two points. If the embedding dimension is changed from b to b+m, distance between the two points is calculated by:
2 2 2
||
||
||
||
||
||
b j b i b j b i m b j m b i iX
X
X
X
X
X
r
−
−
−
−
=
+ + (10) If r exceed a given threshold v, then i X is marked as having ib a false nearest neighbor. Therefore, the embedding dimension is determined by the fact that the number of data points r >v is i zero in Rb. After time delay embedding τ and embedding dimension b is determined, the phase space matrix is constituted. Another preparation stage in the time series data mining is determined the event characterization function whichchanges according to the application. In this paper, because our aim is the prediction of an earthquake from a synthetic seismic a time series, the event characterization function is selected as given in equation (4). To find the important event, the target function must also be determined. Such a target function is described in equation (11).
+ − ≥ < − =
∑
∑
= = others g N M g X g M N M if r v x X g M r v f M i i i M i i , ) ) ( 1 (( || || , ) ( 1 ) , ( 0 0 1 1 β β (11)Where g0 is the smallest event value, N is total number of data,
β
is rate of the minimum cluster size, r is cluster radius, v is center points of cluster, and M is total number of data inside cluster. Disadvantage of this cluster is that it uses a crisp clustering. Radius of the cluster is crisp and each point in the cluster is own same membership degree. Alternatively, the temporal pattern cluster can be defined as fuzzy set:)} | ) ( , {(Xt F Xt Xt Rb F= µ ∈ (12) Where µF(Xt)the membership is a function indicating the degree of Xt in F and is computed as in equation (12).
According to this new temporal pattern cluster, the target function is changed as equation (14).
2 2 || || ) ( r X v t F t e X − − = µ (13) =
∑
= N i i i F X g X r v f 1 ) ( ) ( max )} , ( max{ µ (14)Since the fuzzy logic theory was described by Prof. L. Zadeh, it has been used many of field of engineering [18]. Fuzzy logic is a problem-solving control system methodology that lends itself to implementation in systems ranging from simple, small, embedded micro-controllers to large, networked, multi-channel PC or workstation-based data acquisition and control systems. It can be implemented in hardware, software, or a combination of both. It provides a simple way to arrive at a definite conclusion based upon vague, ambiguous, imprecise, noisy, or missing input information. Fuzzy logic’s approach to control problems mimics how a person would make decisions, only much faster. Generally, fuzzy logic is quite effective method in systems that the mathematical model is unknown or cannot be established. The problem solution in fuzzy logic is three steps: fuzzifier, inference mechanism, and defuzzifier. First, the parameters of the system to be examined are measured. Then the inputs are exposed to fuzzifier. Knowledge base to be obtained fuzzy rules extracts fuzzy values in order to justification of the inspected system. In last step, these fuzzy output values are made certain with one of defuzzifier methods and justification of the system is made.
IV. APPLICATION RESULTS
A. The Seismic Synthetic Earthquake Example
The prediction algorithm based on fuzzy logic is applied to a synthetic seismic time series. Matlab package program is used in order to estimate an earthquake degree from synthetic seismic time series. Graphics of synthetic seismic time series is given in Fig. 2.
Fig. 2 Synthetic seismic time series
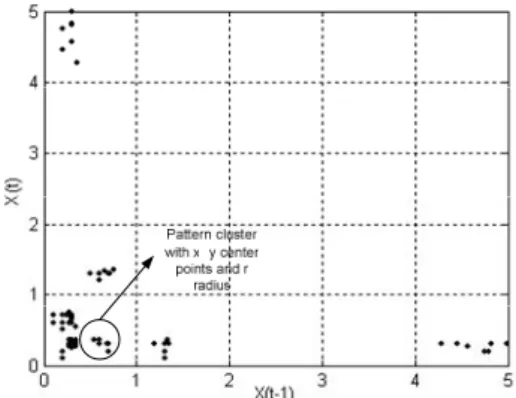
After synthetic seismic time series is obtained, embedding dimension and time delay factor of phase space must be determined. In this study, embedding dimension is selected as two and time delay factor is selected as one. According to these parameters, constructed phase space is given in Fig. 3. Every pair of adjacent observations in the original time series forms a single point in this phase space. The determined radius and center points of temporal pattern cluster that predict the earthquake one step ago is our target in this study using time series data mining. Augmented phase space is given in Fig. 4. Our aim is find the temporal pattern that will show to be an earthquake. The augmented phase space is a three dimensional phase space with (xt,xt-1,xt+1) dimensions.
Fig. 3 The phase space of synthetic seismic time series
Fig. 4 Augmented phase space of synthetic seismic time series
The first input of the fuzzy logic is radius of the temporal pattern cluster and the second input is Euclidian distance of cluster center points from initial points. The output of fuzzy is shown the size of the earthquake. The membership of fuzzy logic is given in Fig. 5.
a) Membership functions for r b) Membership functions for v
c) Membership functions of output D
Fig. 5 Input and output membership functions of fuzzy logic for synthetic time series phase space
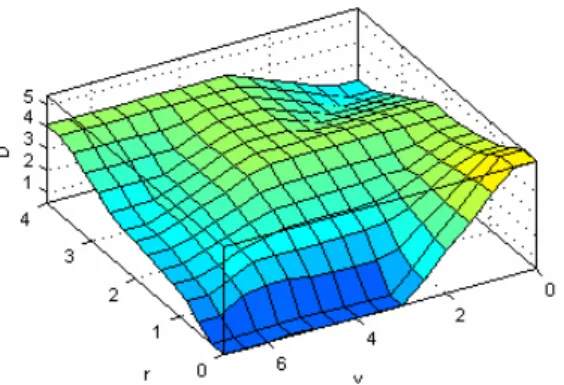
The constituted rule base according to these membership functions is given in Fig. 6. The output graphic of prediction method based on fuzzy logic and the application results are given in Fig. 7 and Table I, respectively.
Fig. 7 The earthquake prediction graphics according to fuzzy input values
TABLE I
THE APPLICATION RESULTS OF PREDICTION ALGORITHM BASED ON FUZZY
LOGIC v r D 0.49 0.35 5.5 0.28 3.83 2.25 3.66 1.23 3.09 6.08 0.50 0.832 1.41 5.70 2.47
Earthquake size according to radius and Euclidian distance from initial points of center points of temporal pattern cluster is given in Fig. 7. If v is big and r is small, then the degree of earthquake is small. If v is small and r is small, then the earthquake is big. If the center points of the temporal pattern cluster is 0.5 and 1.3 and radius of the temporal pattern cluster is 1.3, then the earthquake is maximum shown as in Fig 7. Therefore, Fuzzy logic could predict v and r parameters which will predict the earthquake one step ago. One of the advantages of this method is to use data mining for analysis of time series and such a system is modeled by fuzzy logic without too many complex mathematical equations. As shown in Table I, the optimum values of v and r is values of first row and where size of earthquake is 5.5. These parameters predict an earthquake one step after.
B. Lorenz Series Analysis
A well known nonlinear time series-Lorenz series is generated by equation (15), with three state variables(x, y, z):
− = − − = − = bz xy dt dz xz y rx dt dy x y dt dx ) ( σ (15)
Where σ,r and b are model parameters of equation 14, known as Prandtl number, Rayleigh number, and geometric factor respectively, see [6] for details.
Fig. 8 plots the Lorenz series with σ =10.0, r=28.0 and b=8/3. In this application the x component is chosen as observed time series with 0.01 step size.
Fig. 8 x(t) component of Lorenz series
Time delay
τ
was determined as τ =1.2 s and the embedding dimension b=3 by mutual information and false nearest neighbor method, respectively. The estimated mutual information for x(t) component of Lorenz series is shown in Fig. 9 and the embedding dimension is shown in Fig. 10.Fig. 9 Mutual information of x(t) component of Lorenz series
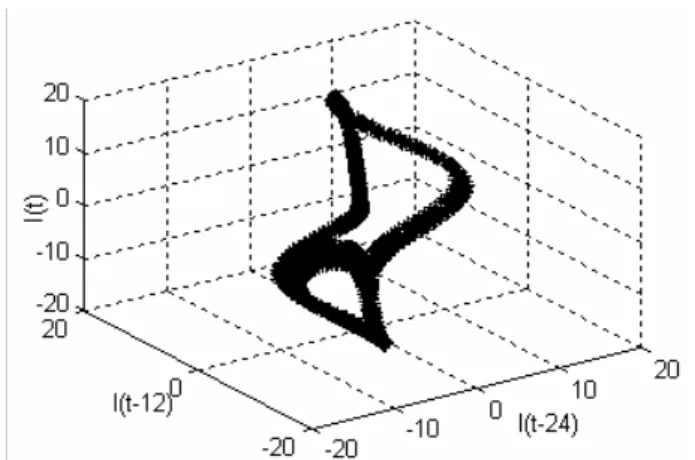
The phase space of x(t) has three embedding dimension. 3D dimensional phase space is as shown in Fig. 11.
Fig. 11 Phase space of x(t)
The importance occurrence or event for this series was defined as to when the magnitude of the predicted next point is greater than 15. 0 15 ) (xt =xt+1− > g (16) The goal of our approach is not identify all event points in the Lorenz time series. The algorithm takes an approach to identify those temporal patterns that are likely predictive of the events. The target function f(v,r) was used to extract the fuzzy rules from phase spaces. The membership function of fuzzy logic is given in Fig. 12.
a) Input membership functions for v
b) Input membership function for zA axis
NB NS Z PS -20 -15 -10 -5 0 5 10 0.5 1 15 20 PB
c) Output membership function for T
Fig. 12 Input and output membership functions of fuzzy logic for lorenz time series phase space
The rule base for Lorenz time series prediction is given in Fig. 13. The output surface of fuzzy is demonstrated in Fig. 14.
Fig. 13 Rule base of prediction algorithm based on fuzzy logic fro Lorenz time series phase space
Fig. 14 The event prediction graphics according to fuzzy input values
In Fig. 14, the event is predicted when distance of cluster center points to initial points is big and the axis ZA is positive
small.
V. CONCLUSION
Time series data mining is one of important issues which uses for time series analysis and extract hidden, useful and interesting patterns from them. So this method uses data mining for analyzing time series, it yields a new approach to
time series analysis. When data mining whose main aim is extract useful, interesting and hidden patterns from large data sets is used in time series data, an earthquake prediction and the sudden falling of stock price is estimated one step before. One of advantage our approach, it detect many events. Membership functions and fuzzy rules change based on problem. Gaussian shaped fuzzy membership function is used in order to determine temporal pattern clusters without dependent of applications. Thus the temporal pattern can be defined at a smooth region. Genetic search algorithm catches local minima and yield to heavy computing load. The fuzzy temporal pattern cluster represents temporal patterns more realistically in the time delay embedding.
There is a potential for further development. Although the Gaussian shaped membership function is employed to represent the temporal pattern and objective function, other different functions could be applied. Also, some fuzzy optimization algorithm could be applied to different time series data.
REFERENCES
[1] R. J. Povinelli, “Time Series Data Mining: Identifying Temporal Patterns for Characterization and Prediction of Time Series Events”, Ph.D. Dissertation, Marquette University, 180 p., 1999.
[2] X. Feng and H. Huang, “A Fuzzy-Set-Based Reconstructed Phase Space Method for Identification of Temporal Patterns in Complex Time Series”, IEEE Trans. on Knowledge and Data Engineering, Vol. 17, No. 5, pp. 601-613, 2005.
[3] R. J. Povinelli and X. Feng, “Data Mining of Multiple Nonstationary Time Series, in Proceedings of Artificial Neural Networks in Engineering”, St. Louis, Missouri, pp. 511-516, 2005.
[4] H. Kantz and T. Schreiber, Nonlinear Time Series Analysis, Cambridge: Cambridge University Press, 388 p., 1997.
[5] J. Han and M. Kamber , Data Mining: Concepts and Techniques, San Francisco: Academic Press, 800 p.,2005
[6] S.M. Weiss and N. Indurkhya, Predictive Data Mining: A practical Guide. San Fransisco: Morgan Kaufmann., 228 p., 1998.
[7] F. Takens, “Detecting Strange Attractors in Turbulence, presented at the Dynamical Systems and Turbulence”, Warwick, U.K, 1981.
[8] E. Keogh and P. Smyth, “A Probabilistic Approach to Fast Pattern Matching in Time series Databases”, in proc. Third Int’l Conf. Knowledge Discovery and Data Mining, 1997.
[9] E. Keogh, “A fast and Robust Method for Pattern Matching in Time Series Databases”, in proc. Ninth Int’l conf. Tools with Artificial Intelligence (TAI’97), pp. 578-584, 1997.
[10] Y. S. Moon and K. Young Whang, W. Kee Loh, “Efficient time-series subsequence matching using duality in constructing windows”, Information Systems, Vol. 26, pp 279-293, 2001.
[11] R. Povinelli, J. Bangura, N. Demerdash, and R. Brown, “Diagnostics of Bar and End-Ring Connector Breakage Faults in Polyphase Induction Motors Through a Novel Dual Track of Time-Series Data Mining and Time-Stepping Coupled FE-State Space Modeling,” IEEE Transactions on Energy Conversion, Vol. 17, No. 1, pp. 39-46, 2002.
[12] C., Yeh, R. J. Povinelli, B. Mirafzal and N. A. O. Demerdash, “Diagnosis of Stator Winding Inter-Turn Shorts in Induction Motors Fed by PWM-Inverter Drive Systems Using a Time-Series Data Mining Technique”, in proceedings of Power System Technology, pp.891-896, 2004.
[13] M. T. Hagan, H. B. Demuth and M. H. Bale, Neural Network Design, Boston: PWS Publishing, 736 p., 1996.
[14] C. Faloutsos, M. Ranganathan, and Y. Manolopoulos, “Fast Subsequence Matching in Time-Series Databases” Proc. Sigmod Record (ACM Special Interest Group on Management of Data Conf.), pp. 419-429, 1994.
[15] R. J., Povinelli and X., Feng, “A New Temporal Pattern Identification Method for Characterization and Prediction of Complex Time Series
Events”, IEEE Trans. On Knowledge and Data Engineering, Vol. 15, No. 2, pp. 339-352, 2003.
[16] H. Furuta and Y. Nomura “Time Series Prediction of Earthquake Input by using Soft Computing”, proc of the Fourth International Symposium on Uncertainty Modeling and Analysis (ISUMA’03), pp. 351-356, 2003 [17] E. Bradley, Analysis of Time Series- An Introduction to Intelligent Data
Analysis, M. Berthold and D. Hand, eds., pp. 167-194, New York: Springer, 1999.
[18] L., Zadeh, “Fuzzy Sets”, Information and Control, Vol. 8, pp. 338-353, 1965.
I. Aydin (M’2006) was born in Elazig, Turkey, in 1981. He received the BS and MS degree in computer engineering from University of Firat, Elazig, Turkey, in 2001 and 2006, respectively. He is currently working toward PhD degree in Department of Electrical-Electronic Engineering, Firat University, Elazig, Turkey. From 2001 to 2006, he was with the University of Firat as a lecturer. He is working as a lecturer in Erzincan University. His research interests are soft computing, fault diagnosis, signal processing and data mining.
M. Karakose was born in Elazig, Turkey, 1976. He received the BS and MS degree in electrical–electronic engineering and computer engineering departments from Firat University, Elazig, Turkey in 1998 and 2001, respectively. He received PhD degree in electrical-electronic engineering from University of Firat, Elazig, Turkey, 2005. He is currently an Assistant professor with computer engineering department, firat university, Elazig, Turkey. His main research interests are in fuzzy control and digital control of variable-speed ac drives.
E. Akin was born in Erzincan, Turkey, 1963. He received the BS and MS degrees in electrical engineering from Firat University, Elazig, Turkey in 1984 and 1987 respectively, and the PhD degree in the area of ac drives from Firat University, Elazig, Turkey in 1994. He was with the Department of Electrical Engineering, Firat University, first as Assistant professor and then as a Associate profersor of electrical machines. He is currently a Full Professor of computer engineering with university of firat, Elazig, Turkey. His main research interests are in power electronics, digital control of variable-speed ac drives, fuzzy control and soft computing techniques.