doi:10.1093/ntr/ntw235 Original investigation Received October 13, 2015; Editorial Decision September 2, 2016; Accepted September 19, 2016
Published by Oxford University Press on behalf of the Society for Research on Nicotine and Tobacco 2016. This work is written by (a) US Government employee(s) and is in the public domain in the US.
826
Original investigation
Synergistic and Non-synergistic Associations for
Cigarette Smoking and Non-tobacco Risk Factors
for Cardiovascular Disease Incidence in the
Atherosclerosis Risk In Communities (ARIC) Study
Jay H. Lubin PhD
1, David Couper PhD
2, Pamela L. Lutsey PhD
3,
Hiroshi Yatsuya MD, PhD
41Biostatistics Branch, Division of Cancer Epidemiology and Genetics, US National Cancer Institute, National Institutes of Health, Bethesda, MD; 2Gillings School of Global Public Health, University of North Carolina, Chapel Hill, NC; 3Division of Epidemiology and Community Health, University of Minnesota School of Public Health, Minneapolis, MN; 4Department of Public Health, Fujita Health University School of Medicine, Kutsukake-cho, Japan
Corresponding Author: Jay H. Lubin, PhD. Biostatistics Branch, Division of Cancer Epidemiology and Genetics, US National Cancer Institute, 9609 Medical Center Drive, SG/Room 7E614, Bethesda, MD 20892, USA. Telephone: 240-276-7426; E-mail: [email protected]
Abstract
Introduction: Cigarette smoking, various metabolic and lipid-related factors and hypertension are well-recognized cardiovascular disease (CVD) risk factors. Since smoking affects many of these factors, use of a single imprecise smoking metric, for example, ever or never smoked, may allow residual confounding and explain inconsistencies in current assessments of interactions.
Methods: Using a comprehensive model in pack-years and cigarettes/day for the complex smok-ing-related relative risk (RR) of CVD to reduce residual confounding, we evaluated interactions with non-tobacco risk factors, including additive (non-synergistic) and multiplicative (synergistic) forms. Data were from the prospective Atherosclerosis Risk in Communities (ARIC) Study from four areas of the United States recruited in 1987–1989 with follow-up through 2008. Analyses included 14 127 participants, 207 693 person-years and 2857 CVD events.
Results: Analyses revealed distinct interactions with smoking: including statistical consistency with additive (body mass index [BMI], waist to hip ratio [WHR], diabetes mellitus [DM], glucose, insulin, high density lipoproteins [HDL] and HDL(2)); and multiplicative (hypertension, total cho-lesterol [TC], low density lipoproteins [LDLs], apolipoprotein B [apoB], TC to HDL ratio and HDL(3)) associations, as well as indeterminate (apolipoprotein A-I [apoA-I] and triglycerides) associations.
Conclusions: The forms of the interactions were revealing but require confirmation. Improved under-standing of joint associations may help clarify the public health burden of smoking for CVD, links between etiologic factors and biological mechanisms, and the consequences of joint exposures, whereby syner-gistic associations highlight joint effects and non-synersyner-gistic associations suggest distinct contributions.
Introduction
Cigarette smoking and various non-tobacco factors (eg, metabolic and lipid-related factors and hypertension) are well-recognized risk factors for cardiovascular disease (CVD).1–4 Evaluations of joint
relative risks (RRs) for cigarette consumption and non-tobacco factors are complicated since smoking affects many of these fac-tors.5–14 Previous analyses of interactions have computed RRs for
non-tobacco factors by smoking status or broad categories of ciga-rettes/day.15–32 Since a single imprecise metric does not fully
charac-terize smoking-related risks, residual confounding from incomplete account of smoking may have influenced previous assessments of interaction.
In contrast, use of a comprehensive model that more com-pletely characterizes smoking-related CVD risks reduces residual confounding and thus enables a more complete description of the joint association between smoking exposure and non-tobacco risk factors. In particular, an enhanced characterization of smoking risks improves the ability to assess synergistic and non-synergis-tic associations, which may help clarify the public health burden of smoking and links between etiologic factors and biological mechanisms.
Investigators often cross-tabulate RRs for two factors with never-smokers as the referent group to improve characterization of smoking-related disease risk; however, the choice is usually cig-arettes/day and duration of smoking, which leads to problems of interpretation.33–35 For example, in a simple log-linear RR model
with cigarettes/day and duration, the cigarettes/day parameter rep-resents a unit increase in the ln(RR) per cigarette/day with dura-tion held fixed. Since duradura-tion is fixed, RRs for increasing cigarettes/ day necessarily embed increasing total pack-years. Consequently, for 30 years of smoking, a comparison of RRs at 20 and 30 cigarettes/ day reflects not only different smoking rates but also different total exposures, that is, 30 and 45 pack-years, respectively, or 110 000 (≈15 × 20 × 365.25) additional cigarettes. Hence, the cigarettes/day and duration parameters are not interpretable as distinct, unrelated effects.
In contrast, we analyze RRs for pack-years and cigarettes/day, so that smoking rate represents a modifier of RR trends with pack-years. Using data from the Atherosclerosis Risk in Communities (ARIC) Study, we developed a comprehensive two-parameter model in pack-years and cigarettes/day that describes smoking-related RRs of CVD36 (Supplementary Material).
This approach allows a more direct interpretation of results, as the differential in the RRs at a fixed pack-years when delivered at lower smoking rates for longer durations or higher rates for shorter durations, or alternatively the cigarettes/day effect defines the rela-tive influence of exposure accrual on the RR at a given pack-years. This approach reinterprets RRs for cigarettes/day as a “delivery rate effect.” In the current paper, we use this model for the complex smoking-related risks of CVD and evaluate the joint interaction of smoking with selected non-tobacco risk factors.
A non-synergistic relationship for two factors occurs when the excess disease rate for exposure to both factors compared to the disease rate in the absence of both factors equals the sum of the individual excess rates at the referent level of the other.37,38 This is
often termed an additive relationship. In contrast, when the excess disease rate with both exposures is greater than (less than) the sum of the excess for each factor the relationship is termed synergistic (antagonistic). For RRs, a joint excess RR (ERR) that equals the additive ERR of each factor defines a non-synergistic (additive)
relationship, while any joint ERR that is greater than (less than) the individual additive ERRs describes a synergistic (antagonistic) relationship. Since the precise extent of any departure from addi-tivity is unspecified, a multiplicative association, in which the joint RR equals the product of factor-specific RRs, represents one type of synergistic relationship. Additive and multiplicative associations represent signpost models on a continuum, which ranges from sub-additive to supra-multiplicative. A synergistic association highlights the potential importance of both factors, while a non-synergistic association suggests distinct risk contributions.
Material and Methods
Study DesignThe ARIC Study is an ongoing cohort study conducted in four areas of the United States: Forsyth County, North Carolina; Jackson, Mississippi; Washington County, Maryland; and the northwest suburbs of Minneapolis, Minnesota. Enrollment occurred between 1987 and 1989 using a probability-based sample of adults aged 45–64 years. See references for details.39–42 Study personnel collected
data from clinical examinations and personal interviews at enroll-ment and at three clinic visits: 1990–1992 (visit 2), 1993–1995 (visit 3) and 1996–1998 (visit 4). Annual telephone calls solicited informa-tion from participants or surrogates on vital status, hospital visits and other factors.
For current analyses, the outcome of interest is CVD, which encompasses coronary heart disease (CHD) and stroke.42 We
ascer-tained outcome information through annual telephone interviews, hospital discharge records in study areas and death certificates. Outcomes were validated by examination of hospital records, death certificates and, when available, autopsy records and classified according to ARIC Study criteria.42 A validated, definite or probable
hospitalized myocardial infarction, a definite CHD death, an unrec-ognized myocardial infarction defined by electrocardiographic read-ing, or coronary revascularization defined CHD.41 A stroke event
comprised a validated, definite or probable hospitalized ischemic or hemorrhagic stroke.
Enrollment questionnaires and clinic visits provided information on smoking status and cigarettes/day, while annual telephone con-tacts provided information on smoking status only. For cigarettes/ day, we used enrollment information, since time-dependent data were limited and follow-up was short relative to total smoking dura-tion. At enrollment there were 26.3% current smokers, half of whom subsequently ceased smoking. Among continuing smokers, smoking rate changed minimally with follow-up. Clinic questionnaires and annual telephone contacts yielded time-dependent information on smoking status, which enabled time-dependent calculations of smok-ing duration, pack-years and time since cessation.
We conducted a 12-hour fasting blood collection and measured glucose and plasma total cholesterol (TC) by standard enzymatic methods at a centralized laboratory facility using a common pro-tocol. We designated diabetes occurrence as a self-reported his-tory of, or treatment for, diabetes, a fasting glucose level ≥126 mg/ dL (7.0 mmol/L), or a random blood glucose level ≥200 mg/dL (11.1 mmol/L).42 We assayed low density lipoprotein (LDL), TC,
triglycerides (TRIG), high density lipoprotein (HDL), HDL sub-frac-tions HDL(2), HDL(3), apolipoprotein A-I (apoA-I) and apolipopro-tein B (apoB) as described previously.22,43 We defined hypertension
We followed participants who were CVD free at enrollment through the earliest date of CVD diagnosis, death, loss to follow-up or December 31, 2008. The initial dataset included 14 878 sub-jects and 3603 CVD events, from which we excluded 751 (5.0%) participants who were missing enrollment data, including 212 CVD (5.9%) events. Missing information arose primarily from smoking (247 subjects and 59 CVD cases), lipid measurements (228 subjects and 64 cases), body mass index (BMI) and diabe-tes diagnosis (43 subjects and 15 cases), alcohol use (78 subjects and 24 cases) and other variables (155 subjects and 50 cases). We limited analyses to white and African American participants, omitting 42 participants of other racial or ethnic groups (eight CVD events) and leaving 14 085 participants, 3383 CVD events and 231 293 person-years. Since there were baseline data on meta-bolic and lipid variables on nearly all participants and since the study did not ascertain all variables at every clinic visit, we used enrollment values for non-tobacco variables. Because smoking status may affect many of these factors, we censored follow-up when a participant changed baseline smoking status. For smok-ing variables, we calculated time-dependent cessation and dura-tion of smoking, which allowed time-dependent pack-years. The censoring excluded person-time and CVD events that occurred after a post-enrollment change in smoking status. The final dataset included 2857 CVD events and 207 686 person-years.
The institutional review board of each participating university approved the study protocol; including the Coordinating Center, University of North Carolina at Chapel Hill, Public Health-Nursing Institutional Review Board (IRB); Forsyth County field center, Wake Forest University IRB; Jackson field center, University of Mississippi IRB; Minnesota field center, University of Minnesota IRB: Human Subjects Protection Program; and Washington County field center, Johns Hopkins Bloomberg School of Public Health IRB. The Special Studies IRB of the National Cancer Institute approved the current protocol and transfer of data to the Division of Cancer Epidemiology and Genetics. All subjects gave written informed consent.
Data Structure
We fitted Poisson regression models to data cross-classified into a multi-way table defined by attained age (<54, 54–55, …, 78–79, ≥80), calendar period (<1990, 1990–1994, 1995–1999, 2000–2004, 2005–2009), birth year (<1930, 1930–1934, 1935–1939, ≥1940), study site, sex, race (white, African American), BMI (<25.0, 25.0– 29.9, 30.0–34.9, ≥35.0 kg/m2), alcohol consumption in gm-ethanol/ wk (<40, 40–107, ≥108), hypertensive status, diabetes mellitus sta-tus (DM), TC (<5.2, 5.2–6.1, ≥6.2 mmol/L), ever use of cigars/pipes, education (<12 years, high/vocational school, college/graduate/pro-fessional school), cigarettes/day (0, 1–4, 5–9, …, 45–49, ≥50), pack-years (0, 1–9, 10–19, 20–24, …, 55–59, ≥60) and pack-years since last smoked (<1, 1–4, 5–9, 10–19, ≥20). Additional variables included waist to hip ratio (WHR), LDL, TRIG, apoB, apoA-I, glucose, insu-lin, HDL, HDL(2), HDL(3) and TC/HDL. For each cell of the multi-way table, we tabulated person-years, CVD events and person-years weighted means for continuous variables.
RR Models
Our goal was to characterize the joint RR of smoking and risk factor (x). We specified the RR of smoking as RR(d,n,y) using pack-years (d), cigarettes/day (n) and years since last smoked (y), and the RR for
x as RR(x). Initially, we assumed that x was categorical with F levels.
In a non-synergistic or additive association, the ERR for smoking and x add, that is,
RR
(
d n y x, , ,)
− =1{
RR(
d n y, ,)
−1}
+{
RR( )
x −1}
or alternatively
RR
(
d n y x, , ,)
=RR(
d n y, ,)
+RR( )
x −1 (1) Here, the contribution to the disease rate from one factor does not impact the contribution of other factor. In a multiplicative relation-ship, the individual RRs multiple, that is,RR
(
d n y x, , ,)
=RR(
d n y, ,)
×RR( )
x (2) The contribution to the disease rate of one factor depends on the level of the other factor, reflecting a type of synergistic association.Characterization of a joint relationship, for example, multiplica-tive or addimultiplica-tive, is distinct from patterns of RRs for the individual factors.44 Typically, the multiplicative and additive models include
the same numbers of parameters and thus are not nested. We utilized two approaches to embed these forms within a larger class of mod-els. We first applied a geometric mean mixture:
RR( , , , )d n y x =RR
(
d n y, ,)
×RR( )
xλ×RR(
d n y, ,)
+RR( )x −1(1−λ))(3)
where λ is the mixing parameter. We used the likelihood ratio with 1 degree-of-freedom to test the multiplicative (λ = 1) or additive (λ = 0) form relative to equation 3 and a profile likelihood to determine the 95% confidence interval (CI) for λ.
A second approach used a “full” interaction model. For categori-cal x, we fitted different smoking-related parameters for RRf( , , )d n y at each of F levels of x,
RR
(
d n y x, , ,)
=1+∑
f{
RRf(
d n y, ,)
−1}
×RR( )
x (4)where RRf( , , )d n y = 1 for d = 0 or x not at level f, and used a likeli-hood ratio to test multiplicative and additive forms, since equation 4 embedded each. Our previous analysis found that the RRs for pack-years relative to never smokers increased linearly, but only within categories of cigarettes/day36 (Supplementary Material). This led to
a two-parameter model for the RR of CVD in pack-years (d) and cigarettes/day (n), which we augmented to incorporate years since last smoked (y) in categories (<1, 1–9 and ≥10 years). We fitted:
RR( , , )d n y = +1 βd ng
( )
h( )ywhere g( )n =exp{γln( )}n =nγ and where h y exp y j j j
( )
=(
∑
θ)
withyj an indicator variable for category j and exp( )θj represented the time since cessation effect on the strength of the pack-years associa-tion, with θ1=0 for identifiability. At n cigarettes/day, β g(n) was the linear slope, that is, the ERR per pack-year, which represented the strength of association. For factor x, we used the exponential form,
RR( )x =exp
(
∑
fϕfxf)
, with ϕ1=0 for identifiability.Inference was similar for equations 3 or 4. Using the Akaike Information Criterion (AIC),45 equation 3 was preferred over
not depend on referent level, suggesting the choice of referent did not affect inference for these signpost models.
For the additive, multiplicative, full and geometric mixture mod-els, equations 1–4, respectively, we designated the minimum AIC as the preferred model. However, a preferred model did not imply that other models were statistically inconsistent with the data. If neither the additive nor the multiplicative model was rejected (or nearly rejected) relative to equation 3, then we designated the joint associa-tion as “indeterminate.” Finally, we adapted the RR funcassocia-tions for a continuous modifier x and presented results in Supplementary Tables S4 and S5.
We used the Epicure software for analyses.46
Models adjusted for study site, sex, birth year, race, BMI, edu-cational level, gm-ethanol/wk (never and tertiles based on cases), hypertensive status, diagnosed DM, TC and an indicator variable for cigar/pipe use in never-cigarette smokers. We adjusted for attained age with four variables, continuous age and its natural logarithm separately for males and females. For lipid-related variables, we replaced TC with the variable under consideration. For complete-ness, Supplementary Table S1 provides descriptive statistics for selected adjustment variables (site, sex, race, birth year, education and alcohol use).
Results
Joint RRs for Pack-Years and Cigarettes/Day
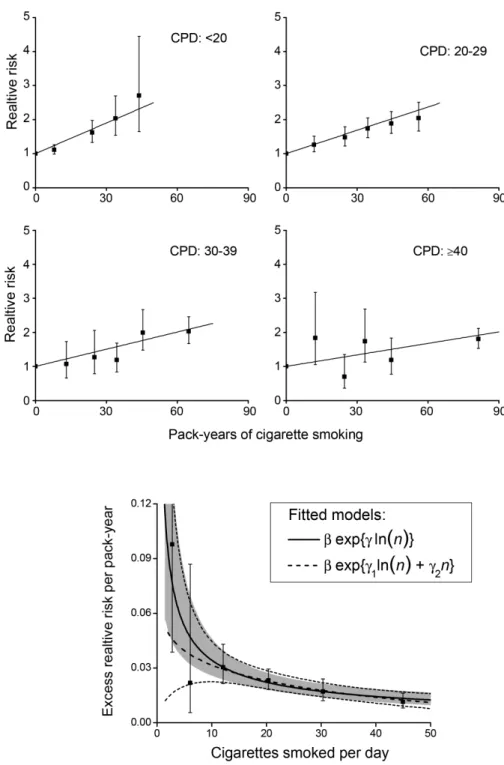
RRs increased linearly with pack-years within categories of ciga-rettes/day (Figure 1, upper panels). Slope estimates of the ERR/pack-year were 0.030, 0.023, 0.017 and 0.011 for categories 1–19, 20–29, 30–39 and ≥40 cigarettes/day, respectively, exhibiting a decreasing strength of association with increasing cigarettes/day (p < .01 for the test of γ = 0 in equation 5). Figure 1 (lower panel), with additional categories, shows the inverse pattern across the full range of ciga-rettes/day. As a result, for equal pack-years smoking fewer cigarettes/ day for longer duration was more deleterious than smoking more cigarettes/day for shorter duration. For example, for 50 pack-years (≈365 000 cigarettes), estimated RRs of CVD using 20 cigarettes/day for 50 years or 30 cigarettes/day for 33.3 years or 50 cigarettes/day for 20 years were 2.1, 1.9 and 1.6, respectively. These values differed slightly from earlier results36 due to the censoring restriction.
Effect Modification: Smoking and Non-tobacco Risk Factors
As expected, RRs increased significantly with hypertension, BMI, WHR, DM, and levels of glucose and insulin (Table 1). After adjust-ment for non-tobacco risk factors (see footnote a), within categories of each risk factor, RR trends with pack-years generally increased, with trends diminishing at higher categories, suggestive of a sub-multiplicative association. Note that the apparent steeper trend in normotensives resulted from the difference between never and ever smokers; among smokers RR trends by pack-years were similar. Using equation 5, the estimated ERR/pack-year at 20 cigarettes/day was similar by hypertensive status, and generally declined for the other factors, reflecting reduced strengths of association. The joint association of smoking and hypertension was consistent with a multiplicative model and rejected an additive. Joint associations for BMI, WHR, DM, glucose and insulin were consistent with additive (non-synergistic) relationships, and rejected or nearly rejected (for BMI and WHR) multiplicative associations.
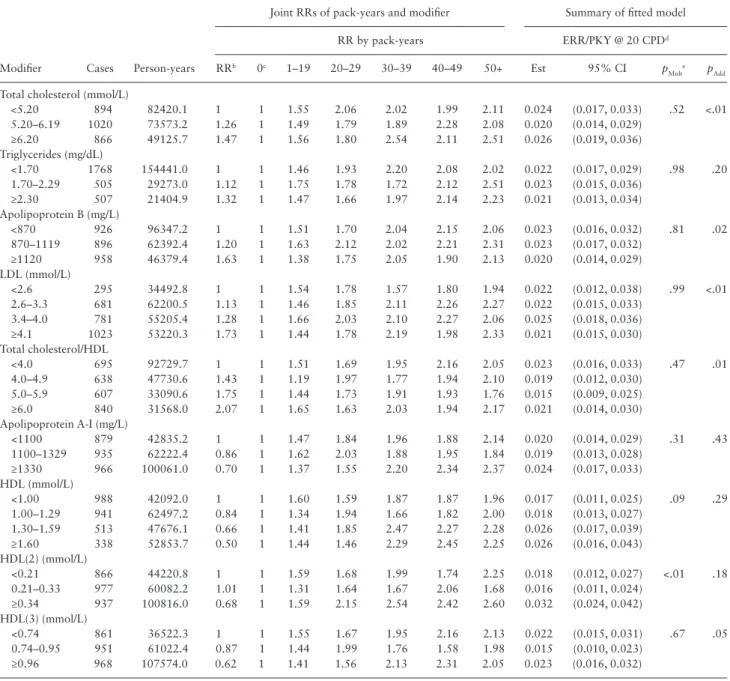
RRs increased significantly with TC, TRIG, apoB, LDL, and TC/ HDL. Within each category, RR trends increased with pack-years (Table 2). The fitted estimates of ERR/pack-year at 20 cigarettes/ day were similar across levels, suggesting comparable trends with pack-years (Table 2) and a multiplicative joint association. Formally, hypothesis tests rejected additive models for smoking and TC, apoB, LDL, and TC/HDL. The smoking and TRIG association was inde-terminate, that is, consistent with both multiplicative and additive relationships.
RRs decreased significantly with apoA-I, HDL, HDL(2) and HDL(3). For apoA-I and cigarette smoking, the joint association was consistent with additive (p = .43) and multiplicative forms (p = .31) and thus indeterminate. For HDL and HDL(2), the associations were consistent with additive models and nearly rejected (p = .09) or rejected (p < .01) multiplicative models, respectively. For HDL(3) and smoking, a multiplicative model was consistent, while an addi-tive association was rejected.
We provided additional results in Supplementary Tables S2–S5 and graphical representations in Supplementary Figures S1–S15.
Discussion
Cigarette smoking, hypertension and various metabolic and lipid-related factors are well-recognized CVD risk factors.1–4 Analyses of
joint effects of smoking and non-tobacco factors are complicated by smoking affecting many of these factors.5–14 The purpose of our
analysis was to overcome previous limitations of assessments of interaction, namely, use of an incomplete characterization of the smoking and CVD relationship, resulting in residual confounding and uncertain interpretations.
Previous Analyses of Smoking and Non-tobacco Risk Factors
The most consistent finding for joint RRs for smoking and non-tobacco risk factors has been a multiplicative association for smok-ing status and blood pressure (defined through either systolic blood pressure or use of antihypertensive drugs) from observational studies in Sweden,30 in Chinese men and women,18,47 and in the
EPOCH-JAPAN study of 10 cohorts,29 as well as one of its constituent
stud-ies.24 A meta-analysis of randomized clinical trials of blood pressure
lowering drugs observed a similar proportional reduction in CVD risk per 5 mmHg lowering of systolic blood pressure across strata defined by baseline 5-year predicted CVD risk, where the prediction equation included current smoking and other factors.48 These
pat-terns suggested a synergistic relationship, in particular multiplicative joint effects, consistent with our findings.
Results from analyses of interactions of smoking and metabolic factors have varied. Studies reported RRs for BMI were similar by smoking status or levels of cigarettes/day,17,24,30,32 suggestive of a
multiplicative association, while others reported RRs for BMI were greater in nonsmokers,49–51 suggestive of a sub-multiplicative
asso-ciation. A Finnish study reported RRs for WHR were similar by smoking status.52 RRs for diabetes were similar by smoking status
in a Japanese cohort study,24 while RRs for increased glucose were
greater in smokers.32 Because small numbers often limit individual
studies, pooled or meta-analyses are typically the most informa-tive. In a meta-analysis of 38 cohorts from the Asia-Pacific region, estimates of RR per unit BMI were significantly greater in current smokers than in non-smokers,16 suggestive of a supra-multiplicative
found that the RR was greater in nonsmokers than in smokers,20
suggestive of a sub-multiplicative/supra-additive association. Studies have also examined joint RRs for smoking and lipid-related factors. Analyses of ARIC data with follow-up through 2002 and 932 CHD events and of the MRFIT study with 428 CHD events reported RRs for smoking and LDL were consistent with multiplica-tive joint associations.21,32 For smoking and TC, RRs were reported
consistent with multiplicative23,26,27 and supra-multiplicative
asso-ciations.24,25 There have been several pooled and meta-analyses of
smoking and lipid-related variables.15 In both the EPOCH-JAPAN
pooling29 and a meta-analysis of 61 western European and North
American cohorts,31 RRs by TC did not differ by smoking status,
concordant with our multiplicative joint association. A meta-analy-sis of 34 cohort studies from the Asia-Pacific region found that the RR per unit increase in TC and unit decrease in HDL were signifi-cantly greater in current smokers than in nonsmokers,28 suggesting
supra-multiplicative joint associations; however, a companion analy-sis using categories for TC and for HDL suggested homogeneity by Figure 1. Joint relative risk (RR) of cardiovascular disease for categories of pack-years (solid symbol) and cigarettes/day relative to never-smokers and fitted linear models (solid line) (upper panels). Lower panel shows estimated excess relative risk per pack-year (ERR/PKY) for cigarettes/day categories (solid symbol),
with <20 further split into 1–4, 5–9, 10–19 cigarettes/day, and fitted models for continuous pack-years and cigarettes/day (n) with pointwise 95% confidence
smoking status. Thus, results for smoking by LDL and by TC, but not by HDL, were in general agreement with our findings.
Current Analyses of Smoking and Non-tobacco Risk Factors
The varied results reported to date make definitive interpretations difficult. Differences may have arisen from the diverse populations, small numbers of CVD events in individual studies or residual confounding from the use of smoking status or broad categories of cigarettes/day, metrics that do not fully characterized smoking risk. Our analysis represents the first systematic evaluation to apply
a comprehensive model for the relationship of smoking and vari-ous non-tobacco risk factors to examine synergistic/non-synergistic associations.36 Results revealed consistency of a multiplicative
asso-ciation for smoking and hypertension, additive (non-synergistic) associations for smoking and BMI, WHR, DM, glucose and insulin levels (Table 3). Tests rejected multiplicative forms for DM, glucose and insulin, while results for BMI and WHR were less definitive. Notably, these variables had only modest positive correlations. In current smokers, Pearson correlation coefficients were ρ = 0.49 for BMI and WHR, ρ = 0.29 for glucose and insulin and ρ ≤ 0.20 for others (Supplementary Table S6).
Table 1. Joint Relative Risk (RR) of Cardiovascular Disease (CVD) for High Blood Pressure, Body Mass Index (BMI), Waist to Hip Ratio, Previously Diagnosed Diabetes Mellitus (DM), Glucose and Insulin and Pack-years, and the Estimated Excess Relative Risk per Pack-year
(ERR/PKY) at 20 Cigarettes/Day (CPD)a
Joint RRs of pack-years and modifier Summary of fitted model
RR by pack-years ERR/PKY @ 20 CPDd
Modifier Cases Person-years RRb 0c 1–19 20–29 30–39 40–49 50+ Est 95% CI p
Multe pAdd
None 2857 207686.0 1 1.52 1.82 2.07 2.11 2.17 0.022 (0.018, 0.027)
Hypertension
No 1414 141115.0 1 1 1.81 1.93 2.39 2.38 2.33 0.024 (0.018, 0.031) .29 .02
Yes 1443 66570.4 2.04 1 1.28 1.73 1.79 1.87 2.03 0.020 (0.015, 0.027)
BMIf
<25 683 69204.9 1 1 1.45 2.24 2.47 2.36 2.33 0.028 (0.020, 0.039) .08 .61
25–29 1221 82134.8 1.28 1 1.41 1.82 1.93 1.90 2.18 0.019 (0.014, 0.027)
30–34 646 37451.4 1.33 1 1.64 1.64 1.96 2.35 1.89 0.022 (0.014, 0.033)
≥35 307 18894.5 1.44 1 1.71 1.18 1.83 1.58 2.34 0.018 (0.008, 0.038)
Waist to hip ratiog
I 329 49091.4 1 1 1.29 2.01 2.63 2.48 2.02 0.031 (0.019, 0.049) .09 .77
II 1248 97518.5 1.25 1 1.42 1.85 1.93 2.07 2.11 0.021 (0.015, 0.028)
III 1280 61075.7 1.40 1 1.62 1.65 1.98 1.96 2.10 0.019 (0.014, 0.026)
DM
No 2196 188988.9 1 1 1.55 2.00 2.23 2.30 2.31 0.026 (0.021, 0.032) <.01 .99
Yes 687 20310.4 2.57 1 1.45 1.33 1.62 1.52 1.74 0.010 (0.005, 0.020)
Glucose (mmol/L)
<5.6 1229 119622.3 1 1 1.61 2.05 2.29 2.37 2.31 0.027 (0.020, 0.035) <.01 .13
5.6–6.9 1062 73079.5 1.12 1 1.44 1.81 2.07 2.07 2.24 0.023 (0.017, 0.032)
≥7.0 592 16597.2 1.55 1 1.47 1.39 1.63 1.61 1.71 0.011 (0.006, 0.022)
Insulin (pmol/L)
<60 905 93999.3 1 1 1.45 2.32 2.52 2.30 2.32 0.029 (0.021, 0.038) .02 .63
60–104 878 64154.5 1.22 1 1.47 1.90 1.98 2.16 2.10 0.016 (0.003, 0.090)
≥105 1100 51145.1 1.56 1 1.65 1.38 1.78 1.87 2.02 0.017 (0.011, 0.026)
CI = confidence interval. Data from the Atherosclerosis Risk in Communities Study.
aModels adjusted for center, birth year, age, sex, race, education, current alcohol consumption, previous diagnosis of high blood pressure, previous diagnosis of DM,
total cholesterol, BMI, use of cigars or pipe exclusively, and cessation of smoking. RRs based on the cross-classification of pack-years and levels of the factor, and reflect current smokers. The RR trend for each modification variable was statistically significant, p < .05. Numbers of events and person-years vary due to missing data. For all data, numbers of CVD cases for pack-years categories were 1094 (never-smoker), 536, 267, 279, 253 and 428, respectively.
bRRs in relation to the referent category, denoted “1”, and never-smokers with all trends significant. cReferent category of never-smokers within each level of modification variable.
dFor continuous pack-years (d) and cigarettes/day (n) with categorical modifying factor x
f, data fitted using the “full” model, RR( , , , )d n y x =1+
∑
fβfdfex{
γfln( )nf}
exp(
∑
j j jθy)
×exp(
∑
fϕfxff)
.
with fitted ERR/PKY estimate at 20 cigarettes/day computed as ERR(d=1,n=20,y=y1, )xf =βfexp{γfln( )}20 and where yj represents indicator variables for
categories of years since last smoked with exp( )θj the effect with θ1 set to 0 for identifiability for current smokers. ep values, p
Mult, and pAdd, for test of consistency of a multiplicative (λ = 1) or additive (λ = 0) model, respectively, for the joint association of smoking and categories
of the modification variable, xf, using the geometric mean mixture model.
RR( , , , )d n y x =
{
1+βd g( )nexp(
∑
j jθ yj)
}
×exp(
∑
fϕfxf)
× βd g(n λ))ex
(
∑
)
+exp(
∑
)
( )
−
j jθ yj fϕfxf λ 1
fBMI, body mass index.
gCategories for waste to hip ratio: I, ≤0.90 for males and ≤0.85 for females; II and III, category cut-point defined by median of CVD cases, 0.98 for males and
Table 2. Joint Relative Risk (RR) of Cardiovascular Disease (CVD) by Pack-years With Never Cigarette Smokers as Referent, Model Parameter Estimates and the Fitted Excess Relative Risk per Pack-year (ERR/PKY) at 20 Cigarettes/Day (CPD) for Levels of Lipid
Biomarkersa
Joint RRs of pack-years and modifier Summary of fitted model
RR by pack-years ERR/PKY @ 20 CPDd
Modifier Cases Person-years RRb 0c 1–19 20–29 30–39 40–49 50+ Est 95% CI p
Multe pAdd
Total cholesterol (mmol/L)
<5.20 894 82420.1 1 1 1.55 2.06 2.02 1.99 2.11 0.024 (0.017, 0.033) .52 <.01
5.20–6.19 1020 73573.2 1.26 1 1.49 1.79 1.89 2.28 2.08 0.020 (0.014, 0.029)
≥6.20 866 49125.7 1.47 1 1.56 1.80 2.54 2.11 2.51 0.026 (0.019, 0.036)
Triglycerides (mg/dL)
<1.70 1768 154441.0 1 1 1.46 1.93 2.20 2.08 2.02 0.022 (0.017, 0.029) .98 .20
1.70–2.29 505 29273.0 1.12 1 1.75 1.78 1.72 2.12 2.51 0.023 (0.015, 0.036)
≥2.30 507 21404.9 1.32 1 1.47 1.66 1.97 2.14 2.23 0.021 (0.013, 0.034)
Apolipoprotein B (mg/L)
<870 926 96347.2 1 1 1.51 1.70 2.04 2.15 2.06 0.023 (0.016, 0.032) .81 .02
870–1119 896 62392.4 1.20 1 1.63 2.12 2.02 2.21 2.31 0.023 (0.017, 0.032)
≥1120 958 46379.4 1.63 1 1.38 1.75 2.05 1.90 2.13 0.020 (0.014, 0.029)
LDL (mmol/L)
<2.6 295 34492.8 1 1 1.54 1.78 1.57 1.80 1.94 0.022 (0.012, 0.038) .99 <.01
2.6–3.3 681 62200.5 1.13 1 1.46 1.85 2.11 2.26 2.27 0.022 (0.015, 0.033)
3.4–4.0 781 55205.4 1.28 1 1.66 2.03 2.10 2.27 2.06 0.025 (0.018, 0.036)
≥4.1 1023 53220.3 1.73 1 1.44 1.78 2.19 1.98 2.33 0.021 (0.015, 0.030)
Total cholesterol/HDL
<4.0 695 92729.7 1 1 1.51 1.69 1.95 2.16 2.05 0.023 (0.016, 0.033) .47 .01
4.0–4.9 638 47730.6 1.43 1 1.19 1.97 1.77 1.94 2.10 0.019 (0.012, 0.030)
5.0–5.9 607 33090.6 1.75 1 1.44 1.73 1.91 1.93 1.76 0.015 (0.009, 0.025)
≥6.0 840 31568.0 2.07 1 1.65 1.63 2.03 1.94 2.17 0.021 (0.014, 0.030)
Apolipoprotein A-I (mg/L)
<1100 879 42835.2 1 1 1.47 1.84 1.96 1.88 2.14 0.020 (0.014, 0.029) .31 .43
1100–1329 935 62222.4 0.86 1 1.62 2.03 1.88 1.95 1.84 0.019 (0.013, 0.028)
≥1330 966 100061.0 0.70 1 1.37 1.55 2.20 2.34 2.37 0.024 (0.017, 0.033)
HDL (mmol/L)
<1.00 988 42092.0 1 1 1.60 1.59 1.87 1.87 1.96 0.017 (0.011, 0.025) .09 .29
1.00–1.29 941 62497.2 0.84 1 1.34 1.94 1.66 1.82 2.00 0.018 (0.013, 0.027)
1.30–1.59 513 47676.1 0.66 1 1.41 1.85 2.47 2.27 2.28 0.026 (0.017, 0.039)
≥1.60 338 52853.7 0.50 1 1.44 1.46 2.29 2.45 2.25 0.026 (0.016, 0.043)
HDL(2) (mmol/L)
<0.21 866 44220.8 1 1 1.59 1.68 1.99 1.74 2.25 0.018 (0.012, 0.027) <.01 .18
0.21–0.33 977 60082.2 1.01 1 1.31 1.64 1.67 2.06 1.68 0.016 (0.011, 0.024)
≥0.34 937 100816.0 0.68 1 1.59 2.15 2.54 2.42 2.60 0.032 (0.024, 0.042)
HDL(3) (mmol/L)
<0.74 861 36522.3 1 1 1.55 1.67 1.95 2.16 2.13 0.022 (0.015, 0.031) .67 .05
0.74–0.95 951 61022.4 0.87 1 1.44 1.99 1.76 1.58 1.98 0.015 (0.010, 0.023)
≥0.96 968 107574.0 0.62 1 1.41 1.56 2.13 2.31 2.05 0.023 (0.016, 0.032)
CI = confidence interval; HDL = high density lipoproteins; LDL = low density lipoproteins. Data from the Atherosclerosis Risk in Communities Study.
aModels adjusted for center, birth year, age, sex, race, education, current alcohol consumption, previous diagnosis of high blood pressure, previous diagnosis of
diabetes mellitus, body mass index (BMI) and use of cigars or pipe exclusively, and cessation of smoking and the modification factor. RRs based on the cross-classification of pack-years and levels of the factor, and reflect current smokers. The RR trend for each modification variable was statistically significant, p < .05. Numbers of events and person-years vary due to missing data. For all data, numbers of CVD cases for pack-years categories were 1094 (never-smoker), 536, 267, 279, 253, and 428, respectively.
bRRs in relation to the referent category, denoted “1”, and never-smokers, with all trends significant. cReferent category of never-smokers within each level of modification variable.
dFor continuous pack-years (d) and cigarettes/day (n) with categorical modifying factor x
f, data fitted using the “full” model, RR( , , , )d n y x =1+ ∑fβfdf exp{γfln( )}nf exp
( )
∑j j jθy ×exp(
∑fϕffxf)
.with fitted ERR/PKY estimate at 20 cigarettes/day computed as ERR(d=1,n=20,y=y x1, )f =βfexp{γfln( )}20 and where yj represents indicator variables for
categories of years since last smoked with exp( )θj the effect with θ1 set to 0 for identifiability for current smokers. ep values, p
Mult, and pAdd, for test of consistency of a multiplicative (λ = 1) or additive (λ = 0) model, respectively, for the joint association of smoking and categories
of the modification variable, xf, using the geometric mean mixture model.
RR( , , , )d n y x =
{
1+βd g( )nexp(
∑
j jθ yj)
}
×exp(
∑
fϕfxf)
× βd g(n λ))exp
(
∑
)
+exp(
∑
)
( )
−
Among lipid-related factors, joint RRs were consistent with multi-plicative (synergistic) associations for smoking and TC, apoB, LDL and TC/HDL While correlations for TC and LDL (ρ = 0.92) and for LDL and apoB (ρ = 0.74) were high, other correlations for these variables were lower (Supplementary Table S6). While correlation coefficients for apoA-I, HDL, HDL(2) and HDL(3) were 0.49 and higher, interactions of smoking and HDL-related factors varied. The joint RRs for smoking
and HDL and HDL(2) were consistent with additive (non-synergistic) associations,, while the joint association for smoking and HDL(3) was consistent with a multiplicative association. Joint associations for smok-ing and TRIG and for smoksmok-ing and apoA-I were indeterminate.
Physiologic Evidence for Joint Associations
Smoking affects CVD risk through several mechanisms, includ-ing endothelial dysfunction, platelet activation, increased oxidative stress, increased inflammation and modification of lipid profiles.53–56
Meanwhile, mechanisms that associate diabetes-related factors with accelerated atherosclerosis and increased CVD risk likely involve insulin resistance and chronic hyperglycemia.57,58 This suggests
dis-tinct pathways, which generally conform to our observation of non-synergistic associations. The multiplicative association for smoking and TC and LDL-related factors may result from actions at different points within a common CVD-related process, where for example, TC and LDL influence plaque initiation (earlier atherosclerotic-related events) and smoking modifies plaque progression (advanced athero-sclerotic-related events),15,59 as well as plaque stability.14 This suggests
that smoking may have a greater impact instigating acute coronary events than on general atherogenesis.53 In contrast, the additive
asso-ciation for HDL-related variables may derive from smoking directly influencing HDL levels and the integrity of its effects. Smoking impacts various stages of HDL metabolism, including HDL biosynthesis and maturation, intravascular remodeling of HDL and HDL catabolism.55
A reduction of HDL may attenuate its functionality and anti-athero-genic effects, for example, reducing reverse cholesterol transport and hepatic uptake,55 and its oxidant, inflammatory and
anti-thrombotic effects.60 In addition, smoking mainly reduces HDL(2),
while affecting little change in HDL(3),55 suggesting distinct roles for
smoking relative to HDL(2) and HDL(3), which was consistent with our diverse results for HDL and its sub-fractions.
Limitations
These analyses have several limitations. Results are from a single study and therefore warrant cautious interpretation pending con-firmatory analyses. Although we censored participants at change in smoking status, we used non-tobacco variables that were ascertained at enrollment, while pack-years and years since smoking cessation incorporated time-dependent changes. This distinction is important since potential mechanisms of action for CVD risk from hyperten-sion, metabolic and lipid-related variables can have both acute and chronic components.1,2,14,53 It would therefore worthwhile for future
analyses to incorporate time-dependent measurements of non-tobacco risk factors. In addition, the fitted models reflected observed
Table 3. Summary of Results for Modelsa of the Evaluation of Synergistic/Non-synergistic Relationships for the Joint Association of
Cigarettes Smoking and Non-tobacco Risk Factors for Cardiovascular Disease
Tests of joint association with
smokingb Geometric mixturec
Modifying factor Multiplicative Additive λ 95% CI AIC d pe
Hypertension Accept Reject 0.6 (0.1,1.4) Multiplicative .02 (A)
BMI Accept Accept −0.3 (−1.1,1.3) Additive .08 (M)
Waist to hip ratio Accept Accept −0.1 (−0.9,1.2) Additive .09 (M)
Diabetes mellitus Reject Accept 0.0 (−0.3,0.5) Additive <.01 (M)
Glucose Reject Accept −0.8 (−2.5,0.2) GMIX f <.01 (M)
Insulin Reject Accept −0.2 (−0.7,0.7) Additive .02 (M)
Total cholesterol Accept Reject 1.4 (0.4, 3.7) Multiplicative <.01 (A)
Triglycerides Accept Accept 0.9 (−0.3, 4.3) Multiplicative g .98 (M), .20 (A)
Apolipoprotein B Accept Reject 0.9 (0.1, 2.2) Multiplicative .02 (A)
LDL Accept Reject 1.0 (0.3, 2.5) Multiplicative <.01 (A)
Total cholesterol/HDL Accept Reject 0.7 (0.2, 1.6) Multiplicative .01 (A)
Apolipoprotein A-I Accept Accept 0.4 (−0.6, 1.6) Additive g 0.31 (M), .43 (A)
HDL Accept Accept 0.4 (−0.5, 0.8) Additive .09 (M)
HDL(2) Reject Accept −0.6 (−1.6, 0.3) Additive <.01 (M)
HDL(3) Accept Reject 0.8 (0.1, 1.7) Multiplicative .05 (A)
AIC = Akaike Information Criterion; BMI = body mass index; CI = confidence interval; HDL = high density lipoproteins; LDL = low density lipoproteins.
aResults for tests of consistency of a multiplicative (λ = 1) or additive (λ = 0) model, respectively, using a geometric mixture model for the joint association of
smok-ing and categories of the modification variable (equation 3). Summary of model results from Supplementary Tables S1 and S2.
bp value for the 1-degree of freedom test of an multiplicative or additive model in relation to a geometric mixture model, with “Accept” denoting p > .05 and
“Reject” denoting p ≤ .05.
cMaximum likelihood estimate and likelihood-based 95% CI for the mixing parameter in a geometric mixture model (equation 3), where λ = 1 and λ = 0 define
multiplicative and additive models, respectively.
dPreferred model based on the AIC comparing the full (FULL) (equation 4), geometric mixture (GMIX) (equation 3), multiplicative and additive models (see
foot-notes Tables 1 and 2), with smaller AIC values favored. Designation as a preferred model does not imply statistical rejection of alternative models.
eFor the geometric mixture model with multiplicative (M) and additive (A) relationships as signpost models, p value provides test of rejection of the alternative
signpost relationship, shown in parentheses. If likelihood ratio tests failed or nearly failed to reject both null hypotheses (λ = 0 and λ = 1), we designated the assess-ment of signpost models as indeterminate.
RR patterns using imprecise exposures, which may affect our assess-ment of multiplicative and additive forms, themselves merely sign-post models on a continuum ranging from sub-additive through supra-multiplicative. Furthermore, implications of these models in relation to specific cellular and molecular disease processes are unclear. Nonetheless, the consistency of the observed RR patterns for related variables suggested that results may have expressed underlying processes and highlighted their potential utility for evalu-ating public health effects and improving risk prediction.
Additional concern is that competing risks possibly affected our observed RR patterns for smoking, whereby participants with longer follow-up or lower smoking rate may have increased likelihood of incurring CVD events, while heavier smokers were selectively removed from follow-up due to other diseases. We carried out a competing risk analysis that accounted for smoking-related cancers and found no appreciable difference in results, suggesting minimal impact.
Conclusions
Analysis revealed distinct RR patterns for cigarette smoking and non-tobacco factors, including synergistic/multiplicative (hypertension, TC, LDL, apoB, TC/HDL, HDL(3)), non-synergistic/additive (BMI, WHR, DM, glucose, insulin, HDL, HDL(2)) and indeterminate (apoA-I and TRIG) associations; however, confirmatory analyses are needed. An improved understanding of joint associations among CVD risk factors can clarify the public health burden of smoking on CVD, causal links between etiologic factors and biologic mechanisms, where synergistic associations highlight joint impacts and non-synergistic associations suggest distinct contributions from each factor.
Supplementary Material
Supplementary Table S1–S6 and Figures S1–S15 can be found online at http://www.ntr.oxfordjournals.org
Funding
The Atherosclerosis Risk in Communities Study is carried out as a collabora-tive study supported by National Heart, Lung, and Blood Institute contracts (HHSN268201100005C, HHSN268201100006C, HHSN268201100007C, HHSN268201100008C, HHSN268201100009C, HHSN268201100010C, HHSN268201100011C, and HHSN268201100012C). JHL was supported by the Intramural Research Program of the National Institutes of Health, National Cancer Institute, Division of Cancer Epidemiology and Genetics. The authors maintained full control over the management, analysis and interpreta-tion of the data; the preparainterpreta-tion, review, and approval of the manuscript; and were independent of funders. The authors do not have permission to share the data used in this project, which were sourced from the ARIC Coordinating Center (www2.cscc.unc.edu/aric/).
Declaration of Interests
None declared.
Acknowledgments
The authors thank the staff and participants of the Atherosclerosis Risk In Communities (ARIC) study for their important contributions. DC, as a study PI, designed and directed the ARIC study. JHL developed the current proposal, designed and executed analyses. All authors contributed equally to develop-ment of analytic strategies, interpretation of results and preparation of the manuscript.
References
1. U.S. Department of Health and Human Services. How Tobacco Smoke Causes Disease: The Biology and Behavioral Basis for Smoking-Attributable Disease: A Report of the Surgeon General. Washington, DC: U. S. Department of Health and Human Services, Centers for Disease Control and Prevention, National Center for Chronic Disease Prevention and Health Promotion, Office on Smoking and Health, Superintendent of Documents, U.S. Government Printing Office; 2010.
2. U.S. Department of Health and Human Services. The Health Consequences of Smoking -- 50 Years of Progress: A Report of the Surgeon General. Atlanta, GA: U.S. Department of Health and Human Services, Centers for Disease Control and Prevention, National Center for Chronic Disease Prevention and Health Promotion, Office on Smoking and Health, Superintendent of Documents, U.S. Government Printing Office; 2014. 3. Catapano AL, Reiner Z, De Backer G, et al. ESC/EAS Guidelines for the
management of dyslipidaemias: the task force for the management of dys-lipidaemias of the European Society of Cardiology (ESC) and the European Atherosclerosis Society (EAS). Atherosclerosis. 2011;217(1):3–46. 4. Stone NJ, Robinson JG, Lichtenstein AH, et al. 2013 ACC/AHA Guideline
on the treatment of blood cholesterol to reduce atherosclerotic cardio-vascular risk in adults: A report of the American College of Cardiology/ American Heart Association Task Force on Practice Guidelines. J Am Coll Cardiol. 2014;63(25 Pt B):2889–2934.
5. Muscat JE, Harris RE, Haley NJ, Wynder EL. Cigarette smoking and plasma cholesterol. Am Heart J. 1991;121(1 Pt 1):141–147.
6. Craig WY, Palomaki GE, Haddow JE. Cigarette smoking and serum lipid and lipoprotein concentrations: an analysis of published data. BMJ. 1989;298(6676):784–788.
7. Gepner AD, Piper ME, Johnson HM, Fiore MC, Baker TB, Stein JH. Effects of smoking and smoking cessation on lipids and lipoproteins: outcomes from a randomized clinical trial. Am Heart J. 2011;161(1):145–151. 8. Athyros VG, Katsiki N, Doumas M, Karagiannis A, Mikhailidis DP. Effect
of tobacco smoking and smoking cessation on plasma lipoproteins and associated major cardiovascular risk factors: a narrative review. Curr Med Res Opin. 2013;29(10):1263–1274.
9. Slagter SN, van Vliet-Ostaptchouk JV, Vonk JM, et al. Associations between smoking, components of metabolic syndrome and lipoprotein particle size. BMC Med. 2013;11:195.
10. Gossett LK, Johnson HM, Piper ME, Fiore MC, Baker TB, Stein JH. Smoking intensity and lipoprotein abnormalities in active smokers. J Clin Lipidol. 2009;3(6):372–378.
11. Campbell SC, Moffatt RJ, Stamford BA. Smoking and smoking cessation – the relationship between cardiovascular disease and lipoprotein metabo-lism: a review. Atherosclerosis. 2008;201(2):225–235.
12. Gardner CD, Tribble DL, Young DR, Ahn D, Fortmann SP. Associations of HDL, HDL(2), and HDL(3) cholesterol and apolipoproteins A-I and B with lifestyle factors in healthy women and men: the Stanford Five City Project. Prev Med. 2000;31(4):346–356.
13. Berlin I, Lin S, Lima JA, Bertoni AG. Smoking status and metabolic syn-drome in the multi-ethnic study of atherosclerosis. a cross-sectional study. Tob Induc Dis. 2012;10(1):9.
14. Csordas A, Bernhard D. The biology behind the atherothrombotic effects of cigarette smoke. Nat Rev Cardiol. 2013;10(4):219–230.
15. Huxley R, Nakamura K, Woodward M. Modification of the effect of lipids on the risk of cardiovascular diseases by cigarette smoking. J Clin Lipidology. 2010;5(3):413–420.
16. Woodward M, Fang X, Gu D, et al. Impact of cigarette smoking on the relationship between body mass index and coronary heart disease: a pooled analysis of 3264 stroke and 2706 CHD events in 378579 individu-als in the Asia Pacific region. BMC Public Health. 2009;9(294):1–11. 17. Chen Z, Yang G, Zhou M, et al. Body mass index and mortality from
ischaemic heart disease in a lean population: 10 year prospective study of 220,000 adult men. Int J Epidemiol. 2006;35(1):141–150.
19. Hillage H. The Emerging Risk Factors Collaboration. Diabetes mellitus, fasting blood glucose concentration, and risk of vascular disease: a col-laborative meta-analysis of 102 prospective studies (vol 375, pg 2215, 2010). Lancet. 2010;376(9745):958–958.
20. Sarwar N, Gao P, Seshasai SRK, et al. Diabetes mellitus, fasting blood glucose concentration, and risk of vascular disease: a collaborative meta-analysis of 102 prospective studies. Lancet. 2010;375(9733):2215–2222. 21. Hozawa A, Folsom AR, Sharrett AR, Payne TJ, Chambless LE. Does
the impact of smoking on coronary heart disease differ by low-density lipoprotein cholesterol level?: the Atherosclerosis Risk in Communities (ARIC) Study. Circ J. 2006;70(9):1105–1110.
22. Whelton SP, Roy P, Astor BC, et al. Elevated high-sensitivity C-reactive protein as a risk marker of the attenuated relationship between serum cholesterol and cardiovascular events at older age. The ARIC Study. Am J Epidemiol. 2013;178(7):1076–1084.
23. Blanco-Cedres L, Daviglus ML, Garside DB, et al. Relation of cigarette smoking to 25-year mortality in middle-aged men with low baseline serum cholesterol: the Chicago Heart Association Detection Project in Industry. Am J Epidemiol. 2002;155(4):354–360.
24. Hata J, Doi Y, Ninomiya T, et al. Combined effects of smoking and hypercholesterolemia on the risk of stroke and coronary heart disease in Japanese: the Hisayama study. Cerebrovasc Dis. 2011;31(5):477–484. 25. Hozawa A, Okamura T, Kadowaki T, et al. Is weak association between cigarette
smoking and cardiovascular disease mortality observed in Japan explained by low total cholesterol? NIPPON DATA80. Int J Epidemol. 2007;36(5):1060–1067. 26. Jee SH, Suh I, Kim IS, Appel LJ. Smoking and atherosclerotic
cardiovascu-lar disease in men with low levels of serum cholesterol: the Korea Medical Insurance Corporation Study. JAMA. 1999;282(22):2149–2155. 27. Jee SH, Park J, Jo I, et al. Smoking and atherosclerotic cardiovascular
disease in women with lower levels of serum cholesterol. Atherosclerosis. 2007;190(2):306–312.
28. Nakamura K, Barzi F, Huxley R, et al. Does cigarette smoking exacerbate the effect of total cholesterol and high-density lipoprotein cholesterol on the risk of cardiovascular diseases? Heart. 2009;95(11):909–916. 29. Nakamura K, Nakagawa H, Sakurai M, et al. Influence of smoking
com-bined with another risk factor on the risk of mortality from coronary heart disease and stroke: pooled analysis of 10 Japanese cohort studies. Cerebrovasc Dis. 2012;33(5):480–491.
30. Nilsson PM, Cederholm J, Eeg-Olofsson K, et al. Smoking as an inde-pendent risk factor for myocardial infarction or stroke in type 2 diabetes: a report from the Swedish National Diabetes Register. Eur J Cardiovasc Prev Rehabil. 2009;16(4):506–512.
31. Lewington S, Whitlock G, Clarke R, et al. Blood cholesterol and vascular mortality by age, sex, and blood pressure: a meta-analysis of individual data from 61 prospective studies with 55000 vascular deaths. Lancet. 2007;370(9602):1829–1839.
32. Shaten BJ, Kuller LH, Neaton JD. Association between base-line risk-fac-tors, cigarette-smoking, and CHD mortality after 10.5 years. Prev Med. 1991;20(5):655–669.
33. Peto J. That the effects of smoking should be measured in pack-years: misconceptions 4. Br J Cancer. 2012;107(3):406–407.
34. Lubin JH, Caporaso NE. Misunderstandings in the misconcep-tion on the use of pack-years in analysis of smoking. Br J Cancer. 2013;108(5):1218–1220.
35. Thomas DC. Invited commentary: is it time to retire the “pack-years” vari-able? Maybe not! Am J Epidemiol. 2014;179(3):299–302.
36. Lubin JH, Couper DJ, Lutsey PL, Woodward M, Yatsuya H, Huxley RR. Smoking fewer cigarettes per day over longer durations is more strongly associated with cardiovascular risk than smoking more cigarettes over shorter durations: results from a prospective cohort study. Epidemiol. 2016;27(3):395–404.
37. Rothman KJ, Greenland S, Lash TL. Modern Epidemiology. 3rd ed. Philadelphia, PA: Lippincott Williams & Wilkins; 2008.
38. Weinberg C. Synergy of exposure effects. In: Armitage P, Colton T, eds. Encyclopedia of Biostatistics. 2nd ed. John Wiley & Sons, Ltd.; 2005. 39. ARIC Investigators. The Atherosclerosis Risk in Communities (ARIC)
Study: design and objectives. Am J Epidemiol. 1989;129(4):687–702.
40. Rosamond WD, Chambless LE, Heiss G, et al. Twenty-two-year trends in incidence of myocardial infarction, coronary heart disease mortal-ity, and case fatality in 4 US communities, 1987-2008. Circulation. 2012;125(15):1848–1857.
41. White AD, Folsom AR, Chambless LE, et al. Community surveillance of coronary heart disease in the Atherosclerosis Risk in Communities (ARIC) Study: methods and initial two years’ experience. J Clin Epidemiol. 1996;49(2):223–233.
42. Huxley RR, Yatsuya H, Lutsey PL, Woodward M, Alonso A, Folsom AR. Impact of age at smoking initiation, dosage, and time since quitting on cardiovascular disease in African Americans and Whites. Am J Epidemiol. 2012;175(8):816–826.
43. Sharrett AR, Patsch W, Sorlie PD, Heiss G, Bond MG, Davis CE. Asssociations of lipoprotein cholesterols, apolipoprotein-A-I and apoli-poprotein-B, and triglycerides with carotid atherosclerosis and coronary heart disease - the Atherosclerosis Risk in Communities (Aric) Study. Arterioscler Thromb. 1994;14(7):1098–1104.
44. Lubin JH. Models for the analysis of radon-exposed populations. Yale J Biol Med. 1988;61(3):195–214.
45. Akaike H. Information theory and an extension of the maximum likeli-hood principal. In: Petrov EB, Csaki F, eds. 2nd Annual Symposium on Information Theory and Control. Budapest, Hungary: Akademia Kiado; 1973:267–281.
46. Preston DL, Lubin JH, Pierce DA, McConney ME. Epicure User’s Guide. Seattle, WA: HiroSoft International Corporation; 2006.
47. Ge Z, Hao Y, Cao J, et al. Does cigarette smoking exacerbate the effect of blood pressure on the risk of cardiovascular and all-cause mortality among hypertensive patients? J Hypertens. 2012;30(12):2307–2313. 48. Sundstrom J, Arima H, Woodward M, et al. Blood pressure-lowering
treat-ment based on cardiovascular risk: a meta-analysis of individual patient data. Lancet. 2014;384(9943):591–598.
49. Tobias DK, Pan A, Jackson CL, et al. Body-mass index and mor-tality among adults with incident type 2 diabetes. N Engl J Med. 2014;370(3):233–244.
50. Meyer HE, Søgaard AJ, Tverdal A, Selmer RM. Body mass index and mortality: the influence of physical activity and smoking. Med Sci Sports Exerc. 2002;34(7):1065–1070.
51. Lawlor DA, Hart CL, Hole DJ, Smith GD. Reverse causality and con-founding and the associations of overweight and obesity with mortality. Obesity. 2006;14(12):2294–2304.
52. Lakka HM, Lakka TA, Tuomilehto J, Salonen JT. Abdominal obesity is associated with increased risk of acute coronary events in men. Eur Heart J. 2002;23(9):706–713.
53. Benowitz NL. Cigarette smoking and cardiovascular disease: patho-physiology and implications for treatment. Prog Cardiovasc Dis. 2003;46(1):91–111.
54. Ambrose JA, Barua RS. The pathophysiology of cigarette smok-ing and cardiovascular disease: an update. J Am Coll Cardiol. 2004;43(10):1731–1737.
55. He BM, Zhao SP, Peng ZY. Effects of cigarette smoking on HDL quan-tity and function: implications for atherosclerosis. J Cell Biochem. 2013;114(11):2431–2436.
56. Armani C, Landini L Jr, Leone A. Molecular and biochemical changes of the cardiovascular system due to smoking exposure. Curr Pharm Des. 2009;15(10):1038–1053.
57. Matheus ASdM, Tannus LRM, Cobas RA, Palma CCS, Negrato CA, Gomes MdB. Impact of diabetes on cardiovascular disease: an update. Int J Hypertens. 2013;2013:653789–653789.
58. Laakso M. Cardiovascular disease in type 2 diabetes from population to man to mechanisms: the Kelly West Award Lecture 2008. Diabetes Care. 2010;33(2):442–449.
59. Sharrett AR, Coady SA, Folsom AR, Couper DJ, Heiss G. Smoking and dia-betes differ in their associations with subclinical atherosclerosis and coro-nary heart disease - the ARIC Study. Atherosclerosis. 2004;172(1):143–149. 60. Berrougui H, Momo CN, Khalil A. Health benefits of high-density