Using Deep Sequencing with a Primer ID to Resolve the Structure of Viral Populations and Reveal Pre-existing Drug Resistance Mutations in the HIV and HCV Protease Genes
Cassandra B. Jabara
A dissertation submitted to the faculty of the University of North Carolina at Chapel Hill in partial fulfillment of the requirements for the degree of Doctor of Philosophy in the Department of Biology
Chapel Hill 2012
Approved by
Abstract
CASSANDRA B. JABARA: Using Deep Sequencing with a Primer ID to Resolve the Structure of Viral Populations and Reveal Pre-existing Drug Resistance Mutations in
the HIV and HCV Protease Genes
(Under the direction of Ronald Swanstrom, Stanley M. Lemon, and Corbin D. Jones)
Acknowledgements
nani gigantum humeris insidentes
If I had seen it further it is by standing on ye shoulders of Giants.
Newton to Hooke, 5 February 1676
I am incredibly fortunate to be mentored in an unparalleled collaborative and cross-disciplinary environment by a small handful of exceptional and passionate experts. I cherish every interaction, discussion, suggestion, critique, and most importantly, question. They have pushed me to think, invent, develop, and refine. To strive for excellence knowing there is never an endpoint, only advancing the boundary of what we know.
Table of Contents
List of Tables...xi
List of Figures...xii
List of Abbreviations...xiv
List of Symbols...xvi
Chapter I. Introduction...1
1.1 The evolvability of RNA viruses...1
1.1.1 Protease inhibitors are a major drug class used to treat HIV and HCV infections...2
1.1.2 The permissive replication of RNA viruses and a high mutation rate result in the rapid generation of genetic variation...4
1.1.3 Viruses can rapidly evolve resistance to protease inhibitors and other direct acting antivirals...5
1.2 Sequencing approaches for minor alleles...10
1.2.1. Common methods for genotyping resistance may obscure the origins and nature of resistance alleles...10
1.2.2. PCR artifacts and a high sequencing error rate bias deep sequencing resolution of viral populations...12
II. Accurate Sampling and Deep Sequencing of the HIV-1 Protease Gene
Using a Primer ID...15
2.1 Abstract...15
2.2 Introduction...16
2.3 Materials and Methods...19
2.4 Results...23
2.5 Discussion...45
III. Deep sequencing with a Primer ID reveals the dynamic paths of HIV-1 resistance during drug failure...50
3.1 Abstract...50
3.2 Introduction...52
3.3 Materials and Methods...55
3.4 Results...56
3.5 Discussion...82
IV. Ultra-high resolution Primer ID sequencing reveals higher viral diversity and different pre-existing protease inhibitor resistance-associated mutations in HCV mono-infected versus HCV-HIV co-infected individuals...87
4.1 Abstract...87
4.2 Introduction...88
4.3 Materials and Methods...92
4.4 Results...95
4.5 Discussion...114
V. Concluding remarks...117
5.1 What we can learn from ultra-high resolution of viral populations...117
List of Tables Table
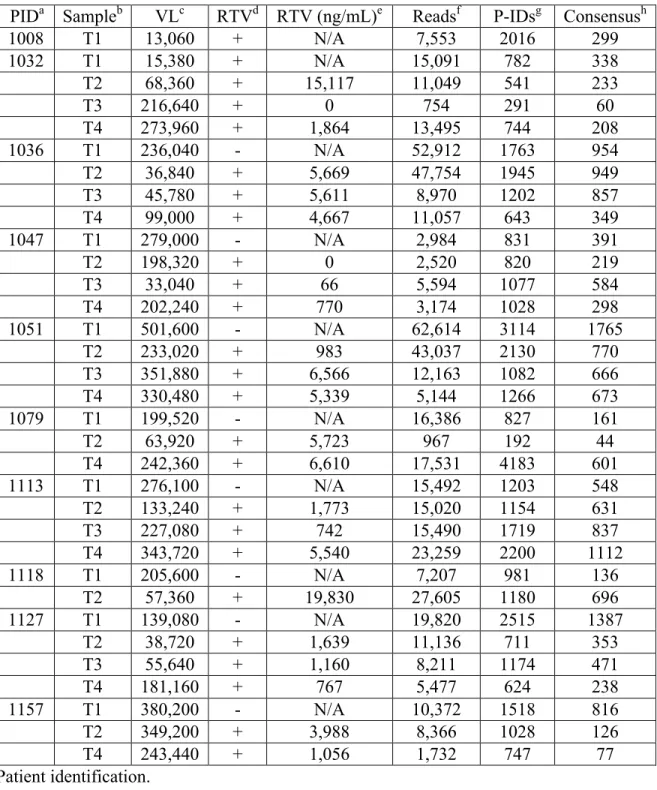
2.1 Frequency of nonconsensus codons per position...29 2.2 Summary of nucleotide variation in sampled time points...35 3.1 Summary of clinical metrics and sequencing resolution...58 3.2. Frequency of Class II or Class III protease inhibitor resistance
associated variants in therapy naïve populations...64 3.3 Measures of population size and variation in the therapy
naïve population...70 3.4. Average pre-therapy fitness values of Class III resistance
mutations...84 4.1 Population sequencing throughput and depth for two replicate
454 Junior runs...97 4.2 Replicate re-sampling of Primer IDs indicate absence of a
re-sampling bias...100 4.3 Frequency of resistance associated alleles across independent
tagging and sequencing runs...103 4.4 Population sampling depth for mono-infected and
List of Figures Figures
2.1 Tagging viral RNA templates with a Primer ID before PCR amplification and sequencing allows for direct removal
of artifactual errors and identifies resampling...24
2.2 Longitudinal sampling of blood plasma from a single individual infected with HIV-1 subtype B pre- and post- a failed ritonavir monotherapy regime...25
2.3 Distribution of the number of reads per Primer ID or consensus sequence...27
2.4 Analysis of low abundance variants for the distribution of allelic skewing...32
2.5 Major and minor allelic variants in the untreated populations...34
2.6 Frequency of codon variation across all 99 positions in protease over three time points...38
2.7 Major and minor unique pro gene sequences in the major resistant populations V82A, L90M, and I84V...41
2.8 Phylogenetic representation of protease population derived from deep sequencing with a Primer ID...44
3.1 Longitudinal sampling of blood plasma from 10 chronically infected individuals with HIV-1 subtype B that failed ritonavir monotherapy...59
3.2 Sliding window illustration of the nucleotide diversity (π) of protease in pre-therapy populations indicate spatial heterogeneity...61
3.3 Therapy-naïve non-consensus interpatient diversity ≥0.1% of protease in the Stanford database...67
3.4 Intrapopulation diversity contains major variants found across individuals in a database population but at significantly lower frequencies...68
3.7 Report of longitudinal π values from biological and simulated
outgrowth populations...74 3.8 Intrapopulation frequency of resistance associated alleles during
drug selection...77 3.9 Escape from ritonavir monotherapy is unique per patient and involves
dramatic restructuring of haplotypes over time...79 4.1 cDNA synthesis temperature affected Primer ID re-sampling for
mono- but not co-infected subjects...98 4.2 Comparison of the frequency of haplotypes ≥ 1% between Run 1
and Run 2 demonstrates tagging and sequencing reproducibility...101 4.3 Sliding window analysis of nucleotide diversity (π) across NS3
amino acids 36-175 and HCV protease coding domain...107 4.4 Measures of the average and total population diversity are significantly
different between mono-infected and co-infected subjects and
indicates population disequilibria...109 4.5 RAVs 36, 41, 55, 107, 109, 168, and 170 have significantly different
List of Abbreviations
cART Combined antiretroviral therapy
cDNA Complementary deoxyribonucleic Acid DAA Direct acting antiviral
dsDNA Double stranded deoxyribonucleic Acid dsRNA Double stranded ribonucleic acid Env Envelope glycoprotein
FDA U.S. Food and Drug Administration FDR False discovery rate
Gag Group-specific antigen
HAART Highly active antiretroviral protein HCV Hepatitis C virus
HIV Human immunodeficiency virus IDU Intravenous drug use
INF Interferon
LD Linkage disequilibrium
nRTI Nucleoside reverse transcriptase inhibitor
NS Nonsynonymous
NS5B Non-structural protein 5B PCR Polymerase chain reaction PEG Pegylated
Pol Polymerase
Pro Protease
RAV Resistance associated variant RBV Ribavirin
RdRp RNA-dependent RNA polymerase RIG-I Retinoic acid-inducing gene 1 RNA Ribonucleic acid
RNase H Ribonuclease H RT Reverse transcriptase RTV Ritonavir
S Segregating sites
SGA Single genome amplification SNP Single nucleotide polymorphism ssRNA Single stranded ribonucleic acid TLR3 Toll-like receptor 3
List of Symbols
D Tajima’s D statistic
θ Total sequence diversity
π Average pairwise sequence diversity
ω Fitness
Chapter 1 Introduction
1.1 The Evolvability of RNA viruses
RNA viruses are the dominant causative agent of emerging infectious diseases worldwide, yet only a small number of viral families can be effectively controlled through vaccination or antiviral drugs. Of all chronic viral diseases affecting the human population, Human Immunodeficiency Virus (HIV) and Hepatitis virus are the most deadly (1). HIV currently is infecting approximately 35 million people worldwide and is associated with 2 million deaths each year. Hepatitis C Virus (HCV) is infecting approximately 200 million people, and annually there are 366,000 deaths due to cirrhosis of the liver and hepatocellular carcinoma. Despite 30 years of active research and drug development, HIV remains incurable. Similarly, around 70 percent of HCV-infected individuals have persistent replication (2-4), and most potent drugs against this virus are still in clinical trials (1, 5). The substantial worldwide morbidity and mortality caused by these two viruses necessitates a better understanding of how to effectively counteract and control their spread within the human population. The most direct means of decreasing the interhost transmission rate is to suppress or eradicate intrahost viral populations.
to new hosts. As a result, direct acting antivirals (DAA) are needed as a pharmacologic intervention for suppressing the viral burden and decreasing transmission risk, and DAAs are increasing in abundance, availability, and sophistication. However, there are significant pitfalls to current day drug therapies against HIV and HCV. The newly FDA licensed DAAs against HCV have low genetic barriers that a virus population can rapidly evolve to overcome, which results in viral rebound. Highly Active Antiretroviral Therapy (HAART) against HIV is a multifaceted selection regiment with a combination of drugs, most of which contain high genetic barriers. However, cessation of HAART always results in viral rebound.
1.1.1 Protease inhibitors are a major drug class used to treat HIV and HCV infections. There are six antiretroviral drug classes, 24 drugs in total, licensed to treat HIV. Each class targets a different component of the viral life cycle, from inhibiting attachment of the virion to the host cell through preventing virion maturation post-budding. The recommended treatment for HIV infection involves dual nucleoside reverse transcriptase inhibitors (nRTI) in combination with a third class, commonly a protease inhibitor (6). The standard of care for HCV infection is immunomodulation and mutagenicity using a combination of pegylated interferon-α and ribavirin (PEG-INF/RBV). However, as of late April and mid May of 2011,
two DAAs were FDA approved to treat HCV infection. Both were protease inhibitors.
molecule anchored in the active site by two opposing aspartic acid residues. For an HIV virion to mature, proteolytic processing of three polyprotein precursors, Gag, Gag-Pro-Pol, and Env, is required. Without protease function, the immature HIV virion is unable to initiate a new infectious cycle.
Similarly, the HCV protease NS3 is critical for HCV infection. NS3 is a serine protease that heterodimerizes with the viral cofactor NS4A. The NH2 terminal cleaves four
sites downstream of the NS2-3 junction in the HCV polyprotein, NS3-4A, NS4A-4B, NS4B-5A, and NS5A-5B (7). For proteolytic function, a catalytic triad is required in conjunction with a tetrahedrially coordinated metal ion (8). In addition to viral polyprotein cleavage, HCV’s protease also processes host signaling molecules activated by dsRNA, blocking signaling through the TRL3 and RIG-I pathways (reviewed in (5)).
1.1.2 The permissive replication of RNA viruses and a high mutation rate result in the rapid generation of genetic variation.
Genetic variation is the raw material upon which selection acts. The ability of these viral populations to escape strong selection pressures—such as small molecule inhibitors—is due to a rich landscape of genetic heterogeneity. This variation is primarily introduced through polymerase nucleotide misincorporation during genomic template copying. It is the exceptionally high rate at which nucleotide misincorporation occurs that results in the quick diversification of an RNA virus population. HIV’s error-prone Reverse Transcriptase (RT) introduces mutations at an estimated rate of 2.16x10⁻⁵ substitutions/site/generation during transcription of viral RNA (vRNA) to double-stranded DNA (dsDNA) (9, 10). HCV’s RNA-dependent RNA polymerase (RdRp), NS5B, emulates the retroviral substitution rate, adding 1x10⁻⁴ to 1x10⁻⁵ substitutions/site/generation (11). However, HCV does not have a double-stranded intermediate genome, thus RdRp is exclusively used to go from positive-sense to negative-sense to positive-sense RNA, adding errors with each template copy.
then broadened to copy choice (14), is the predominant theory for recombination in HIV (15, 16).
Unlike HIV, HCV cannot readily form recombinants in vivo, though there are some rare documented cases of intersubtype and intergenotypic recombination (17-19). HCV’s replicase is membrane bound, which constrains RNA templates within lipid rafts and creates a barrier to template switching (20). Moreover, early competitive exclusion may prevent distinct variants arising to appreciable frequencies. If recombination occurs, chimers retain substantial homology to the parental templates and would be difficult to detect. Finally, recombination between subtypes can be readily induced in vitro, but recombinants have poor fitness. Sequence divergence incompatibilities would further limit the rise of recombinant genomes within a population (21). Thus if recombination occurs in HCV, it is rare, although poor sensitivity may result in underestimates of recombination (22).
1.1.3 Viruses can rapidly evolve resistance to protease inhibitors and other direct acting antivirals.
Nucleotide misincorporation by viral polymerase has an approximate random distribution across the viral genome, though it may be biased towards non-helical secondary structure (23-27) and other mutational biases (28, 29). The viral polymerase’s misincorporation rate (µ) is the frequency at which new mutations are introduced into a
population. If a misincorporation event results in a nonsynonymous change, and the new amino acid does not reduce viral fitness to zero, the allele1 may be preserved in the viral
population under a therapy naïve environment. New mutations will be added at a rate µ, but
the frequency at which any given allele (q) will exist is the equilibrium achieved between the rate of introduction of that allele and the intensity at which selection (s) removes it, or q = µ/s
(30).
Because of the mutation/selection balance, a viral population will contain a number of low-frequency de novo mutations. Some minor variants will be unviable, however, while others may confer resistance. If a new allele reduces or prevents protease inhibitor binding, thus allowing for the genotype to replicate in the face of strong selection, it has the potential to be sweep under that selection, becoming a major haplotype and allowing for drug escape.
The growth and adaptation of a viral population in the presence of drug selection is observed as viral rebound with drug resistance, and it can occur rapidly due to a short viral life cycle. The time needed for an HIV virion to attach, replicate, and produce progeny that infect new cells is estimated at 2 days, with a maximum of approximately 1010 virions produced per day within a person (31). In contrast, HCV’s replication cycle has a half life of 2.7 hours (32), and approximately 1012 virions are produced daily (32-34). The high production rate of new mutations introduced into the small, ~10kb viral genomes results in rapid diversification of viral populations within a host. For both viruses, it has been theoretically estimated that at any given time within a large population, every single mutation can exist (35-37).
before starting drug therapy (6), and this technology will reveal variants ≥20% in frequency
(38, 39).
The clinical significance of pre-existing resistance alleles has not been clearly elucidated, and likely will be unique per drug and treatment regiment. Previous studies using allele-specific PCR have implicated that pre-existing variants may preclude increased susceptibility for therapy failure (40, 41). Deep sequencing studies have produced correlative (42), partial (43) or non-correlative (44) results on the impact of pre-existing resistance alleles, but none have examined the haplotypes on which they reside. Understanding if pre-existing resistance alleles can be selected under a drug can further inform therapeutic choices and circumvent suboptimal selection. Aside from cost and morbidity associated with therapy failure, the outgrowth of drug resistance also complicates subsequent therapeutic intervention, as drugs within a class commonly contain overlapping drug resistance mutations, thus further narrowing downstream drug choices for viral suppression (6).
When a patient fails therapy, a population of susceptible viruses bottlenecks under drug selective pressures, but then grows out with resistance. Virologic rebound requires genomic change that confers a phenotype allowing escape of drug selection and selection for that phenotype under a drug. In order to better understand how a viral population evolves resistance, several questions need to be addressed:
this due to de novo resistance mutations arising during the selective pressure (not a result of it), or the sweeping of pre-existing resistant variants in the standing genetic variation?
Is the evolutionary path to resistance consistent? Escaping a selective event may only require a small number of discrete mutations. In vivo studies have demonstrated this process to be a sequential, step-wise addition of resistance and compensatory alleles (45-47), indicating that the path to resistance may be conserved across populations. Alternative in vivo studies, however, indicate that the patterns are more complex (48), therefore individual populations may take unique paths to resistance.
Antagonistic epistasis has been shown to occur between beneficial alleles (49). If two adaptive alleles arise on different haplotypes, clonal interference predicts that their progression to fixation will be slower than if there was only one beneficial allele sweeping to fixation (50). Interference has been demonstrated in RNA populations such as vesicular stomatitis virus (VSV) (51), but has not been clearly demonstrated in vivo. The Red Queen Hypothesis, or the perpetual arms race amongst competing viral subpopulations, is perhaps better supported for RNA viruses in the face of drug selection due to a “leap-frog” effect of adaptive (or maladaptive) alleles (52, 53) versus smooth climbs to fitness peaks. Although many of these studies are from in vitro and in silico observations, they point to unique paths to adaptation.
deterministic processes (54) and small populations driven by stochastic models (55-57) have been made. If stochastic forces govern a population it will take a unique path to resistance, as the fate of new mutations will be driven by drift (58). Similarly, pre-existing resistance mutations will be non-informative, as they are likely lost. If deterministic forces shape population response, pre-existing alleles likely are retained through a population bottleneck, increasing their probability of selection and expansion.
Does recombination play a large role in shaping the evolution of haplotypes? If two alleles are associated or disassociated non-randomly, their appearance on a haplotype may be indicative of a non-additive change in fitness (ω). Linkage disequilibrium (D) that is
maladaptive can be broken up by recombination (59), allowing escape from the effects of Muller’s ratchet and error catastrophe. For non-recombining viruses, a single allele needs to rise to fixation then gain a second beneficial allele from mutation for two beneficial alleles to arise on a single haplotype. HIV has a documented high recombination rate, but whether recombination or the de novo addition of new alleles during the path to resistance plays a larger role has not been clearly demonstrated.
Does suboptimal compliance increases population diversity. A rough genotypic fitness landscape has been experimentally demonstrated for the RNA virus φ6 (60). Environmental
only a few can survive at any given time yet the environment is not so stable that superior competitors can quickly displace (61). Applying disturbance ecology to intrahost selection would predict that inconsistent, intermediate drug selection would result in the emergence of multiple resistance alleles. Drug concentration heterogeneity, thus increasing a range for the path to resistance, has been demonstrated to increase the rate at which resistance is developed (62).
How does a co-infecting pathogen affect viral diversity? The persistent infection of more than one pathogen in a host is common, but the complexity of within-strain and within-host interactions make it difficult to predict how strains influence each other and shape disease outcome (63, 64). It is known that HCV-HIV co-infection increases patient morbidity and mortality (65) by causing a three fold acceleration in fibrosis, cirrhosis, and liver disease (66). The biologic effects and clinical observations of mono- versus co-infection suggest differences in intrahost viral diversity, but previous studies have failed to demonstrate a difference (67, 68), or consensus (69-72).
1.2 Sequencing Approaches for Minor Alleles
The structure of an intrahost viral population and the path it takes to resistance has large theoretical and clinical implications. To date, these questions have only been explored from techniques that have limited and/or biased sampling of the extant diversity.
In the clinical setting, genotypic assays that resolve drug resistance mutations use Sanger-based sequencing technology. A population of viral templates is sampled from an individual, sequenced, and then reported as a single consensus sequence. The consensus sequence captures the most common alleles, and high frequency allelic variants can be detected and quantified de novo by assessing chromatogram peaks. However, variants below 20-25% in frequency are typically not resolved (38, 39), and accuracy is further compounded by laboratory-introduced biases (73). Furthermore, the association, or linkage, between different variable sites is lost.
There are alternative methods to resolving variants below the resolution of Sanger sequencing. Allele-specific PCR, for example, uses primers specific to drug resistance polymorphisms on individual sites within the viral genome. Due to the sensitivity of PCR, this potentiates the resolution of variants present in less than 1% in of the population. However, targets require a priori selection of sites and variants, and akin to Sanger sequencing, linkage is lost (74-83).
1.2.2 PCR artifacts and a high sequencing error rate bias deep sequencing resolution of viral populations.
The high throughput, thus high-resolution capabilities of next generation sequencing platforms has a great potential to be applied within a clinical setting in resolving minor drug resistance mutations de novo, retain linkage across a template, and provide drug resistance screening at a lower cost per sample than standard genotypic assays. However, the high error rate inherent from the sequencing chemistry in combination with laboratory-introduced biases has limited the clinical application and resolution of minor variants to levels below that of population sequencing but above what allele-specific PCR can obtain. Therefore, the utility of next generation platforms for sequencing of viral populations derived from clinical samples is restricted.
Another major limitation of viral template PCR amplification prior to a deep sequencing protocol is the re-sampling of amplified templates, or PCR re-sampling. PCR reactions typically start with an unknown number of templates. When PCR efficiencies are not 100%, the random dropout of sequences results in an underestimation of diversity. Moreover, sampling of a large, amplified population does not equate with sampling of individual genomes, therefore depth is a correlate of the amount of starting material, not degree of re-sampling (86).
1.2.3 Consensus sequences constructed from amplified products derived from an individual template resolve PCR and sequencing error.
Strategies that create a consensus sequence, such as Single Genome Amplification (SGA), will call the correct base at each position (87-90). In the SGA strategy, PCR amplification is preceded by endpoint dilution titration, such that a single template is present per reaction. During amplification, PCR biases will introduce error, but the influence of diversity from recombination events and differential template amplification will be masked by overall sample homogeneity. Although misincorporation occurs, it is randomly distributed across the template, therefore the majority of reads per site will be correct. With traditional sequencing methods, minor variants due to misincorporation will be masked, resulting in the correct base call per position. While this approach is effective for eliminating the PCR and sequencing biases, it does not lend itself to high throughput techniques and has limited utility when applied to a large viral population.
polymorphisms from PCR biases and sequencing error has been farmed out to an ever-increasing number of software and bioinformatics tools that range in utility, algorithmic complexity, and degree of auxiliary analyses (91-94). However, the unifying factor that ties together these tools is that they are all assessing error from biological polymorphisms indirectly.
Indirect, or statistical inference of biological diversity can generally resolve major variants. However, minor biological variants whose frequency nears the error threshold are greatly skewed or lost due to procedural biases. Therefore, an individual’s resistance profile is fundamentally limited to variants whose frequency is well above the sequencing error and influence of PCR biases, and PCR re-sampling continues to remain uncorrected for. In order to make high throughput sequencing useful in resolving minor drug resistant variants and determining their role in virologic outcome, PCR biases, sequencing error, and PCR re-sampling all need to be directly overcome. Only after procedural error is removed can one examine a population accurately for drug resistance and adaptation to drug selective pressures.
Chapter 2
Accurate Sampling and Deep Sequencing of the HIV-1 Protease Gene Using a Primer ID
Reprinted with modification from: Jabara C.B., Jones C.D., Roach J., Anderson J.A., and Swanstrom R. (2011) Accurate Sampling and Deep Sequencing of the HIV-1 Protease Gene Using a Primer ID. Proc Natl Acad Sci USA 108:20166-71.
2.1 Abstract
correcting for recombination, allelic skewing, and misincorporation/sequencing errors. The resulting population of consensus sequences directly represent the initial sampled templates. We applied this approach to the HIV-1 protease (pro) gene to view the distribution of sequence variation of a complex viral population within a host. We identified major and minor polymorphisms at coding and noncoding positions. In addition, we observed dynamic genetic changes within the population during intermittent drug exposure, including the emergence of multiple resistant alleles. These results provide an unprecedented view of a complex viral population in the absence of PCR resampling and artifactual error.
2.2 Introduction
High throughput sequencing allows the acquisition of large amounts of sequence data that can encompass entire genomes (95-98). With sufficient amounts of starting DNA, PCR is not needed prior to the library preparation step of the sequencing protocol. Sequencing miscalls inherent in high throughput sequencing approaches are resolved using multiple reads over a given base.
opportunity to identify minor variants associated with resistance de novo with the goal of understanding their role in therapy failure.
To make deep sequencing useful for complex populations it is necessary to overcome PCR resampling, which is mistaken for sampling of the original population, and PCR and sequencing errors, which can be mistaken for diversity. As nucleotide misincorporation is largely random across sites, and template switching/recombination is more likely to occur in the later cycles of a PCR reaction (108), strategies that create a bulk or consensus sequence for each sampled template will call the correct base at each position. One approach to sampling highly heterogeneous populations, such as the HIV-1 env gene, is through endpoint dilution titration of the template prior to nested PCR, such that a single template is present in each PCR amplification (87-90). In addition to masking the misincorporations, PCR-mediated recombination produces recombinant templates identical to the parental sequence. Although highly accurate, this technique is labor-intensive, and, as population sampling is dependent on the number of templates sequenced, this methodology does not lend itself to the identification of minor variants or to understanding the structure of a complex population, nor is it easily adaptable to a high throughput approach.
each independent templating event, and PCR resampling then becomes over-coverage for each template to create a consensus sequence of that template. Using this approach, we were able to directly remove error, correct for PCR resampling, and capture the fluctuation of minor variants in the viral population within a host. We also resolved minor drug resistant variants below 1% in frequency prior to the initiation of antiretroviral therapy, and were able to correlate these variants with the emergence of drug resistance.
2.3 Materials and methods
vRNA extraction and cDNA synthesis. Viral RNA was extracted from three plasma samples taken longitudinally from an individual infected with subtype B HIV-1 who was participating in a protease inhibitor efficacy trial (M94-247). Two samples were collected at approximately 6 months before and immediately prior to the addition of the protease inhibitor ritonavir to a failed therapy regimen (plasma viral loads of 285,360 copies of viral RNA/ml and 321,100 copies of viral RNA/ml, respectively), and one sample was collected during ritonavir therapy (at approximately two months on therapy, 349,920 copies of viral RNA/ml) but during a time of apparent intermittent compliance. For each plasma sample, vRNA was extracted from pelleted (25,000 x g for 2 hours) viral particles using the QiaAMP
Viral RNA Kit (Qiagen, Valencia, CA). Approximately 10,000 copies of viral RNA from each sample were present in the cDNA synthesis reaction as previously described (87, 109,
110). The tagging primer used was,
the protease coding domain (HXB2 2568-2594). The oligonucleotides were purchased from IDT and were purified by standard desalting.
Amplification of tagged sequences. The single-stranded cDNA was column purified using the PureLink PCR Purification Kit (Invitrogen, Carlsbad, CA), using Binding Buffer HC (high cut-off) and 3X wash to remove the cDNA primer. Primer removal was verified by electropherogram analysis using an Experion HighSense RNA microfluidic chip (Bio-Rad Laboratories, Hercules, CA). Samples were amplified by nested PCR, using upstream primers GAGAGACAGGCTAATTTTTTAGG-3’ (HXB2 2071-2093) and 5’-ATAGACAAGGAACTGTATCC-3’ (HXB2 2224-2243); the downstream primers targeted the 5’ portion of the cDNA tagging primer 5-GCCTTGCCAGCACGCTCAGGC-3’ then 5’-CCAGCACGCTCAGGCCTTGCA-3’. The PCR was done using Platinum Taq DNA Polymerase High Fidelity (Invitrogen, Carlsbad, CA). Each reaction contained 1x High Fidelity PCR Buffer, 0.2 mM dNTP mixture, 2 mM MgCl2, 0.2 µM of each primer, 1.5 units
of Platinum Taq DNA Polymerase. For the first round, the purified cDNA template was split to 2x50ul for the first round PCR, and 1ul of the purified first round product was used for nested PCR. Samples were denatured at 94oC for 2 minutes, followed by 30 cycles of 94oC
for 15 seconds, 55oC for 30 seconds, 68oC for 1 minute, and a final extension at 68oC for 5 minutes.
DNA was quantified by Qubit fluorometer using dsDNA High Sense assay (Invitrogen, Carlsbad, CA). Product generation, quality, and primer removal for both PCR rounds was verified using an Experion DNA microfluidic chip (Bio-Rad Laboratories, Hercules, CA).
454 pyrosequencing. Tagged samples from the three time points were combined and sequenced on the 454 GS FLX platform with XLR70 Titanium sequencing chemistry as per the manufacturer’s instructions (Roche, Nutley, NJ) but with under-loaded beads to minimize signal crosstalk. Sequences were processed from two independent 454 GS FLX Titanium runs (1/8th of a plate each).
Population analyses. A chi-squared test was used to test for significance changes in allele frequency between the two untreated time points. To control for multiple testing, collective assessment of significance was based on False Discovery Rate analysis (FDR = 0.05). Tests for linkage disequilibrium were computed by DnaSP v.5.10.01 (111). These tests were done on filtered populations devoid of sequences containing ambiguities or gaps. Tests for neutrality were computed by DnaSP and R (112) on filtered populations devoid of sequences containing ambiguities. Gaps and alleles represented by a single sequence were reverted to the consensus. Beta P-values were calculated against the null hypothesis that D = 0, assuming that D follows a beta distribution after rescaling on [0, 1] (113).
Synonymous and nonsynonymous diversity across and within populations was computed through customized bioinformatics suites. Unfiltered sequences were used in the analysis, and ambiguities, gaps, and alleles represented by a single sequence were removed from the final tabulation.
SNPs were graphically displayed through the Highlighter tool (www.hiv.lanl.gov).
Second, Maximum likelihood phylogeny was inferred using the PHYLIP package, version 3.69 (115), and the calculated phylogeny is available upon request. The PHYLIP program seqboot was used to create 100 bootstraps. Resulting bootstraps were submitted to the PHYLIP program dnamlk for maximum likelihood inference subject to a strict molecular clock. The consensus tree of all boostrap results was constructed using the PHYLIP program consense.
Both phylogenetic trees were visualized by a customized modification of Figtree v.1.3.1. (116)
2.4 Results
A cDNA synthesis primer containing a Primer ID can be used to track individual viral templates.
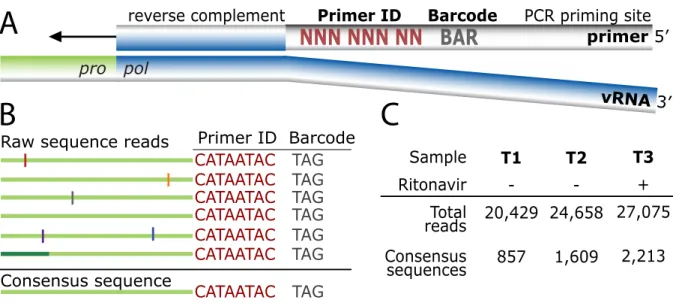
Fig. 2.1 Tagging viral RNA templates with a Primer ID before PCR amplification and sequencing allows for direct removal of artifactual errors and identifies resampling. (A) A primer was designed to bind downstream of the protease coding domain. In the 5′ tail of the primer, a degenerate string of eight nucleotides created a Primer ID, allowing for 65,536 unique combinations. An a priori selected three nucleotide barcode was designed for the sample ID. Finally, a heterologous string of nucleotides with low affinity to the HIV-1 genome was included in the far 5′ end for use as the priming site in the PCR amplification. (B) PCR biases and sequencing error are introduced during amplification and sequencing of viral templates. Repetitive identification of the barcode and Primer ID allow for tracking of each templating event from a single tagged cDNA. As errors are minor components within the Primer ID population, forming a consensus sequence directly removes them, and corrects for PCR resampling. (C) HIV-1 RNA templates isolated from plasma samples from two pre- and one post-intermittent ritonavir drug therapy were tagged, amplified, and deep sequenced. Tagged sequences containing full- length protease were used to create a population of
!!!!!!!!"#$!!!"$%
&000&000&00&&&)1/
!"#"!$"%&'()*"("+,%%%%%%!"#$%"&'(&&&&&)*"+,-%%%%%%-./%)!0(0+1%$0,"
./01&23
&&&&&&2"#$%"&43
A
B
C
-!0("!%56%%78!&'9"
.:;::;:.%%%;:< .:;::;:.%%%;:<
.:;::;:.%%%;:< .:;::;:.%%%;:<
.:;::;:.%%%;:<
.:;::;:.%%%;:< .:;::;:.%%%;:< .'+$"+$=$%$">="+&"
/8?%$">="+&"%!"89$
@8()*" /0,'+8#0! ;',8* !"89$ .'+$"+$=$ $">="+&"$
34 A BCDEBF
G4H
35 A BEDI4G
JDICF
36 K BHDCH4
consensus sequences when at least three sequences contained an identical barcode and Primer ID.
Viral RNA was extracted from three longitudinal blood plasma samples from an individual infected with subtype B HIV-1 who was participating in a protease inhibitor efficacy trial (M94-247) (117) (Fig. 2.2). Approximately 10,000 copies of viral RNA from each sample were used in a reverse transcription reaction for cDNA synthesis and tagging using the Primer ID. The cDNA product was separated from the unused cDNA primers, then the viral sequences were amplified by nested PCR and sequenced on the 454 GS FLX Titanium. Our data were distilled from total reads of 20,429, 24,658, and 27,075 for the three time points (T1, T2, and T3, respectively). Raw sequence reads were assessed for the cDNA tagging primer and a full length pro gene sequence (297 nucleotides long representing 99 codons), and when three or more sequences within a sample contained an identical Primer ID, a consensus sequence was formed to represent one sequence in the population (Fig. 2.1B, 1C, S2).
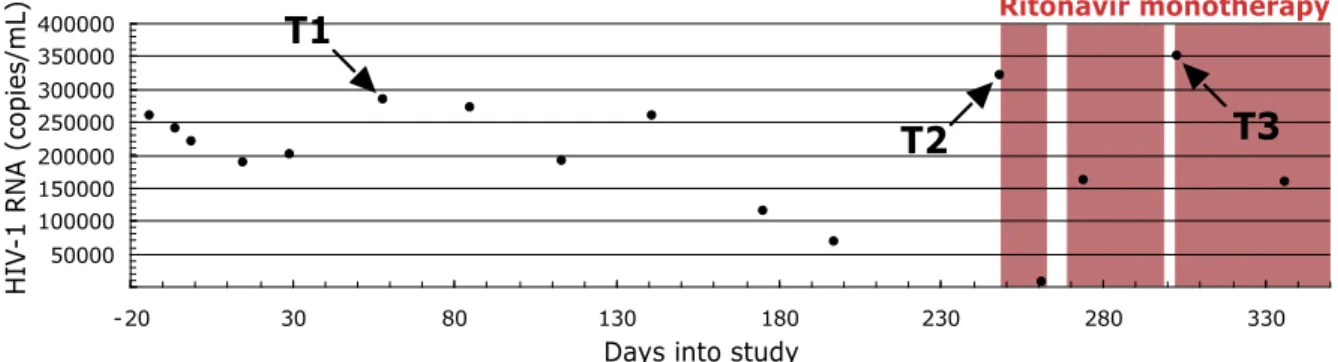
Fig. 2.2 Longitudinal sampling of blood plasma from a single individual infected with HIV-1 subtype B pre- and post- a failed ritonavir monotherapy regime. Two time-points
∼6 mo apart were sampled before ritonavir therapy (T1 and T2). One time point was sampled
Ritonavir monotherapy
Days into study T1
T2
50000 100000 150000 200000 250000 300000 350000 400000
-20 30 80 130 180 230 280 330
T3
HI
V
-1 RNA
after failed, intermittent ritonavir monotherapy (T3). The shaded areas represent times of therapy compliance based on self-report.
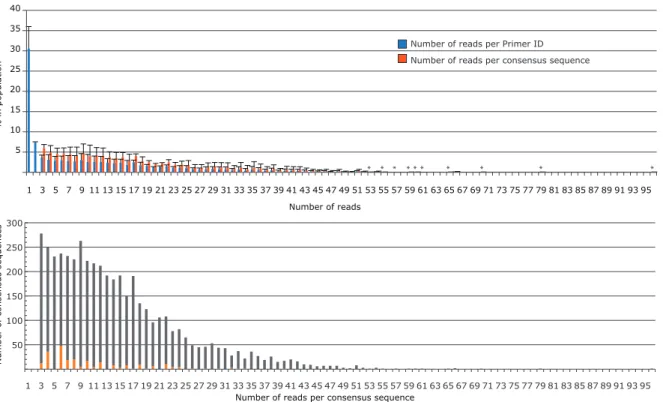
Fig. 2.3 Distribution of the number of reads per Primer ID or consensus sequence. A) Blue bars represent the distribution of resampling of the filtered sequence population immediately before consensus sequence generation. Within a single Primer ID, when three or more sequences were present, a consensus sequence was formed. The orange bars represent the distribution of the number of reads that went into each consensus sequence. The values shown represent the mean for the data from the three time points with the error bars representing the SD between the three samples. Starred bars are included to mark positions where a single sequence had high resampling occurrence. (B) Number of consensus sequences containing an ambiguity as a function of extent of resampling. All three time points were combined. Gray bars represent consensus sequences without an ambiguity, and orange bars represent consensus sequences with an ambiguity. There is a discernible pattern of an increased number of ambiguities going out to 22 reads/consensus sequence for those
5 10 15 20 25 30 35 40
1 3 5 7 9 11 13 15 17 19 21 23 25 27 29 31 33 35 37 39 41 43 45 47 49 51 53 55 57 59 61 63 65 67 69 71 73 75 77 79 81 83 85 87 89 91 93 95
% in population
Number of reads
Number of reads per Primer ID Number of reads per consensus sequence
* *
* * * * * * * *
50 100 150 200 250 300
1 3 5 7 9 11 13 15 17 19 21 23 25 27 29 31 33 35 37 39 41 43 45 47 49 51 53 55 57 59 61 63 65 67 69 71 73 75 77 79 81 83 85 87 89 91 93 95
Number of
consensus sequences
consensus sequences created from an even number of reads, the result of having a tie between two different sequences at one position. However, this represents only a small fraction of the total reads (5.4%). The amino acid position with the highest ambiguity total was used per Primer ID subpopulation.
population diversity to SNPs that appeared at least twice in the data set (i.e. linked to at least two separate Primer IDs), either at the same time point or at multiple time points in the overall data set (Table 2.1). We have not corrected the data set for the presumed 13 SNPs that appeared twice that are expected to be present due to error even though this represents 33% of all of the SNPs that appeared twice (13 of 39). Overall, 80% of the SNPs (i.e. any sequence change from the consensus that appeared at least once) in the total data set of 72,162 sequence reads were removed as error. Also, 60-65% of the sequence reads were revealed as resampling. Finally, allelic skewing of up to nearly 100 fold was corrected (Fig. 2.4).
Consensus Nonsynonymous Synonymous
AAposa AAcb Ccc Cmd AAme T1f T2g T3h T3si T3rj Cmk T1l T2m T3n T3so T3rp
4 T ACT GCT A 0.06 0.05 0.09
5 L CTT CCT P 0.12 0.05 0.14
7 Q CAA CAG 0.35 0.12 0.09 0.14 0.09
8 R CGA CGG 0.12 0.05 0.14
9 P CCC
10 L CTC TTC F 0.19 CTT 0.19
11 V GTC ATC I 0.23 0.25 GTT 0.12
14 K AAG AGG R 0.12 AAA 1.17 0.19 0.59 0.29 0.72
15 I ATA GTA V 1.17 0.12 0.14 0.14 0.18 ATC 0.09 0.18
16 G GGG AGG R 0.06 0.05 0.09 GGA 2.22 3.54 38.86 17.70 45.97
17 G GGG AGG R 0.09 0.29 GGA 0.35 0.19 0.18 0.43 0.09
18 Q CAA GAA E 0.23 0.12 CAG 18.55 21.75 6.46 12.81 3.53
19 L CTA ACA T 0.47
ATA I 19.25 19.83 20.42 19.28 24.98 TTA 0.12 0.19 0.09 0.29 GTA V 3.38 5.66 46.00 25.61 52.76
20 K AAG AGG R 0.12 0.12 0.05 0.09 AAA 0.31 0.86 0.29 1.27
21 E GAA GAG 0.12 0.06 0.05 0.14
22 A GCT GCC 0.47 0.44 0.27 0.58 0.18
GCG 0.23
23 L CTA CTG 0.19
24 L TTA CTA 0.35 5.72 1.31 2.16 0.63
TTG 12.49 0.81 0.59 1.01 0.27
25 D GAT GGT G 0.12 0.12 GAC 0.23 0.93 0.05 0.14
26 T ACA GCA A 0.12
27 G GGA GGG 0.12 0.06
28 A GCA GCG 0.12 0.09 0.14
29 D GAT AAT N 0.12 0.05 0.09 GAC 0.23 0.19
30 D GAT GAC 0.06 0.09 0.14 0.09
31 T ACA ACG 0.12
32 V GTA GTG 0.25
33 L TTA GTA V 0.47 0.06 CTA 0.25 0.14 0.29 0.09
TTG 0.35 0.12 0.14 0.43
34 E GAA GGA G 0.12 0.05 0.09 GAG 0.12 0.05 0.14
CAA 0.09
35 E GAA AAA K 0.12 0.06 0.09 0.14 36 M ATG ATA I 0.82 0.81 0.27 0.43 0.27
37 N AAT AGT S 0.19 0.05 AAC 0.06 0.05 0.14
GAT D 2.33 2.30 0.95 0.86 1.27
38 L TTG TTA 0.23 0.62 0.05 0.09
39 P CCA CCT 0.23
40 G GGA GGG 0.12 0.12
41 K AAA AGA R 0.06 0.18 0.14 0.27 AAG 4.08 1.43 0.50 1.15 0.27
42 W TGG CGG R 0.12 0.06
TAG _ 0.12 0.05 0.09
TGA _ 0.14 0.27
43 K AAA AGA R 0.06 0.05 0.09 AAG 0.35 0.14 0.14 0.18
44 P CCA CCG 0.06 0.23 0.43 0.18
45 K AAA AGA R 0.12 0.12 0.05 0.09 AAG 0.58 0.99 0.41 1.29
46 M ATG ATA I 0.12 0.09 0.14 0.09
48 G GGA GAA E 0.14 0.14 0.18 GGG 0.35 0.19
49 G GGA GAA E 0.12 0.06 0.05 0.09 GGG 0.23 0.12
50 I ATT ATC 0.12 0.12
51 G GGA GGG 0.12 0.06
52 G GGT AGT S 0.12 0.06 0.05 0.14 GGA 0.06 0.05 0.14
GGC 0.12 0.31 0.09 0.14 0.09
GGG 0.14 0.43
53 F TTT TTC 0.70 0.05 0.14
54 I ATC ACC T 0.12 0.06 0.05 0.09 ATT 0.35 0.06 0.14 0.14
58 Q CAG TAG _ 0.05 0.09 CAA 0.93 0.50 0.23 0.29 0.27
60 D GAT AAT N 0.12
GGT G 0.12
61 Q CAA CGA R 0.12 0.06 0.05 0.14 CAG 0.19 0.23 0.58
TAA _ 0.12 0.06 0.05 0.09
62 I ATA GTA V 0.35 0.06
63 L CTC CCC P 0.12 0.41 0.58 0.36 CTT 11.32 5.41 1.27 2.88 0.45
64 I ATA GTA V 1.05 0.06 0.09 0.18
ATG M 0.23 0.05 0.14
65 E GAA AAA K 0.09 0.14 0.09 GAG 0.35 0.06 0.05
66 I ATC ATA 0.25 0.18 0.58
ATT 1.98 0.19
67 C TGT TGC 0.35 0.12 0.05 0.14
68 G GGA GGG 0.23 0.12 0.05 0.14
69 H CAT TAT Y 0.23 0.06 0.09 0.14 CAC 0.82 0.31 0.14 0.29 0.09
70 K AAA CAA Q 0.47 0.12 0.41 1.29 AAG 3.27 10.88 15.27 6.62 25.34
71 A GCT ACT T 0.12 0.09
72 I ATA GTA V 0.12 0.12
73 G GGT GGC 0.47 18.09 7.05 15.68 3.62
74 T ACA ACG 0.23 0.12
75 V GTA ATA I 0.23 0.06 0.05 GTG 1.87 0.99 0.27 0.43 0.27
GCA A 0.09 0.18
76 L TTA CTA 0.12 0.09 0.18
TTG 0.93 0.62 0.27 0.43 0.18
77 V GTA ATA I 0.23 0.56 0.72 2.01 0.18 GTG 0.82 0.62 0.23 0.58
CTA L 0.14
78 G GGA GGG 1.17 1.24 0.09 0.14
79 P CCT CCC 1.17 0.31 0.54 1.29 0.18
81 P CCT CCC 0.12 0.19
CCG 1.52 0.44
82 V GTC ATC I 0.06 1.27 3.60 GTA 0.35 0.31 0.05
CTC L 0.06 1.08 3.45 GTT 1.05 0.75 0.41 1.01
GCC A 0.12 49.89 99.91
TTC F 0.14 0.43
83 N AAC AGC S 0.12 0.05 0.09 AAT 8.17 6.40 3.62 4.75 4.16
84 I ATA GTA V 5.15
85 I ATT ATA 0.12 0.05 0.14
ATC 0.12 0.12 0.05
86 G GGA GGG 0.12
GGT 0.12 0.06
87 R AGA AAA K 0.12 0.06 0.05 0.09 AGG 0.58 0.37 0.05 0.14
GGA G 0.06 0.09 0.14 0.09
88 N AAT AAC 0.35 0.93
89 L CTA ATA I 0.12 CTG 1.17 0.68 1.36 1.87 1.54
TTA 1.98 0.56 1.27 0.14 2.44
90 L TTG ATG M 0.12 13.56 0.09 CTG 0.47 0.09 0.14 0.09
TCG S 0.12 0.05 0.09 TTA 0.47 0.19 0.14 0.43
91 T ACT GCT A 0.06 0.05 0.09 ACC 0.12 0.06 0.09 0.14 0.09
ACG 0.12 0.12 0.77 1.54
92 Q CAG CAA 0.23 0.19 0.14
93 I ATT CTT L 0.12 0.06 ATC 0.23 0.09 0.14 0.09
94 G GGT GAT D 0.12 0.06 GGA 0.23
GGC 1.28 0.25 0.50 1.29 0.18 GGG 0.23 0.06 0.09 0.14
95 C TGC TGT 0.70 0.12 0.14 0.27
96 T ACT ACA 0.12 0.09 0.14 0.09
ACC 0.70 0.12 0.23 0.43 0.09
ACG 0.06 0.05 0.14
97 L TTA CTA 0.58 0.05 0.14
TTG 0.12 0.25 0.27 0.43 0.27
98 N AAT AAC 0.23 0.12 0.14 0.18
99 F TTT CTT L 0.06 0.18 0.29 0.09 TTC 1.05 0.50 1.54 1.44 1.54
aAmino acid position, protease.
bConsensus amino acid in untreated population. cConsensus codon in untreated population. dCoding nonconsensus amino acid. eCoding nonconsensus codon.
fFrequency of SNP in first untreated time point. gFrequency of SNP in second untreated time point. hFrequency of SNP in third time point, treated.
iFrequency of SNP in third time point, treated, susceptible population (not V82A, I84V,
L90M).
jFrequency of SNP in third time point, treated, population containing major ritonavir resistant
variant V82A.
kSilent nonconsensus codon.
lFrequency of SNP in first untreated time point. mFrequency of SNP in second untreated time point. nFrequency of SNP in third time point, treated.
oFrequency of SNP in third time point, treated, susceptible population (not V82A, I84V,
L90M).
pFrequency of SNP in third time point, treated, population containing major ritonavir
resistant variant V82A.
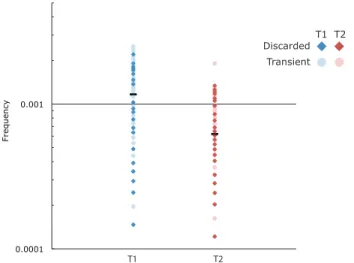
Fig. 2.4 Analysis of low abundance variants for the distribution of allelic skewing. We used discarded sequences (i.e., unique sequences represented by a single Primer ID) and transient genomes defined as having a low abundance SNP in the preconsensus population
0.0001 0.001
Frequency
T1 T2
Discarded Transient
then again at the third time point. These sequences were used to define a set of sequences that could be compared for low frequency abundance in the total data set versus the consensus sequences. The horizontal bars represent the measured frequency of a single copy sequences in the consensus population at T1 and T2. Dark points represent discarded genomes, and light points represent transient genomes with their position indicating their abundance in the total sequence population before construction of the consensus sequences. Blue points represent sequences present at T1, red points represent sequences present at T2. These data show that allelic skewing of 2-fold upward and 10-fold downward is common before the formation of the consensus sequence.
Longitudinal sequencing of the HIV-1 protease (pro) gene in an untreated individual reveals dynamic changes in genetic variation.
consisted of a small number of SNPs. Similarly, Tajima’s D statistic for T1 and T2 in this individual were -2.47 and -2.48, respectively (Table 2.2), indicative of a population structure that has suppressed levels of neutral mutations. This pattern is consistent with but more extreme than that observed in a prior shallow intrahost survey in which a metapopulation model was proposed to explain the pattern of Tajima’s D statistic (55). Figure 2 shows the amino acid variability and synonymous nucleotide variability present in two or more individual genomes across the 99 codons in the pro gene for these samples.
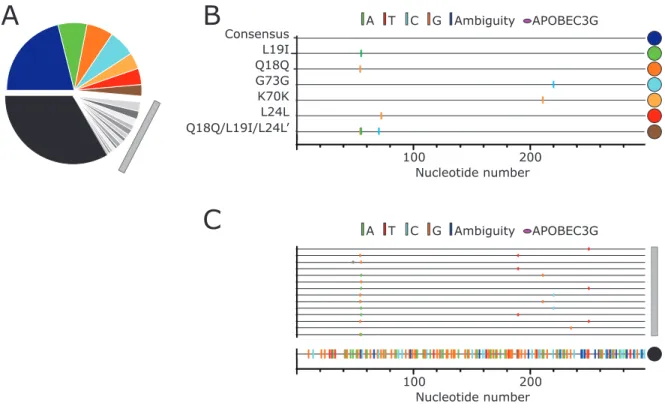
Fig. 2.5 Major and minor allelic variants in the untreated populations. (A) Frequency of major (colored) and minor (grayscale) unique pro gene sequences. Gray colors represent pro
A
B
C
100 200
Nucleotide number
100 200
Nucleotide number L19I
Q18Q G73G K70K L24L Q18Q/L19I/L24L’
Consensus A T C G Ambiguity APOBEC3G
pro gene sequences (>2.5%), with the colored dots on the right indicating the corresponding sequences identified in the pie chart (A). (C) The gray bar corresponds to SNP distribution of variants present between 2.5 and 0.5%, the same sequences indicated in panel A with the gray bar. The line at the bottom indicated by the black circle represents the sum of all variants <0.5% in frequency for the sequences shown in black in the pie chart (A).
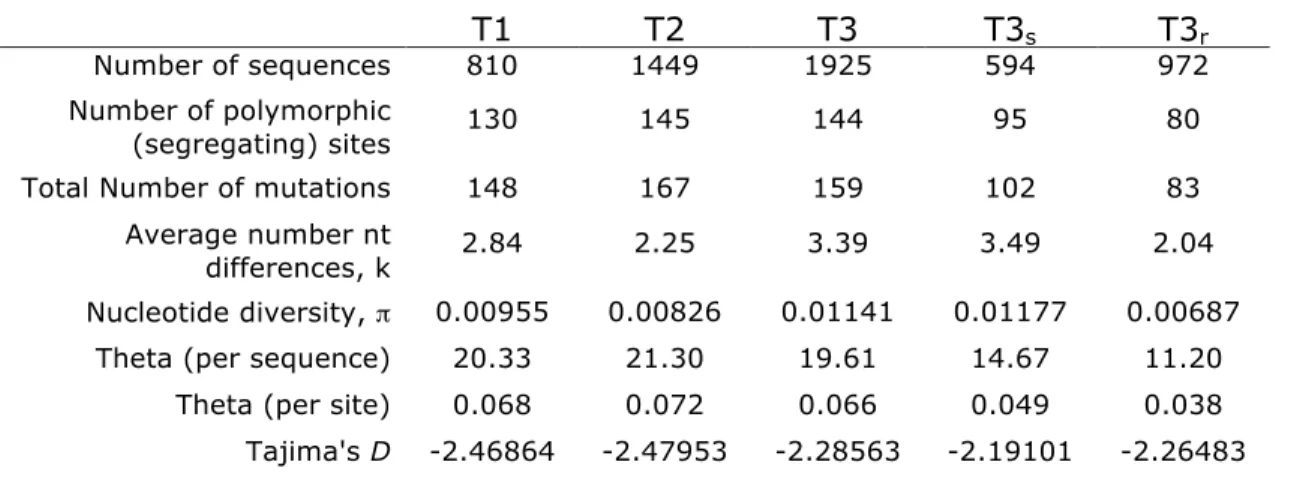
Table 2.2 Summary of nucleotide variation in sampled time points
Synonymous Variability: There were 57 codons (with 63 variants/SNPs) that contained synonymous diversity that appeared in both pre-therapy time points, and 30 codons (with 31 variants) that appeared in only one time point. Taken together, 75 of the 99 codons contained some level of synonymous diversity (Fig. 2.2, Table 2.1). Of the 63 variants that were present in both untreated time points, 92% were transitions. Of the 31 variants that appeared in only one of the time points, 71% were transitions, representing a significantly smaller fraction of transitions than among the synonymous variants that appeared at both time points (p = 0.012;
T1 T2 T3 T3s T3r
Number of sequences 810 1449 1925 594 972
Number of polymorphic
(segregating) sites 130 145 144 95 80
Total Number of mutations 148 167 159 102 83
Average number nt
differences, k 2.84 2.25 3.39 3.49 2.04
Nucleotide diversity, ! 0.00955 0.00826 0.01141 0.01177 0.00687
Fisher’s exact test). This suggests that synonymous transversions are selected against over time.
Nonsynonymous Variability: There were 26 codons (28 variants) that contained coding variability that appeared in both pre-therapy time points, and an additional 28 codons (33 variants) with nonsynonymous changes found in only one of the time points. Taken together, 49 of the 99 codons contained some level of nonsynonymous diversity (Fig. 2.2, Table 2.1). For the 28 nonsynonymous variants detected at both time points, 22 were transitions, and these mostly represented conservative amino acid changes. In the case of synonymous mutations two-thirds of the variants were present at both time points, while in the case of nonsynonymous mutations less than half were present at both time points (p = 0.012; Fisher’s exact test). This observation suggests that at this level of sequence sampling we are able to see a difference in stability within the population in comparing synonymous and nonsynonymous substitutions.
change in diversity between the two time points (T1 p = 0.0079, T2 p = 0.0082 [Table 2.2]). However, the trend of increased abundance at the three sites may be driven by selection of cryptic epitopes in an alternative reading frame (see Discussion).
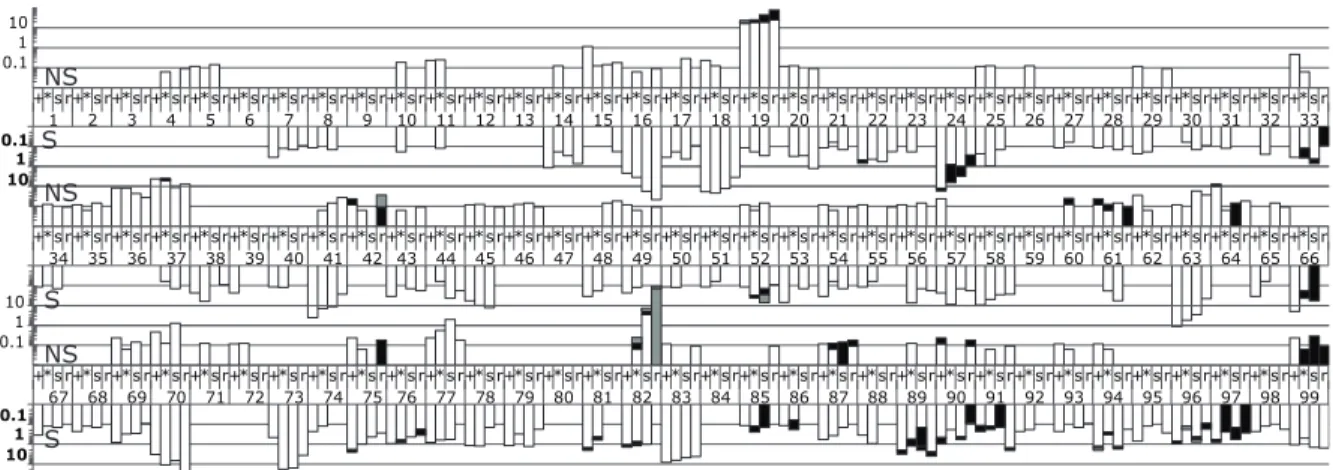
Fig. 2.6 Frequency of codon variation across all 99 positions in protease over three time points. Within a codon position, the first two bars represent untreated time points 1 and 2, respectively. Bars 3 and 4 are the third time point split based on the presence or absence of the resistance mutations to ritonavir. Bar 3 is the population of susceptible genotypes (defined as not V82A, I84V, or L90M), and bar 4 is the major resistant variant, V82A, population. Upward facing bars are nonsynonymous changes (scale in regular typeface), and downward facing bars are synonymous changes (scale in bolded typeface). Within a codon position, different shading represents different SNPs.
Assessment of linkage disequilibrium within the HIV-1 pro gene population
We measured LD for the sequences in the T1 and T2 populations. We identified very few examples of LD at these two time points using the Fisher’s Exact Test with a Bonferroni correction. Of the 103 polymorphic sites in T1, only 3 pairs were in significant LD. Similarly, in T2 with 118 polymorphic sites, only 4 pairs displayed significant LD. A positive D (i.e. linkage) was found for 6 of the 7 pairs in the untreated populations, with one
+*s r+*s r+*s r+*s r+*s r+*s r+*s r+*s r+*s r+*s r+*s r+*s r+*s r+*s r+*s r+*s r+*s r+*s r+*s r+*s r+*s r+*s r+*s r+*s r+*s r+*s r+*s r+*s r+*s r+*s r+*s r+*s r+*s r
1 2 3 4 5 6 7 8 9 10 11 12 13 14 15 16 17 18 19 20 21 22 23 24 25 26 27 28 29 30 31 32 33
+*s r+*s r+*s r+*s r+*s r+*s r+*s r+*s r+*s r+*s r+*s r+*s r+*s r+*s r+*s r+*s r+*s r+*s r+*s r+*s r+*s r+*s r+*s r+*s r+*s r+*s r+*s r+*s r+*s r+*s r+*s r+*s r+*s r 67 68 69 70 71 72 73 74 75 76 77 78 79 80 81 82 83 84 85 86 87 88 89 90 91 92 93 94 95 96 97 98 99 0.1
1 10
0.11
10
+*s r+*s r+*s r+*s r+*s r+*s r+*s r+*s r+*s r+*s r+*s r+*s r+*s r+*s r+*s r+*s r+*s r+*s r+*s r+*s r+*s r+*s r+*s r+*s r+*s r+*s r+*s r+*s r+*s r+*s r+*s r+*s r+*s r 34 35 36 37 38 39 40 41 42 43 44 45 46 47 48 49 50 51 52 53 54 55 56 57 58 59 60 61 62 63 64 65 66
0.11
10
0.1 1 10
NS
S
NS
S
significant role in defining the pro gene population in this late stage individual, with only a single pair of SNPs showing linkage in both of the time points.
Detection of multiple drug resistant alleles after exposure to selection by a protease inhibitor.
The third plasma sample we examined from this subject was from a time point (T3) after the initiation of therapy with the protease inhibitor ritonavir. It is apparent from the cyclical pattern of viral load and self-report that this person had incomplete adherence to the drug regimen (Fig. 2.1). Thus we expected selective pressure from the drug to disrupt the viral population but not to select for the more homogeneous populations that are associated with virologic failure solely due to the appearance of drug resistance. The choice of this sample allowed us to look at the evolution of resistance and the persistence of polymorphisms in both the resistant and nonresistant portions of the population. Over two-thirds of the sequences from T3 carried a resistance mutation, with approximately 50% of the sequences carrying the V82A allele, the most common resistance mutation associated with resistance to ritonavir (122).
While V82A is the most common resistance mutation associated with ritonavir resistance, the I84V allele and L90M allele can also be selected and in combination with V82A can confer a higher level of resistance (46). We detected all three of these distinct drug resistance alleles in the T3 sequence population, collectively representing 69% of the total T3 population: V82A (50% of the population), I84V (5%), and L90M (14%). These three resistance mutations appeared on different genomes, with only a single example of a sequence with two of these resistance mutations (V82A/L90M). In total there were 136 unique sequences carrying the V82A mutation (all with the GCC Ala codon), 29 unique sequences carrying the I84V mutation (all with the GTA Val codon), and 36 unique sequences carrying the L90M mutation.
There were also small groups of pro gene sequences in T3 that appear to be the result of selection by ritonavir. Two other substitutions at position 82, V82I and V82L, were detected at a low level at T2 and also seen at T3 but now representing 1.3% and 1.1% of the population. V82F was also detected as 0.14% of the population at T3. Finally, the compensatory mutation L63P was detected at T1 and modestly expanded at T3, with half of the sequences in the V82A background (Table 2.1).
sequence (Fig. 2.7A). The remaining 29% of the V82A-containing genomes vary in relative abundance from 2.3-0.1%, including over 100 unique sequences that each appeared once but to a large extent represent the variation seen at T1 and T2 added on to the predominant V82A genotypes.
Fig. 2.7 Major and minor unique pro gene sequences in the major resistant populations V82A, L90M, and I84V. (A) Frequency of different unique pro gene sequences carrying the V82A mutation at high frequency (colored >2.5%) and low frequency (<2.5%, black and with the abundance pooled). (B) Highlighter plot showing the sequence changes from the consensus sequence for the major (>2.5%) pro gene variants carrying the V82A mutation.
A
B
100 200
Nucleotide number
A T C G Ambiguity APOBEC3G
C
D
A T C G Ambiguity APOBEC3GA T C G Ambiguity APOBEC3G
E
F
Consensus
Consensus G16G/L19V
L19V L19I L19I K70K L19I/K70K
Consensus G16G/L19V
L19V
100 200
Nucleotide number
L19I L19V G16G/L19V
100 200
The V82A substitution is indicated by the nucleotide change at position 245 shown in light blue. (C) Frequency of different unique pro gene sequences carrying the L90M mutation at high frequency (colored >2.5%) and low frequency (<2.5%, black and with the abundance pooled). (D) Highlighter plot showing the sequence changes from the consensus sequence for the major (>2.5%) pro gene variants carrying the L90M mutation. The L90M substitution is indicated by the nucleotide change at position 268 shown in green. (E) Frequency of different unique pro gene sequences carrying the I84V mutation at high frequency (colored >2.5%) and low frequency (<2.5%, black and with the abundance pooled). (F) Highlighter plot showing the sequence changes from the consensus sequence for the major (>2.5%) pro gene variants carrying the I84V mutation. The I84V substitution is indicated by the nucleotide change at position 250 shown in orange.
were in the consensus sequence background. The remaining sequences are accounted for by the low level variability added onto these major lineages.