©
ABSTRACT
This thesis explores relationships between gender, nudity, and provocativeness in the photographs in The Body Issue of ESPN The Magazine, released yearly from 2009 to 2013. The Body Issue was launched to boost revenue through increased advertising and readership. The Body Issue contains photographs of male and female professional athletes in varying states of nudity, to pay homage to the daily sacrifices athletes make to keep their bodies in incredible shape for maximum performance.
The method of research used in this thesis was a content analysis study. The goal of my research was to be able to objectively analyze various aspects of the photographs across the five-‐year period. I designed the content analysis study to code the 141 total photographs for 19 variables clearly defined in a coding sheet. The purpose of the coding process was to be able to quantify the photographs so that trends and patterns among variables could be determined. Although 19 variables were coded for each photograph, my research was primarily focused on examining the relationships between gender and race, gender and exposure/nudity rating, and gender and provocative level.
ACKNOWLEDGEMENTS
First, I want to thank Dr. Donald Shaw for advising me throughout my honors thesis journey by giving me countless pearls of wisdom. Dr. Shaw taught me that being a scholar should not be limited to the classroom because it is a way of life; I will carry this lesson with me forever.
I also want to thank Dulcie Straughan for being an additional advisor for my thesis, and Joe Cabosky for being a reader. I am very grateful to both of you for your expertise and guidance through the endless drafts of my thesis in various stages.
Thank you to Taylor George, for participating in my content analysis study as a second coder, and for joining Abbey Friend and Margaret Corzel in their constant
motivation for me to stick to my self-‐imposed deadlines throughout the year. Also, thank you to the rest of my teammates and my coaches for supporting me in writing this thesis. Lastly, thank you to my parents and my brothers for always supporting me and encouraging me to push myself to my full potential.
TABLE OF CONTENTS
Chapter 1: Introduction………..1
Chapter 2: Method……….8
Chapter 3: Findings & Discussion………..22
Chapter 4: Conclusion………..52
Appendix A: Example Photographs, Low-‐High Provocative Level Male & Female………...59
Appendix B: Coding Sheet...65
Appendix C: Entire Coded Data, 141 Photographs...70
Appendix D: Intercoder Coded Data, Sample 30 Photographs...79
References...82
LIST OF ALL TABLES & FIGURES
Table 1: Holsti Calculations, 19 Total Variables...18
Figure 1: Gender, 2009-‐2013...24
Figure 2: Race & Gender, 2009...25
Figure 3: Race & Gender, 2010...26
Figure 4: Race & Gender, 2011...27
Figure 5: Race & Gender, 2012...28
Figure 6: Race & Gender, 2013...29
Figure 7: Exposure Rating, 2009-‐2013, From Adequate Coverage (1) to Full Nudity (3)...32
Figure 8: Male Exposure Rating, 2009-‐2013, From Adequate Coverage (1) to Full Nudity (3)...34
Figure 9: Female Exposure Rating, 2009-‐2013, From Adequate Coverage (1) to Full Nudity (3)...34
Figure 10: Exposure Rating & Gender, 2009, From Adequate Coverage (1) to Full Nudity (3)...35
Figure 11: Exposure Rating & Gender, 2010, From Adequate Coverage (1) to Full Nudity (3)...36
Figure 12: Exposure Rating & Gender, 2011, From Adequate Coverage (1) to Full Nudity (3)...37
Figure 13: Exposure Rating & Gender, 2012, From Adequate Coverage (1) to Full Nudity (3)...37
Figure 14: Exposure Rating & Gender, 2013, From Adequate Coverage (1) to Full Nudity (3)...38
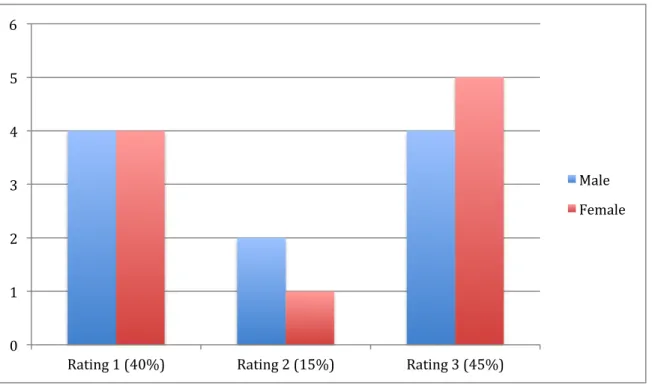
Figure 15: Provocative Level, 2009-‐2013, From Low (1) to High (3)...42
Figure 16: Female Provocative Level 2009-‐2013, From Low (1) to High (3)...43
Figure 17: Male Provocative Level, 2009-‐2013, From Low (1) to High (3)...44
Figure 18: Provocative Level & Gender, 2009, From Low (1) to High (3)...47
Figure 19: Provocative Level & Gender, 2010, From Low (1) to High (3)...48
Figure 20: Provocative Level & Gender, 2011, From Low (1) to High (3)...49
Figure 21: Provocative Level & Gender, 2012, From Low (1) to High (3)...50
Chapter 1: Introduction
Sports have always played an important role in my life and, in fact, have largely
shaped me to be the person I am today. Self-‐discipline, perseverance and drive are a few of
the many qualities ingrained in my character that I directly attribute to the impact of
sports. Since I have played sports my whole life, and my athletic scholarship to play on the
women’s lacrosse team is the reason I am a student at UNC, I am clearly naturally inclined
to be interested in all things athletic and sports-‐related.
Upon embarking on the journey of selecting a senior honors thesis topic, I was sure
of only a few things: I wanted to study magazines, I wanted to incorporate my interest in
photography, I wanted to incorporate sports somehow, and that I wanted my research to
be relatively current, or even forward-‐looking. Even within these parameters, the
opportunities were endless, until I came across one that was a perfect fit: ESPN’s Body
Issue.
I have never personally subscribed to ESPN The Magazine, but my two brothers
shared a subscription, so I was consistently exposed to the magazine while growing up.
Therefore, I knew about ESPN’s Body Issue prior to beginning my thesis, so when the topic
crossed my mind in the brainstorming stage of my thesis planning, I knew I wanted to learn
more.
Upon further exploration, ESPN’s Body Issue was a perfect cross-‐section of many of
my interests: magazines, athletics, and photography. Before delving into the specifics of my
thesis, I will share some background information on ESPN The Magazine overall and
Background Information
The Body Issue is a relatively new feature of ESPN The Magazine, with the inaugural
issue hitting the newsstands in October 2009. There have been five total editions of The
Body Issue, ranging from the inaugural issue in 2009 to the most recent one in July 2013.
The month in which The Body Issue is featured varies per year, but there is only one
edition of The Body Issue for each year.
For each edition, there are six different covers shot, but only one cover is dubbed by
ESPN The Magazine as the primary newsstand cover of The Body Issue for that year. The
other five covers are acknowledged as covers inside the issue, and sometimes the cover
changes for newsstands in various states depending on the market or demographic.
Origins of The Body Issue
Even though one of ESPN The Magazine’s primary competitors, Sports Illustrated,
had been releasing a special “Swimsuit Edition” for decades, ESPN The Magazine was a
compete newcomer to the ‘skin game’ in 2009, which prompted many people to speculate
the reasons behind The Body Issue. There are various explanations for motives behind
launching The Body Issue, yet the underlying purpose continuously points to financially
driven reasons.
Financial Motive of The Body Issue
The primary motive of ESPN The Magazine introducing The Body Issue in 2009 was
fiscal, both in terms of striving to increase appeal to readers as well as to advertisers. The
release of the inaugural 2009 issue that ESPN’s Body Issue was intended to “show off what
print could do, both for advertisers and for readers.”1
This statement holds meaning for ESPN The Magazine as well as for the overall
magazine industry, for 2009 marked a pivotal point for the industry as well as for various
other print media, in which advertisements were starting to go digital and force print
media to abandon print and go solely digital as well. Additionally, the economic recession
in 2008 forced all industries, not just print journalism, to focus on the bottom line more
than ever, as corporate America was facing a “sink or swim” situation.
ESPN The Magazine chose to effectively ‘swim’ their way out of the recession by
introducing The Body Issue as a special edition issue to spark interest for advertisers and
readers in order to boost revenue.2 Belsky, the editor-‐in-‐chief, explains the situation ESPN
The Magazine was facing, along with hundreds of other businesses in the print news
industry, in the following way: “These days, people are skeptical enough about print, or at
least wary enough about print, that they’re looking for executions that differentiate print.
Print can’t deliver music, video, but what print can deliver is beautiful, in-‐depth visuals and
journalism that explores subjects in a particular kind of way.”3 This perspective on the
situation facing print journalism in 2009 explains why ESPN The Magazine turned to
adding a special edition Body Issue in hopes of restoring the interest of advertisers and
reminding the public why print journalism is irreplaceable even in the new digital era.
1 Clifford, Stephanie. "Special Issues A Bright Spot For Magazines." The New York Times. The New York Times, 11 Oct. 2009. Web.
http://www.nytimes.com/2009/10/12/business/media/12adco.html?_r=0 . 2 Ibid.
The economic motives behind introducing The Body Issue in 2009 paid off in a big
way for ESPN The Magazine being able to attract more advertising dollars from advertisers
interested in The Body Issue, evident in how the inaugural Body Issue made October 2009
the most successful October issue in terms of revenue in the history of the magazine.4 The
primary motive of the magazine has been clearly established as economic, and it is
important to acknowledge that what appealed to the advertisers in the first place was the
state of nudity or near nudity of many of America’s most well-‐known athletes that
advertisers accurately anticipated would draw more attention than usual to ESPN The
Magazine.
Therefore, ESPN The Magazine seems to be dangerously close, many would argue, to
exploiting the nakedness of these athletes in order to boost revenue because of the fact that
advertisers would increase ads solely because of the nudity of the athletes. Exploitation
often has a negative connotation, but in this case it appears that ESPN The Magazine was
not aiming to take advantage of the athletes because the athletes photographed might also
have benefited from increased publicity, so it may be more of a mutually beneficial
relationship than an exploitative one in a negative manner.
The Body Issue as a Tribute to Athletes’ Sacrifices
The financial motives behind The Body Issue were not hidden from the public, yet
ESPN The Magazine also presents the rationale behind The Body Issue in a different way
that has no economic ties. There is no question that the provocative nature of The Body
Issue is clearly what sparked the advertising increase and subsequent revenue boost, but
ESPN The Magazine presents another reason for showcasing nude or nearly nude athletes
beyond attracting more eyes and dollars.
On the portion of its website dedicated to The Body Issue, ESPN The Magazine gives
the following blurb as the purpose of The Body Issue: “It's okay to stare. That's what The
Body Issue is here for. Each year, we stop to admire the vast potential of the human form.
To unapologetically stand in awe of the athletes who've pushed their physiques to
profound frontiers. To imagine how it would feel to inhabit those bodies, to leap and punch
and throw like a god. To ... well, gawk. So go ahead; join us.”5
The phrases that stand out in the above statement from ESPN The Magazine on the
given purpose of The Body Issue are “stop to admire,” “unapologetically stand in awe,” and
“to leap and punch and throw like a god.” All of these phrases convey a tremendous respect
for the bodies from a physical, athletic standpoint. That is, not in a sexual way, a
provocative way, or a seductive way, but in a purely physical way. The point of emphasis is
on the physical form, and all of the sacrifices these athletes make daily in order to reach
that ideal physical form in terms of strength and muscle.
This perspective of looking at The Body Issue as a channel through which ESPN The
Magazine can pay homage to athletes is a very different perspective than the one
commonly held across media after the release of the inaugural 2009 issue. Many media
outlets saw it as an easy way to boost revenue by capitalizing on the willingness of athletes
to be nude or nearly nude, and selling the sexiness of the photographs, in essence.
For instance, Huffington Post claimed that The Body Issue was ESPN The Magazine’s
way of “trying to give Sports Illustrated a run for its money,” referring specifically to the
Sports Illustrated Swimsuit Edition, which is renowned for its suggestive and sexualized
photographs, mostly of models instead of athletes.6 That comparison to the Sports
Illustrated Swimsuit Edition is a commonly held belief, yet one that ESPN The Magazine is
clearly trying to undermine by claiming that the purpose of The Body Issue is primarily a
tribute to the physical achievements of these athletes.
Whether or not the claim of paying homage to athletes’ bodies is purely a move on
the part of ESPN The Magazine to uphold a healthy reputation in terms of truly respecting
athletes’ bodies, and not simply profiting from the sex appeal of the athletes’ bodies, is a
subjective matter, yet it is important to acknowledge both viewpoints before introducing
the specifics of my thesis on The Body Issue.
Goal of Thesis
When I decided on ESPN’s Body Issue as the subject for my thesis, I knew that I
wanted the photographs to be the basis of my analysis and my primary focus. When
analyzing photographs, it is easy to fall prey to biased, subjective analysis because there
isn’t a shared language to specifically analyze photographs in an objective manner.
My goal was to be able to objectively discuss trends and patterns within the
photographs of the five years of The Body Issue. In order to achieve this goal, I needed to
find a way to quantify aspects of the photographs so that I could analyze the trends
established on the findings.
A common method used to quantitatively analyze photographs is a content analysis
study, because it provides measurable data from which qualitative conclusions can be
6 Thomson, Katherine. "ESPN's 'Body Issue' Of Naked Athletes (PHOTOS): Serena Williams, Dwight Howard, Adrian Peterson, More Pose Nude (PICTURES)."The Huffington Post.
drawn. Therefore, a content analysis study seemed to be the most effective course of action
to explore the photographs of The Body Issue.
The specifics of my method of content analysis will be presented in the following
chapter, yet the overall purpose was to measure specified variables within each of the 141
photographs across the five issues of The Body Issue from 2009 to 2013.
Research Questions & Hypotheses
The content analysis study is exploratory in nature in that I designed it to be a basis
for analytical discussion from the findings, and it was not designed to answer only limited
questions. Nonetheless, I established research questions and subsequent hypotheses prior
to beginning the content analysis coding of the photographs in order to guide my data
analysis and findings.
My research questions are whether or not the nudity/exposure rating and as well as
the provocative level increases over time and whether or not the gender of the athlete
photographed impacts the above research questions. You can see examples in Appendix A
of photographs of all three provocative levels for both genders.
My exploratory hypotheses to these research questions are that both the
nudity/exposure rating and provocative level will increase over time, yet there will be a
difference between genders for these two variables as to which gender shifts to a higher
rating/level. Specifically, I hypothesized that the nudity/exposure rating will start to
increase at an earlier time for males than females, but provocative level will start to
increase at an earlier time for females than males. My reasoning and supporting external
sources for these hypotheses will be discussed in conjunction with presenting my findings
Chapter 2: Method
Overview
Within this chapter, I explain my goals for the content analysis performed, the
method of content analysis, what variables were part of the coding process, the process of
testing intercoder reliability and what sort of data were collected. As discussed in Chapter
1, The Body Issue revolves around photographs of nude or semi-‐nude athletes, so a content
analysis examining trends and patterns of different variables about the photographs is an
effective way to quantitatively measure visual data. The purpose of this study is to explore
potential trends and patterns in the photographs of ESPN’s Body Issue over the five years
of its existence. The method of content analysis is an effective way to meet that purpose.
Goals & Objectives
My goals entering this study were to identify quantitative trends in the photographs,
such as number of females per year, or number of brown haired male athletes overall or
any total number for each variable. In order to effectively identify both specific and broad
trends, I decided to code every photograph from all five issues from 2009 to 2013.
Not only did I set out to measure my variables statistically, I had the objective of
looking for relationships with variables, or even lack of relationships. For instance, are
there more females with the highest coding of provocative level, or does the nudity have
any relationship with age?
I approached this visual content analysis with an exploratory outlook because I was
this uncharted territory from a quantitative perspective to shed light on the collected data
from an analytical point of view.
Analyzing the numerous portraits in a content analysis effectively presents me with
data from which I can identify trends and patterns over time as well as from year to year,
and potentially forecast future trends. Therefore, my research goals in this content analysis
were to discover frequencies from the multivariate data extracted from the photographs
based on my pre-‐set coding sheet in order to establish a consistent form of measurement.
Research Design
The research design of this content analysis drew on a definition of research design
from scholar Ole Holsti, “a plan for collecting and analyzing data in order to answer the
investigator’s question,” which scholar Daniel Riffe describes as having an “emphasis on
utilitarianism…[that] is singular and suggests the gold standard for evaluating research
design.”7 My research design intended to create a pool of aggregated data through the
content analysis applied to the photographs using the preset coding sheet of variables, to
be addressed later, from which I could later analyze in light of my research questions.
Creating data in this instance refers to converting the visual content of the photographs
into statistically measurable variables based on categories laid out in the coding sheet. By
converting it from a visual form into a number attached to a variable, there is a concrete,
measurable piece of data that can then be analyzed in a number of ways.
Coding Sheet
Establishing a consistent form of measurement, the coding sheet, is a necessity for
later proving its validity and reliability, which would then indicate the validity of the data
derived from coding the photographs. Applying a quantitative methodology to visual data
like photographs is especially useful when the photographs are accompanied with textual
information that is relevant to the variables I am measuring, like the age and type of sport,
or any variable that you cannot necessarily obtain from just looking at the photographs.
The variables included in the coding sheet for my study, which can be found in
Appendix B, include the following: type of journal, date, issue, section, page number, photo
size, photo color, name, gender, number of people, race, hair color, age, sport, type of sport,
nudity/exposure rating, provocative level, usage of prop, and setting. In total, there are 19
variables measured in this content analysis on the photographs in The Body Issue.
A crucial aspect in designing a coding sheet is clearly defining the variables included
in the study. Including clear definitions is what gives the coding sheet substance, and what
gives the variables being coded a context in which to be examined.
Research Questions
As mentioned in Chapter 1, my research questions are whether or not the
nudity/exposure rating as well as the provocative level increases over time and whether or
not the gender of the athlete photographed impacts the aforementioned research question.
My exploratory hypotheses to these research questions are that both the nudity/exposure
rating and provocative level will increase over time, yet there will be a difference between
genders for these two variables as to which gender shifts to a higher rating/level.
Specifically, nudity/exposure rating will start to increase at an earlier time for males than
females, but provocative level will start to increase at an earlier time for females than for
males. My reasoning and supporting external sources for these hypotheses will be
Although my research questions focus on the variables of gender, nudity/exposure
rating, and provocative level, there are 16 other variables carefully coded for every
photograph. Of the 19 total variables, seven are objective facts about the photograph, such
as which year the issue was published, the size of the photo, etc., which are important
aspects to record in order to establish the context of the content of the photographs. Other
variables are not as unequivocal as the seven objective variables just mentioned, yet not as
subjective as the two variables I am most focused on examining in my research questions,
which are the nudity/exposure rating and the provocative level. The variables that are
mostly objective, yet still at risk to be interpreted differently between different coders
include hair color, race, gender, use of prop, and setting.
Variation
The coding sheet clearly states the parameters of the variables considered under the
content analysis in this study that I followed in creating my pages of coded content. The
existence of variation, which is simply having multiple variables, is crucial to a content
analysis because “variables can be summarized and analyzed quantitatively by assigning
numbers to show these variations, and content analysis assigns numbers that show
variation in communication content.”8
This communication content is precisely what my research questions are designed
to explore for what ESPN The Magazine is trying to communicate through the photographs
of the athletes over the years, and whether the communication content changes over time
within the variables tested. Measurement at its most basic level is the “reliable and valid
process of assigning numbers to units of content,” which is what I aimed to accomplish in
my coding sheet through assigning different numbers to different types of content.9
Types of Communication Examined
There are several types of communication that structure the content of The Body
Issue photographs used in the content analysis of this study. Visual communication is a
large portion of my content analysis in that it “involves efforts to communicate through
nontext symbols processed with the eyes.”10 However, visual communication does not
comprise the entire content examined in the content analysis because the text captions
accompanying the photographs provide important information necessary to code some of
the variables on my coding sheet, like age or sport.
When combining the visual element, the photographs, with the textual element, the
photograph captions, the measurement is known as multiform presentations of
communication. This multiform presentation of communication is what will best answer
the research questions posed earlier, because it captures the necessary background of the
photograph that will provide context for the photograph. As mentioned earlier in the
section on the coding sheet, context for the coding also comes from the definitions of each
variable explicitly stated on the coding sheet.
Sampling
The matter of sampling is an important aspect of content analysis and responds to
the question posed by Daniel Riffe in his model of content analysis, “how much data would
be needed to test the hypothesis?”11 However, Riffe acknowledges that there is a distinction
9 Riffe, Daniel. (p. 63)
between a sample of the content analyzed and all relevant content. This distinction exists
because measuring all of the content is usually unrealistic to be able to analyze in most
situations.
The total relevant content for this study includes every photograph of an athlete in
the five issues of The Body Issue from 2009 to 2013, which adds up to 141 units of content
to study. Therefore, it was manageable to actually code all 141 units, in effect measuring ‘all
content relevant’ to the study.
Although I was capable of performing the content analysis for all content relevant to
the study, when replicating this study to test the reliability of the coding sheet, I selected a
random sample of the 30 units of the total population for an additional coder to code
according to my given coding sheet. Before delving into the necessity and process of
intercoder reliability, it is important to first examine my coding process to give a full
account of the method used in this study.
The Coding Process
I coded all 141 photographs by closely following my preset coding sheet and
checking over each photograph twice before moving onto the next. I accessed the
photographs via a digital magazine subscription service called Zinio, which allows users to
pay for full copies of back issues of many magazines in a digital format. I was not able to
acquire the print editions of all five issues, so in the interest of consistency, I used the
digital version for coding all five issues.12 The digital edition does not change anything
12 “The Body Issue.” ESPN The Magazine. October 2009. ESPN. Accessed: Zinio, https://www.zinio.com/www/user/library/
“The Body Issue.” ESPN The Magazine. October 2010. ESPN. Accessed: Zinio, https://www.zinio.com/www/user/library/
about the magazine from the print edition, except for being able to virtually access it on any
internet-‐enabled device. The page numbers and layout are exactly the same as the print
version, which I verified by cross-‐referencing the three print editions of The Body Issue
that I was able to obtain.
In the actual coding process, I entered all of the data into an Excel spreadsheet
organized by photograph in column and in variable by row. This Excel spreadsheet of all
coded content can be examined in Appendix C.
Strictly following the coding sheet is crucial for two reasons. First, any and all trends
and relationships I establish in the later section on findings may not be valid if there were
any careless mistakes in my coding process, or if I recorded any inaccurate data. Second, if
data I entered were incorrectly coded, there would be unnecessary inconsistencies when
testing for intercoder reliability, which is an important aspect of the content analysis
methodology.
Intercoder Reliability Introduction
Intercoder reliability at its core “requires that different coders applying the same
classification rules to the same content will assign the same numbers.”13 This definition
stipulates the goal of consistency in coding results no matter who is coding the content as
long as the individual is using the preset coding sheet.
One important aspect of reliability for a content analysis is that often “the quality of
the data reflects the reliability of the measurement used,” which in this study is the coding
“The Body Issue.” ESPN The Magazine. July 2012. ESPN. Accessed: Zinio, https://www.zinio.com/www/user/library/
“The Body Issue.” ESPN The Magazine. July 2013. ESPN. Accessed: Zinio, https://www.zinio.com/www/user/library/
process.14 Capturing intercoder reliability is the primary way to test the reliability of a
measurement method in order to know the quality of the data.
Another perspective on intercoder reliability is how it refers “to the extent to which
two or more independent coders agree on the coding of the content of interest with an
application of the same coding scheme,” which points again to striving for consistency.15
Importance of Intercoder Reliability
In addition to being the standard measure of research quality for the method of
content analysis, intercoder reliability is also important in establishing strengths of the
research design. Without intercoder reliability, or even with a weak level of intercoder
reliability, the research design will be questioned and therefore the data collected might be
viewed as not sound, and therefore not legitimate.
Weakness in intercoder reliability can be a result of a poor coding sheet through
either a complete lack of definitions for differences in codes for each variable, or simply
through “poor operational definitions with unclear coding categories.”16 Either of these
issues could produce weak intercoder reliability that would put the validity of both the
method and the results at risk.
Measurement in Intercoder Reliability
There are more than 30 different ways to statistically measure intercoder reliability,
but only a few are regularly used.17 The most widely used measure is percent agreement,
because of the ease and straightforwardness of this measure.
14 Riffe, Daniel. (p. 122)
15 Cho, Young Ik. "Intercoder Reliability." Encyclopedia of Survey Research Methods. Ed. Paul J. Lavrakas. Thousand Oaks, CA: SAGE Publications, Inc., 2008. 345-‐46. SAGE knowledge. Web.
This method “is measured by the proportion of coding decisions that reached
agreement out of all coding decisions made by a pair of coders,” and essentially captures
how similar the coding results are between two coders, which can prove intercoder
reliability in a very clear and digestible way.18 This is the method that I chose to test
intercoder reliability in the content analysis of this study.
Intercoder Reliability: Percent Agreement Method
The desired proportion of agreement in the percent agreement measurement
method varies on how many categories are present in the coding sheet, and whether the
categories are nominal or ordinal. These two factors can impact the proportion of
agreement captured in the intercoder reliability.
There are different types of percent agreement indexes to measure proportion of
agreement and they vary based on the design of the coding sheet, number of units tested,
or number of units coded. For instance, “Holsti's CR, a variation of percent agreement index,
accounts for different numbers of coded units each coder produces,” which is a relevant
agreement index for testing intercoder reliability in my study because the second coder for
this study only coded a random sample of 30 photographs out of the total of 141.19
Intercoder Reliability: Desired Agreement
The intercoder reliability coefficient determined in measuring percent agreement
will range from 0, complete disagreement, to 1, which is perfect agreement. The optimal
coder agreement is a coefficient of 0.9 or higher, which qualifies the study as highly
reliable. However, an agreement coefficient of 0.8 or higher is accepted in most studies.20
18 Cho, Young Ik. (p.345)
Prior to beginning the intercoder process, I established an overall intercoder
reliability goal of an agreement coefficient of a minimum of 0.8, which is an acceptable
level.
Intercoder Reliability: The Process
The method of intercoder reliability used in this content analysis consists of using
one other coder to independently code a random sample of the total population of units
coded for the content analysis.
The additional coder who agreed to participate in this study is Taylor George, a
senior advertising major in the UNC-‐CH School of Journalism and Mass Communication. I
trained Taylor by walking her through the coding process by coding two photographs
together and ensuring that she felt confident with the ins and outs of the coding sheet
before she embarked on her independent process of coding the 30 randomly selected
photographs throughout the entire population size of 141 photographs. The results of her
coding can be found in Appendix D.
The sample population included 30 randomly selected photographs, because 30
photographs accounts for a little over 20% of the total population. This is a sufficient
percentage of the population to be able to generalize the results of the intercoder
agreement coefficient to the entire study and establish the level of reliability.
Intercoder Reliability Coefficient Outcome
As stated earlier, the desired intercoder reliability coefficient is 0.8 or higher. The
intercoder agreement coefficient measured in this study is 0.95, when all 19 variables are
study as highly reliable. The 0.95 coefficient covers all variables, including the objective
ones that will most likely result in perfect intercoder agreement, barring any carelessness.
The most subjective variable measured was the provocative level of each
photograph, so I calculated a separate intercoder agreement coefficient of 0.8 for just that
variable within the 30 photographs coded by Taylor. While not as high as the overall
coefficient of 0.95, an agreement coefficient of 0.8 is still accepted in a study, especially
when it is regarding a particularly subjective variable to measure. Although, the agreement
coefficient for provocative level is emphasized because of the subjective nature of the
variable, the Holsti calculations of the agreement coefficient for all 19 variables can be
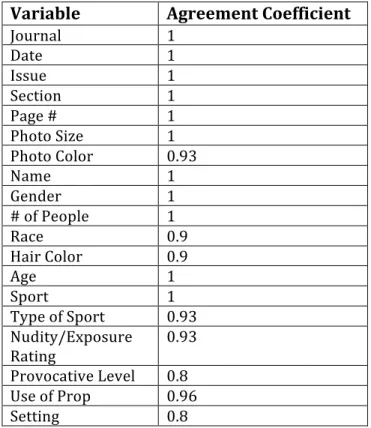
viewed in the following table.
Variable Agreement Coefficient
Journal 1
Date 1
Issue 1
Section 1 Page # 1 Photo Size 1 Photo Color 0.93
Name 1
Gender 1 # of People 1
Race 0.9
Hair Color 0.9
Age 1
Sport 1
Type of Sport 0.93 Nudity/Exposure
Rating 0.93 Provocative Level 0.8 Use of Prop 0.96 Setting 0.8
Apart from the agreement coefficient for provocative level discussed earlier, all
calculations indicate a high level of agreement because they are all above 0.9 except for
setting, which was 0.8. Although 0.8 is still accepted, it indicates the possibility of confusion
in the section of my coding sheet that defines the classifications for the setting variable.
Since the existence of setting in a photographs is primarily objective, the lower agreement
than the rest of the variables could potentially stem from a lack of clear definitions for
setting in the coding sheet.
Validity
Another important aspect of the methodology of a content analysis study is
pursuing validity throughout every step of the content analysis method. The findings of the
content analysis are not significant or even legitimate if the method used is stripped of all
validity.
The reason that the majority of this chapter discusses the significance of reliability is
because the chances that study results are valid increase greatly if there is high reliability
within the various aspects of the study. Therefore, the high reliability of the intercoder
agreement coefficient measured indicates high validity of the study as well.
Validity refers to the valid measurement of the content in the study, and it can be
conceptualized in a number of ways depending on how it is relevant to the specific study at
hand.
Validity: A Social Dimension
One notion of validity relevant to the study in this thesis is how validity can have a
“social dimension that relates to how such knowledge is understood, valued, or used.”21
Knowledge can be valued as meaningful when the language used to discuss the knowledge
is common, in addition to being “a common frame of reference for interpreting the
concepts being communicated and a common evaluation of the relevance, importance or
significance of these concepts.”22 When this social dimension of validity is accomplished by
establishing meaningfulness, the data can then be assessed in terms of significance because
validity is proven.
Goals for Subsequent Data Analysis
The final methodological step of content analysis is the actual data analysis section,
in which it is once again important to return to the goals and/or hypotheses of the research
study. The goals of data analysis stem from the goals in designing the content analysis, and
the goals for analysis in this study involve both simple and complex ones.
Riffe described a simple goal in describing characteristics of a population, like
“learning the frequency of occurency of some particular characteristic to assess what is
typical or unusual,” which I have adopted as a goal in the data analysis in this study. This
goal is seen in the research goal measuring gender correlated with exposure rating and
provocative level.23
In a more complex approach, I also have an additional goal of seeking out patterns in
the aforementioned described characteristics. This goal of describing relationships
between characteristics instead of just characteristics alone is aided by “illuminating
patterns of association between characteristics of one thing and characteristics of
22 Riffe, Daniel. (p. 157)
another.”24 These patterns will establish trends and address the research questions posed
in this study from an exploratory perspective.
Method Conclusion
This chapter on method attempts to present the full extent of the method used in
this study in a clear and straightforward way. In going through all of the steps in a detailed
manner as well as explaining the significance of each step, it will make the findings
presented in Chapter 3 comprehensible and easier to digest. Also, establishing the high
intercoder reliability of this study lends validity to the method and subsequently, the
findings, of this study.
Chapter 3: Findings and Discussion
Overview
The goal of the content analysis study conducted for this thesis was to explore
potential trends or patterns in the variables measured across the 141 photos. As
mentioned in Chapter 2, these variables were carefully defined on a coding sheet in order
to sustain consistency and validity. After the content analysis study was conducted, the
next step was to organize the data collected and analyze specific sections of data. Although
a total of 141 photos were coded for all 19 variables, for the purposes of this chapter on
findings, the photos analyzed across years were only the ones included in the “Bodies We
Want” section of The Body Issue because it is the section that showcases the featured
photos of the year and contains the most photos within each of the five issues.
Conditions of Data Analysis
As mentioned previously, the photos specifically analyzed and dissected for the
findings section are from the “Bodies We Want” section, so that is the first condition to be
aware of when exploring this chapter.
The second condition established prior to my data analysis is that when an athlete
had more than one photo in the “Bodies We Want” section, he/she still only counted for one
individual when tallying the statistics, because it was the same person even though
photographed two times. This condition held true when tallying total number of
individuals per year as well as tallying the percentages for gender, race, provocative level
successive photographs, yet she was not counted twice for being a female, or African-‐
American, but instead just once because she is one individual, albeit in two photographs.
Following that condition is the last important clarification necessary to understand
this chapter by indicating the protocol for recording exposure rating and provocative level.
In an instance of one individual repeating in two photographs, if the exposure rating was
different for the two photographs, the one recorded was the rating that was more exposed,
and also the higher number. For instance, in 2009, Natasha Kai had one photograph with a
nudity/exposure rating of 3, which is fully nude, and another with a nudity/exposure level
of 2, which is partially clothed. The recorded exposure rating for Natasha Kai was 3
because she was willing to be photographed fully nude, which is important when later
analyzing exposure ratings compared to gender.
When looking at provocative level, the same is held true, namely that if there is a
difference in provocative level between two photographs of the same individual, the one
recorded in the statistics is the higher provocative level because that individual was willing
to be photographed in a more provocative way. So even if an individual were photographed
with a provocative level of 1, but then received a provocative level of 3 in the next
photograph of them, the recorded provocative level for that individual would be the 3
because it demonstrates the willingness of the athlete to go to that level.
These conditions were established prior to tallying up the statistics of this chapter
in order to establish consistency across the findings so the data were not skewed if an
individual had repeat photographs and different stats for both photographs. The higher
exposure rating and provocative levels assigned were recorded because even if the
extreme, and that willingness is what contributes to whether there are trends or patterns
across variables.
Gender Overall Findings
Figure 1 depicts the gender breakdown in the athletes photographed in the “Bodies
We Want” section of The Body Issue over the five years of its existence. In 2009, there were
an equal number of males and females photographed. In 2010, it appears that there were
significantly more females, yet a very important distinction to note is that one photograph
contained 12 females, which skewed the percentage to be 64.5% females to 35.5% males.
In 2011, it returned to an even 50/50 breakdown of males and females. In 2012, another
spike in the number of females appeared for the same reason as in 2010; in one photo there
are seven females, which skews the percentage in favor of females. In 2013, the breakdown
was nearly even with 11 females and 10 males. Although the female percentage is skewed
in both 2010 and 2012 due to a single photograph containing many females, it is still
0 5 10 15 20 25
2009 2010 2011 2012 2013
Male Female
important to note, because in the five years of The Body Issue featuring “Bodies We Want,”
there was never a photograph with more than one male in it. Outside of the two years with
the distorted female percentages, the gender breakdown stayed around 50% throughout
the existence of The Body Issue.
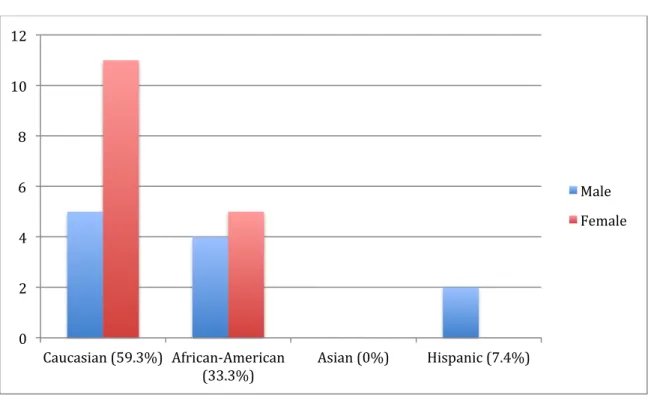
Gender & Race Findings
The next set of findings examines the role of race and gender within each of the
five years of The Body Issue. The four different races of athletes documented in The Body
Issue are Caucasian, African-‐American, Asian and Hispanic.
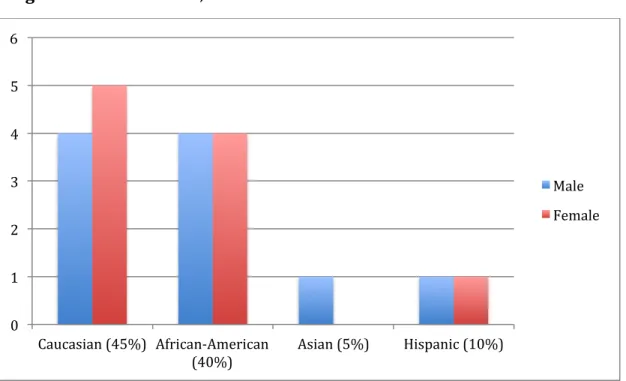
In 2009, there was a clear majority of Caucasian and African-‐American athletes,
with only a combined 15% of Asian and Hispanic athletes. It was relatively equal in terms
of numbers between Caucasian and African-‐American athletes. One possible explanation
for the very low number of Asian and Hispanic athletes represented in The Body Issue is
0 1 2 3 4 5 6
Caucasian (45%) African-‐American
(40%) Asian (5%) Hispanic (10%)
Male Female
that it could simply be a reflection of the overall proportion of well-‐known professional
Asian and Hispanic athletes in the United States.
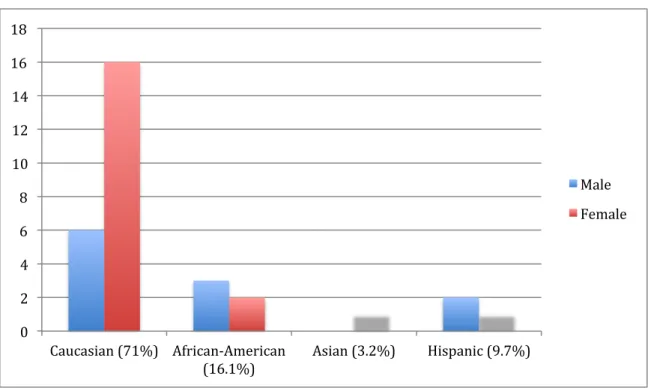
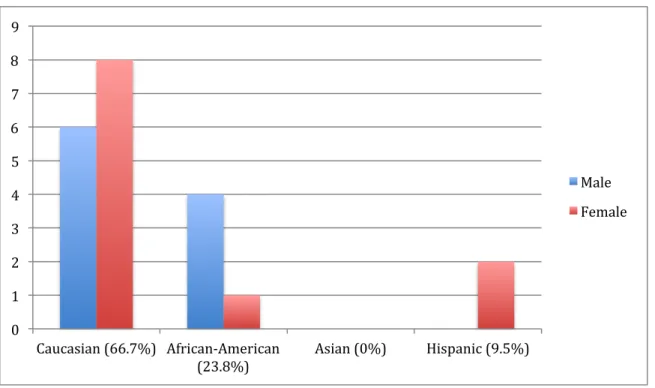
In 2010, the proportion of Caucasian athletes compared to the three other races
included grew significantly from 2009. The number of Caucasian females is noticeably high
because as mentioned earlier, there was one photograph in 2010 with 12 Caucasian female
athletes in that single photo, which dramatically affected the race ratio as well as the
gender ratio for 2010.
Even though that photo with 12 Caucasian females dramatically increased the
overall Caucasian percentage, there were still very few African-‐American, Asian and
Hispanic athletes, which is an important finding. The shift towards a majority of Caucasian
0 2 4 6 8 10 12 14 16 18
Caucasian (71%) African-‐American
(16.1%) Asian (3.2%) Hispanic (9.7%)
Male Female