TABLE OF CONTENTS
ABSTRACT……….4
CHAPTER 1: INTRODUCTION……….………...6
Introduction……….……….6
Purpose……….8
Research Questions………..8
Hypotheses………...8
Study Limitations………...9
Study Delimitations………...9
Variables……….………...10
Operational Definitions………....………..11
CHAPTER 2: REVIEW OF LITERATURE……….13
Physical Activity and Lifetime Health Promotion……….13
Articular Cartilage of the Knee………..13
Impact of Movement Profile on Joint……….………...15
Lean Body Mass and the Knee Joint………...…………...17
Knee Joint Health………...18
The Interactive Influence of Lower Extremity Mass Composition and Movement Profile on Cartilage Thickness………..19
CHAPTER 3: METHODOLOGY……….21
Subjects………...21
Movement Profile Screening……….22
Informed Consent & Ethical Considerations……….23
Protocol………..23
Data Reduction………...24
Statistical Analysis………..………...25
CHAPTER 4: RESULTS………...26
Demographics………...26
Lean Body Mass…...……….26
Cartilage………...27
Lean Body Mass and Cartilage………...………...27
Table 1………...29
Table 2………...30
Table 3………...31
CHAPTER 5: DISCUSSION………..………...32
APPENDIX A……….………...37
ABSTRACT
Emily Dean: The Influence of Movement Profile on Measures of Knee Cartilage Health and Body Mass Composition
(Under the direction of Dr. Prentice)
Purpose: The primary purpose of this study was to evaluate the effects of an individual’s movement profile on body mass composition and knee cartilage health; knee cartilage thickness and quality. The secondary purpose of this study was to determine if there is an association between lean body mass and measures of knee cartilagehealth. Design: Cross-sectional.
Methods: Movement profile was determined using the Landing Error Scoring System (LESS). Upon completion of the screening, trained LESS raters scored each jump-landing trial to assign the potential study participant into one of two categories: excellent or poor linked to high and low lower extremity injury risk movement profiles. The participant’s height and weight are measured and recorded to later be used in DXA scan for lean body mass analyses. Knee cartilage thickness was determined prior to exercise using an ultrasound of the knee on the subject’s dominant leg completed during knee flexion centered on the intercondylar notch at 145º. Independent samples t-Tests were used to evaluate the effects of movement profile on between movement profile and knee cartilage thickness, and movement profile, total body, and lower extremity lean mass. Pearson-product moment correlations were calculated between lean body mass and knee cartilage health measures.
association between movement profile and knee cartilage thickness. Conclusion: Movement profile influences lean body mass, but alone does not influence cartilage thickness and health measures. There is also a moderate association between lean body mass and measures of
cartilage health, including thickness and fluid content levels. Lean mass composition and
movement profile have the ability to be altered with training, suggesting that if a person’s biomechanics are improved, their injury risk could be decreased. This could assist in the preservation of cartilage, thus knee joint, health as seen in association between lean body mass and cartilage health measures.
CHAPTER ONE: INTRODUCTION
Physical activity, as understood to mean the movement of the body utilizing energy as provided by the body, has shown to have numerous positive impacts on health, such as a decreased disease risk and improved mental health.27 It is clear that engaging in these activities as recommended by experts has a multitude of beneficial health impacts on one’s lifestyle. Though physical activity is beneficial to health, it is important that the potential for harm be considered in making recommendations for activity in athletes.28, 31
Because of the substantial influence of physical activity on health, it is critical to study and implement methods of decreasing injury risk potential. In particular, decreased injury risk in the knee joint is important so that safe and stable movements are able to be maintained in both daily life as well as physical activity. By comprising the major weight-bearing and functional joint in the lower extremity, the knee is vital in how it absorbs and manages stresses placed on the lower extremity during the completion of day-to-day tasks, as well as success in exercise and sports.32
Movement at this joint is possible because of the structural make-up of the knee and the forces that these structures create to maintain the joint in proper position.33 These include the bones of the lower extremity, the femur, the tibia, and the fibula, and various tendons and ligaments, such as the ACL and MCL.33 Because of the anatomical set-up of these structures, there is an increased risk when connective tissue is strained or ruptured, as this creates instability in the joint.8, 33 Instability in a joint of this size and significance in daily function can be
movement, as well as by altering lean body mass so that fat mass is decreased and fat free mass is increased. These adjustments are ideal for improvements in health and ease of activity.17, 18, 23, 25
In this study, biomechanical factors will be discussed as movement profile.Movement profile impacts the manner in which stress and pressure is placed on and ultimately absorbed by the knee joint. In activities of daily living, or ADLs, having altered gait mechanics can lead to chronic knee pain and the eventual development of osteoarthritis, a degenerative disease impacting joints.5, 25 In sufferers of this disease, daily life functions are compromised as a result of the pain and difficulty of moving around to complete even menial tasks. If movement profile is shown to be a contributor to the rate of disease progression, but also has the potential to be altered, recommendations may be made to slow the progression of this disease as well as manage its side effects for sufferers.
Lean body mass is an additional factor that influences joint stability and health, that can be altered with physical activity, exercise, and diet changes.Lean mass may have the potential to decrease injury risk in athletes during physical activity as a result of the muscle’s ability to absorb energy created during movement.17, 18 Specifically, fat-free mass has shown to have a protective effect on the joints that it surrounds, contrast to the effects of fat mass.14, 16, 17 Also included in the category of lean mass, cartilage provides stability at the knee joint, while other forms of fat-free mass protect and aid in the maintenance of this tissue.17 Fortunately, lean body mass can be altered through training mechanisms. This will prove to be beneficial if there is an association between lower extremity lean mass and knee cartilage health.
mass, the LESS scoring system to evaluate movement profile, as well as ultrasound technology to analyze knee cartilage area and thickness. If associations exist, guidelines and
recommendations may be formed regarding the alteration of lean body mass and movement profile in relation to knee injury risk.
PURPOSE
This study will examine the knee joint and the ways in which daily tasks and physical activity influence the health and functionality of the joint. More specifically, of primary interest is the cartilage of this joint and the ways in which anatomical factors and biomechanics of the lower extremity influence its function.
RESEARCH QUESTIONS
1. Is there an effect of movement profile on knee cartilage thickness? 2. Is there an effect of movement profile on lower extremity lean mass?
3. Is there an association between lower extremity lean mass and knee cartilage thickness?
HYPOTHESES
1. Excellent movers will have thicker knee cartilage compared to poor movers.
2. There will be greater lower extremity lean mass (kg) in subjects classified as excellent movers versus poor movers.
3. Individuals with greater lower extremity lean mass (kg) will have greater knee cartilage thickness (cm).
For the purpose of this study, subjects consisted solely of active females selected based on convenience. Because of this, data may face population restrictions and may not be
conclusively applied to a larger population consisting also of females or the population in general.
It is unclear if altering existing lower body exercise routines may also alter these stresses. The methodology in studying this population is relatively novel in the exercise and sport science field, providing follow-up studies that may be completed to verify and expand the data and conclusions found here. Further studies may be beneficial in examining populations such as sedentary women, recreationally active women, women of different age groups, and even men to these varying degrees as well.
STUDY DELIMITATIONS
Injury rehabilitation is common practice in active populations in the United States. This study will only examine the physiological changes to knee cartilage without concern to other biomarkers that are expressed during high intensity exercise. For the sake of time and efficacy of data collection and analysis, the most appropriate focus of analysis included pre-exercise knee cartilage thickness.
Because of the nature of the subjects—recreationally active women of college age in the United States—the data and conclusions gathered could be applicable to recreationally active women of other universities as well. If it can be determined that altering lower extremity muscle mass has the potential to influence stresses placed on knee cartilage as a result of movement profile, the ability of therapists and coaches to prescribe individualized exercise routines to aid in this prevention of disease is possible.
VARIABLES Dependent
1. Knee cartilage thickness 2. Movement profile
1. Excellent movers 2. Poor movers Independent:
1. Movement quality 1. Excellent movers 2. Poor movers
2. Lean body mass (lower extremity lean mass (kg))
Examining subject biomechanics and classifying them into one of two groups, excellent mover or poor mover, will determine movement quality. Trained assistants complete this classification using a standardized form.
three levels: fat mass, fat free mass, and bone mineral density. For this study, the compositions of interest are the fat mass and fat free mass, with the area of focus being the lower extremity.
Cartilage thickness will be assessed using ultrasound technology and Image J, a computer software system that allows for quantitative values to be derived from these images. These images will be evaluated from pre-testing TRV images at varying knee angles.
A correlation between these variables may help the clinician correct movement and thus
reverse progression towards degenerative osteoarthritis. All variables above, though being examined in different spheres, are of upmost importance when discussing this disease and further injury risk prevention in regards to the knee joint.
OPERATIONAL DEFINITIONS Knee cartilage thickness
1. Ultrasound imaging
1. Lines for thickness measurements are drawn downwards at 5 locations 1. “Outer” medial femoral condyle (OMFC)
2. Medial femoral condyle (MFC) 3. Intercondylar notch (ICN) 4. Lateral femoral condyle (LFC)
5. “Outer” lateral femoral condyle (OLFC) 2. Assessed by mean area (cm2)
1. Total cartilage area assessed based on the measurement obtained using polygon tool to outline cartilage in the image.
1. Used for total body as well as compartmental analyses of lean body mass (kg)
1. Ability to distinguish between fat mass, lean mass, and bone mineral density42 Movement Profile
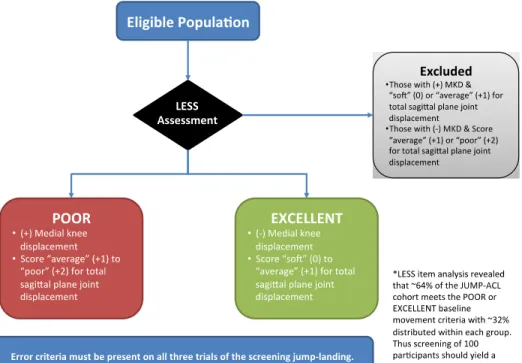
2. Excellent movers
1. Score as “soft” or “average” for total sagittal plane joint displacement and lack medial knee displacement.
2. Receive a score of 0 or 1 using the LESS screening system. 3. Poor movers
1. Have stiff landings with medial knee displacement.
2. Receive a score of 1 or 2 using the LESS screening system. 4. Excluded from participation
1. Those who have medial knee displacement and score as “soft” for total sagittal plane joint displacement.
2. Those who lack medial knee displacement or score as “poor” for total sagittal plane joint displacement.
Lower extremity lean mass, total body mass, total lean body mass 1. Measured in kilograms
CHAPTER TWO: REVIEW OF LITERATURE
Physical Activity and Lifetime Health Promotion
It is widely known and accepted that physical activity is crucial in overall health and quality of life. Physical activity has shown to have a positive impact on mental health in addition to overall health benefits. These benefits include decreased risk of potentially fatal disease, specifically metabolic diseases, cardiovascular disease, protection against non-communicable diseases, and more. 9, 10
While physical activity provides immeasurable benefits, it is important to remain aware of the potential injury risk to musculoskeletal health. Of the injuries inflicted on the body during activity, more than 80% of injuries occur in sport situations, with a large number of occurring at the knee.27, 30 The knee and lower extremity face this risk in activities involving running,
jumping, and changing direction, as an additional, and sometimes abnormal, strain is placed on the joint during these activities. Engaging in exercise can put an individual at risk for soft tissue damage, muscle sprains, strains, or tears, extremity dislocations or fractures, and more. For this 29 reason, maintaining the health of the entire knee joint in sport and daily life is crucial to general health and well being of the human body.
Articular Cartilage of the Knee
Cartilage has many roles throughout the body. Specifically, articular cartilage is responsible for covering the articular surfaces of bones, preventing friction between bones, absorbing loads placed on a joint, and providing a weight-bearing surface to bones it covers. 11
damage.20 Literature has shown that at times, joints in the knee and hip in particular are
responding to loads many times an individual’s body weight.20 In general, this chronic loading of the cartilage of the knee joint causes gradual wear and tear, leading to diseases such as
osteoarthritis. While loading the joint can increase cartilage thickness, at a certain point a threshold is met and cartilage thickness may begin to decrease.21 Once cartilage loss begins, it is difficult to stop or reverse as physiological processes in the body continue the process.21
Diseases such as osteoarthritis result as the ability of cartilage to handle stresses decreases. Osteoarthritis has many contributing factors, such as cell death, inflammation, cell matrix degradation, and incorrect cell activation and differentiation in terms of the remaining cartilage cells.13 Articular cartilage of the knee has the highest risk of damage, though it is not the sole reason for the occurrence of osteoarthritis.13 The effects of this tissue go beyond the
covering of bones; as cartilage degrades, it causes a cascade of issues that contribute to the development of osteoarthritis.13 Because articular cartilage is ‘post mitotic tissue’, the cell turnover rate is low, and new cartilage cells are not constantly reproduced to replace dead or non-functioning cells.13 When the health of this cartilage at the knee joint is at risk, the risk of osteoarthritis is increased.12
numerous as it is minimally invasive, reliable, and cost-effective; the disadvantages are limited and mostly based on technician skill.22 It is for these reasons that ultrasound technology is a viable and efficient method to analyze knee cartilage thickness.
Impact of Movement Profile on Joint
To prevent injury and eventual degenerative joint disease, it is crucial to understand the influence of a person’s movement profile on the health of their joint.25 Much of injury prevention can be centralized around biomechanical factors, or movement profile, and the means of
improving these so that stabilization and health of the joint is of priority. 32Of particular importance in the means of lower extremity musculature activation and its influence on
movement profile is how forces placed on the knee joint are absorbed and dispersed in ways that protect it from injury. Injury occurs when these forces overcome the ability of the joint’s
capacity to absorb them efficiently.
flexion.38 The significance in this data is this: subjects with ACL injuries were more likely to be classified as pre-osteoarthritic, meaning that injury to the knee joint has a large role in causing degenerative disease.39 Knowing that injury to structures within the knee joint can lead to osteoarthritis highlights the necessity of minimizing these injury risks which appear to have biomechanical causes.
With the indication that poor movement and biomechanics, which are influenced by lean body mass and fat free mass, lead to an increased risk of injury and ultimately degenerative disease, the importance of physical activity as a part of ones’ lifestyle becomes very clear. Sedentary populations, specifically populations of heavier weight and higher body mass indices (BMI), have less of the muscular control needed to maintain healthy movement profiles across the knee joint. Aside from the lack of fat free mass to aid in load absorption at the knee joint, these populations are also placing additional stress on their joints because of their increased size and weight.24 Again, this contributes to the onset of degenerative disease24, 25
Lean Body Mass and the Knee Joint
Lean body mass generally refers to fat mass and fat free mass in the body. Lean body mass is a good indicator of overall health and disease risk. In particular, increased volumes of fat free mass (FFM) are an indicator of better overall health.
Body composition, though having many influences, can be altered by increased physical activity and dietary changes towards a healthier lifestyle. Specifically, by prescribing physical activity, the amount of fat free mass and fat mass can be increased and decreased, respectively. Classified as fat free mass, lean muscle mass is crucial for neuromuscular and skeletal function, as well as energy absorption during landing mechanics.17, 18,19 Studies have suggested that fat free mass acts in a protective manner surrounding the joint, while fat mass does not; in fact, evidence provided by Montgomery et al., suggests fat free mass in the lower extremity significantly predicts the ability of the knee to absorb energy. If indeed there is an association between knee 17 cartilage thickness and lower extremity musculature, plans of action can be created to ensure total body health as well as that of the knee joint.
Exercises to increase fat free mass, specifically muscle mass, must be specific to the needs of the person and maintained over time. In terms of the knee joint, it is necessary that specific training to alter lean body mass of the lower extremity is prescribed to and carried out by a person if overall knee joint health is a priority for that person. For example, in studies
examining performance benefits of specific training for jumping exercises, movement specific training such as plyometric training led to specific adaptations to the musculature and
functionality of the muscle groups that were targeted.19 As also shown by Sato et al., in examining the influence of core strength training on ground reaction forces and lower leg
the importance of specificity in training. By altering the composition of the lower extremity with specific increases of fat free mass to the musculature surrounding the knee joint, greater health of the knee can be established and maintained.
Models for body composition that allow for fat mass and fat free mass of a subject to be measured would be beneficial to this study to evaluate the relationship between fat mass, fat free mass, and knee cartilage thickness. In this study, the method of measuring each subject was the Dual-energy X-ray Absorptiometry (DXA) machine. DXA machines provide an analysis of bone mineral density, fat mass, and fat-free mass. This is helpful in drawing conclusions regarding lean body mass and knee cartilage thickness. The DXA has the ability to measure total body as well as compartmental and regional lean body mass, such as the head, thorax, pelvis, and different extremities.15 In this study, we will take advantage of the DXA capacity to analyze lower extremity lean body mass, as lower extremity musculature is being studied in relation to knee cartilage. Collecting data for lean mass in the area of interest allows for the determination of whether or not associations exist between lower extremity muscle mass and knee cartilage thickness.
Knee Joint Health
Injuries to the musculoskeletal system are a risk when participating in exercise, with increasing prevalence occurring to the knee joint. For this reason, it is crucial to not only understand what maintains the health of this joint, but it’s significance as well.
from the lateral or medial aspects of the lower extremity, and more.32 The potential for overuse injuries is also prevalent in those who have chronic biomechanical issues with no physical therapy or training to alter these movements.32
The knee joint consists of the meeting of the bones of the lower and upper legs, cartilage, ligaments, and tendons. All aspects of this joint contribute to the carriage of body weight by the lower body. The stability and health of this joint has an influence on how and the ease with which these actions are completed. A torn muscle, ligament or tendon prevents movement based on where these structures insert or originate. For example, damaging the quadriceps muscle may cause difficulty in leg extension, which is an aspect of many daily tasks. If a ligament or tendon is damaged, the joint is no longer structurally sound, as the stabilizing anatomy is unable to function correctly, putting a person at risk of further injury with any movement. If cartilage is degenerated or thin, the bones of the lower extremity are less protected and at risk of rubbing together and not adequately absorbing loads, causing tremendous pain to the person. In the case 3 of improper movements, cases of tendonitis or bursitis in addition to the injury risks discussed previously may appear.6 Cartilage breakdown also occurs as a response to protective factors of the knee to micro- or macro-trauma, such as inflammation, mechanical stress, inadequate homeostatic responses and control of apoptosis and cellular stress. When this joint is healthy, 6 movement can be completed at a wide range with relative ease. When any structure of this joint experiences trauma, the entire body is susceptible to damage.
In examining the knee joint specifically, body composition that is not fat (muscle, tendons, and ligaments) is what provides this stabilization as discussed above. When these structures are stronger, it is logical that the joint that is stabilized is also stronger. On the other hand, fat mass has shown to have a degenerative effect on joints, specifically cartilage tissue. 17 Fat mass is unable to connect to anatomical landmarks to provide sound structures in the way that fat-free mass such as muscle, ligaments, and tendons are.
If there is a link between cartilage thickness, movement profile, and lower extremity mass composition, an individual’s movement profile and lower extremity mass composition offer intervention routes to potentially reduce knee joint cartilage stress and benefit long-term knee health in the physically active population.Correlation does not equal causation, however it is possible that preventative measures can be implemented to decrease risk of degenerative disease to this joint. Factors that influence knee cartilage thickness have the ability to be altered without surgical or extreme intervention. Exercises can easily be prescribed to at risk, as well as healthy, populations that alter the muscular composition of the lower extremity to assist in this reversal.
CHAPTER THREE: METHODOLOGY
Subjects
Forty physically active females aged 18-25 from The University of North Carolina at
Chapel Hill (UNC-CH) were recruited for this study. All participants participate or have previously participated in a field or court sport, such as soccer, basketball, softball, or lacrosse. Eligible participants must perform moderate to high intensity exercise for at least thirty minutes at a minimum of three times per week; must not be pregnant, and; must meet movement profile inclusion criteria (Figure 1.). Participants who have undergone lower extremity surgery in the past year, have lower extremity joint surgery, have prior ACL or meniscal injury, have a lower extremity injury that restricted sport participation for more than three consecutive days, history of neuroendocrine, neurological, or metabolic disease or conditions, history of dysmenorrhea or amenorrhea within the past six months, or conditions that would prevent high-intensity exercise were excluded from this study.
Movement Profile Screening
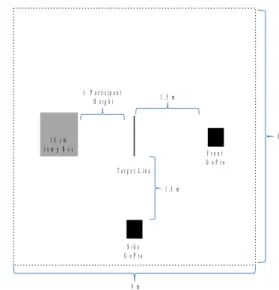
Prior to enrollment, demographically eligible participants reported to The Sports Medicine Research Laboratory to determine if they met movement profile inclusion criteria using the Landing Error Scoring System (LESS). 2-dimensinoal video was recorded of the subjects completing five trials of a jump-landing task (Figure 2.). The subject completed the jump-landing from a 30 cm box set at a distance 50% of the subject’s height from a landing target line.
3 0 c m J u m p B o x
T a r g e t L i n e
S i d e G o P r o
F r o n t G o P r o
8 m
8 m 1 . 5 m
1 . 5 m ½ P a r t i c i p a n t
H e i g h t
Figure 2. – Jump-Landing Assessment
movement profile inclusion criteria, the participant was scheduled to report to the Sports Medicine Research Laboratory for a testing session within two weeks of their LESS screening (Appendix A).
Study Protocol
Informed Consent & Ethical Considerations
Enrolled participants read and signed an Informed Consent Form approved by the Institutional Review Board of the University of North Carolina at Chapel Hill to confirm that they meet the selection criteria and were cognizant of the requirements and potential risks of participating in this research study.
Protocol
Following informed consent procedures, the participant’s height and weight were measured using a stadiometer and digital scale. After height and weight were recorded the participant provided a mid-stream 40 mL urine sample for determination of urine specific gravity to assess hydration and a dipstick urine test to rule out pregnancy.
To assess knee cartilage thickness prior to exercise, an ultrasound of the knee on the subject’s dominant leg was completed. This was done using a GE 12L 4 cm linear transducer. It was B-mode with a transducer frequency of 8.0 MHz. The gain was 70 and the depth of field is
The subject was then placed in the DXA machine to evaluate bone mineral density, fat mass, and fat free mass. For this, the subject removed jewelry prior to laying supine and centered on the table for further manipulation for the scan. The hip was then internally rotated so that the femoral head and neck were exposed. It has shown that binding the feet helps maintain this position. The subject remained motionless on the table in the anatomical position they were placed in for the duration of the DXA scan.
Data Reduction
ImageJ software was used to analyze knee cartilage (Images 1-2). The image was opened in this program and cartilage was then traced and measured to assess area, followed by the addition of lines to assess thickness at 5 locations (OMFC, MFC, ICN, LFC, and OLFC). The measured values were then added to a spreadsheet for analysis.
Images 1-2. The process of analyzing knee cartilage area and thickness using Image J software.
Statistical Analysis
Data from this study was analyzed utilizing a test of correlation as well as an independent samples t-test. These tests considered correlation using the lower extremity mass as a predicting variable for the criterion variable of femoral articular cartilage thickness to determine if the two were related.35 These tests also compared cartilage thickness between excellent and poor movers. To reject the null and accept the alternative hypothesis in question, an alpha level of less than
0.05 was needed.
CHAPTER FOUR: RESULTS
DEMOGRAPHICS
The average age of all subjects was 20.53 years old with a standard deviation of 1.57 years. The average age of excellent movers was 20.75 years old with a standard deviation of 1.83 years. The average age of poor movers was 20.30 years old with a standard deviation of 1.26 years. The average height of all subjects was 168.17 cm with a standard deviation of 6.96 cm. The average height of excellent movers was 167.32 cm with a standard deviation of 6.77 cm. The average height of poor movers was 169.02 cm with a standard deviation of 7.21 cm. The average mass of all subjects was 63.17 kg with a standard deviation of 7.32 kg. The average mass of excellent movers was 65.21 kg with a standard deviation of 7.83 kg. The average mass of poor movers was 61.13 kg with a standard deviation of 6.33 kg. There were no significant differences in terms of age, height, and mass between groups (P>.05).
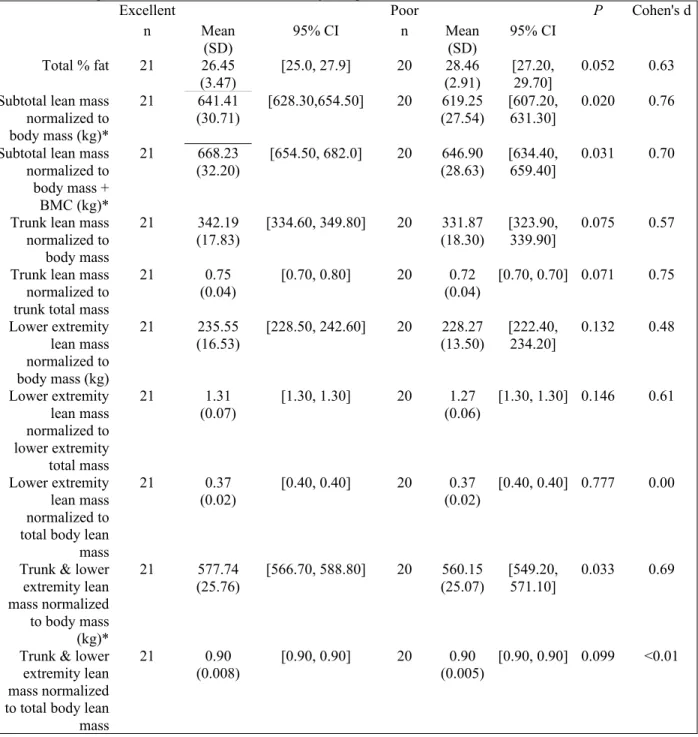
LEAN BODY MASS
t-tests were run for measures of lean body mass for each group of interest. There was a
P=0.020, Cohen’s d=0.76). The descriptive statistics of non-significant variables can be found in Table 1.
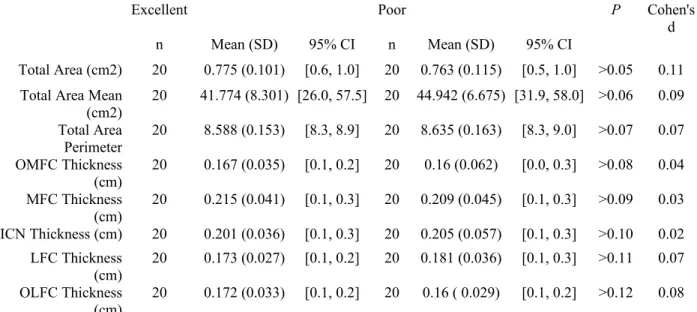
CARTILAGE
There were no significant differences in terms of cartilage thickness, area, and perimeter between groups. These descriptive statistics can be found in Table 2.
LEAN BODY MASS AND CARTILAGE
Echogenicity was shown to have a significant negative correlation between subtotal lean mass (r=-0.319, p<0.05) and subtotal lean mass + bone mineral content (r=-0.325, p<0.05).
There was a significant negative correlation between the outside medial femoral condyle
Table 1. - Descriptive statistics for DXA scans of body composition.
Excellent Poor P Cohen's d
n Mean
(SD) 95% CI n Mean(SD) 95% CI
Total % fat 21 26.45
(3.47)
[25.0, 27.9] 20 28.46
(2.91)
[27.20, 29.70]
0.052 0.63
Subtotal lean mass normalized to body mass (kg)*
21 641.41
(30.71) [628.30,654.50] 20 (27.54)619.25 [607.20,631.30] 0.020 0.76
Subtotal lean mass normalized to body mass + BMC (kg)*
21 668.23
(32.20) [654.50, 682.0] 20 (28.63)646.90 [634.40,659.40] 0.031 0.70
Trunk lean mass normalized to body mass
21 342.19
(17.83)
[334.60, 349.80] 20 331.87
(18.30)
[323.90, 339.90]
0.075 0.57
Trunk lean mass normalized to trunk total mass
21 0.75
(0.04)
[0.70, 0.80] 20 0.72
(0.04)
[0.70, 0.70] 0.071 0.75
Lower extremity lean mass normalized to body mass (kg)
21 235.55
(16.53)
[228.50, 242.60] 20 228.27
(13.50) [222.40, 234.20] 0.132 0.48 Lower extremity lean mass normalized to lower extremity total mass 21 1.31 (0.07)
[1.30, 1.30] 20 1.27
(0.06)
[1.30, 1.30] 0.146 0.61
Lower extremity lean mass normalized to total body lean mass
21 0.37
(0.02) [0.40, 0.40] 20 (0.02)0.37 [0.40, 0.40] 0.777 0.00
Trunk & lower extremity lean mass normalized to body mass (kg)*
21 577.74
(25.76) [566.70, 588.80] 20 (25.07)560.15 [549.20,571.10] 0.033 0.69
Trunk & lower extremity lean mass normalized to total body lean mass
21 0.90
(0.008)
[0.90, 0.90] 20 0.90
(0.005)
[0.90, 0.90] 0.099 <0.01
Table 2. - Descriptive statistics for knee cartilage composition (cm2) between excellent and poor movers.
Excellent Poor P Cohen's
d
n Mean (SD) 95% CI n Mean (SD) 95% CI
Total Area (cm2) 20 0.775 (0.101) [0.6, 1.0] 20 0.763 (0.115) [0.5, 1.0] >0.05 0.11
Total Area Mean
(cm2) 20 41.774 (8.301) [26.0, 57.5] 20 44.942 (6.675) [31.9, 58.0] >0.06 0.09
Total Area
Perimeter 20 8.588 (0.153) [8.3, 8.9] 20 8.635 (0.163) [8.3, 9.0] >0.07 0.07
OMFC Thickness (cm)
20 0.167 (0.035) [0.1, 0.2] 20 0.16 (0.062) [0.0, 0.3] >0.08 0.04
MFC Thickness
(cm) 20 0.215 (0.041) [0.1, 0.3] 20 0.209 (0.045) [0.1, 0.3] >0.09 0.03
ICN Thickness (cm) 20 0.201 (0.036) [0.1, 0.3] 20 0.205 (0.057) [0.1, 0.3] >0.10 0.02
LFC Thickness
(cm) 20 0.173 (0.027) [0.1, 0.2] 20 0.181 (0.036) [0.1, 0.3] >0.11 0.07
OLFC Thickness (cm)
20 0.172 (0.033) [0.1, 0.2] 20 0.16 ( 0.029) [0.1, 0.2] >0.12 0.08
Table 3. Pearson Product-Moment Correlation Coefficients Between Absolute Lean Mass Variables and Cartilage Measures
Cartilage Measure Subtotal Lean
Mass Subtotal LeanMass + Bone Mineral Content
r p r p
Area 0.065 0.690 0.067 0.680
Area Perimeter -0.163 0.316 -0.168 0.300
Area Echogenicity* -0.319 0.045 -0.325 0.041
Outside Medial Femoral Condyle* -0.391 0.013 -0.393 0.012
Medial Femoral Condyle** -0.410 0.009 -0.407 0.009
Intercondylar Notch** -0.440 0.004 -0.439 0.005
Lateral Femoral Condyle** -0.552 0.000 -0.550 0.000
Outside Lateral Femoral Condyle** -0.497 0.001 -0.500 0.001
*Correlation is significant at the p < 0.05 level, **Correlation is
CHAPTER FIVE: DISCUSSION
In physically active females, there is a link between movement profile and lean mass.
Specifically, individuals who possess excellent movement profiles have a greater amount of lean
mass per unit of body weight as compared to those with poor movement profiles, thus decreasing
their injury risk. However, movement profile does not appear to have an influence on cartilage
thickness or quality and water content. Further, there seems to be an inverse relationship between
lean muscle mass and cartilage thickness, as well as a positive relationship between movement
profile and cartilage water content at rest as measured by musculoskeletal ultrasound.
Magnetic Resonance Imaging (MRI) allows for accurate and reproducible image analyses
regarding all tissues of a joint, a quality that is extremely helpful when trying to determine if
osteoarthritis is present in a joint. Of interest in this study, knee cartilage distribution is a tissue
type readily observed from MRI imaging of the knee, accessible across gender and lean body
mass make-ups.1, 2 While the use of MRI would be great for use in this study, it was not practical.
The most clinically accepted and feasible imaging tool for this study was ultrasound.
Ultrasound as an imaging tool has been determined to be reliable, valid, accurate, and
effective to measure knee cartilage distribution and abnormalities.22, 40, 41 Data obtained from
ultrasound is both reproducible and has shown to have interobserver validity.40, 41 While this
imaging analysis cannot directly detect osteoarthritis as MRI can, this type of imaging can detect
cartilage thickness, as well as cartilage damage and inflammation that may be linked to
osteoarthritis symptom flares.22
In this study, ultrasound imaging did not show any knee cartilage thickness differences
between movement profile groups. However, ultrasound is still a sound method for measurement
Dual-energy x-ray absorptiometry (DXA) imaging proved to be a precise and accurate tool to
analyze lean body mass and bone mineral content, which coincides with previous literature
associated with the clinical implications of DXA scans.19 Using this imaging tool allows for
compartmentalized analyses of lean body mass, including lean mass, fat mass, and bone mineral
density.19 Because this study examined the lower extremity specifically, while also comparing
lean mass in the trunk, DXA provided the exact lean body mass data that was needed to
distinguish lean body mass between two groups: excellent movers and poor movers. The ability
to distinguish between different risk groups using DXA, where general lean body mass analyses
have only used this before, indicates that injury risk can potentially be observed by examining
anatomical factors in the body without having to conduct movement analyses.
Differences were not found between groups, but in considering the physiological components
of cartilage, this finding is not unexpected. Cartilage has protective properties that requires
chronic wear and tear to dissolve. This tissue is made up of a solid matrix and interstitial fluid
which is responsible for the initial load absorption.45 This fluid shifts as the load increases,
allowing for the solid matrix to absorb the load.45 This protective factor combined with the
understanding that there was no difference in cartilage thickness between movement profile
groups allows for the assumption to be made that cartilage is equally protective regardless of
injury risk.
how tissue adapts to stresses placed upon it may contribute to knee cartilage and joint health.44 Work by Koo, Andriacchi, and Scanlan support that,in addition to the SAID principle, Wolff’s Law suggests that tissue changes as a result of the forces placed on it.46 Studies examining the influence of stress placement in the knee joint has shown that in healthy subjects, knee cartilage adapts based on the loading that it undergoes in order to maintain homeostasis.47 These studies have also shown that cartilage is thickest where this loading is most substantial.48 Further, these variations are individualized.49, 50 Both of these factors have the ability to be altered with training,
suggesting that if a person’s biomechanics are improved, their injury risk could be decreased.
This can be seen in the between-group difference as excellent movers with lower injury risk had
greater muscle mass quantities.
Current injury prevention practices for women include plyometric and proprioceptive
training which have “promising results” in altering neuromuscular control.43 Specifically, these
studies examine how to prevent knee ligament tears. Knee joint health, which can be affected by
neuromuscular control, ligamentous tears and cartilage degradation, is crucial in the reducing the
risk of developing osteoarthritis.40, 43, 51 In terms of osteoarthritis progression and knee joint
health, these practices do contribute to overall health. However, an approach to protect knee
cartilage is also necessary. Cartilage’s contribution to osteoarthritis symptom progression and
flare-ups prompts this need.22
This study showed that movement profile influences muscle mass and that a correlation
exists between lean mass and cartilage thickness and quality. In fact, higher quantities of lean
mass are correlated negatively with cartilage thickness and quality. There were no differences
between groups in regards to knee thickness. However, the quality of cartilage between groups
knee joint by altering biomechanics and muscle mass to decrease injury risk and joint health
degradation. Observations have shown that lean mass has the potential to reduce injury risk as
seen in works by Singh and Singh, and promote healthy cartilage status per correlation analysis.19
These results have limitations. The sample size is an example of this, as data from only 40
subjects was measured. These results were also found based on physically active women
pre-exercise, introducing an additional limit to it’s universality and ability to assume generalizations.
Regarding the measures used to collect data, ultrasound and DXA each have respective
limitations. Ultrasound images and validity may be affected by the technician and potential
technician error. Images obtained from ultrasound technology are also of poor resolution, making
them difficult to analyze at times. DXA results are determined using the scan as well information
on the subject’s demographics. Based on the technician, this information could be incorrect
either by it’s input or when it was gathered.
Based on the significant values obtained from t-tests, a cause and effect may be
investigated between knee cartilage and lower extremity lean mass. From this, future studies
involving movement profile and knee cartilage thickness should manipulate both muscle mass
and movement profile to determine each variable’s specific influence on knee cartilage
thickness. These could be looked at individually as well as together, but a joint examination of
both variables at once may prove to be more significant if their individual manipulation
influences are summed. There may be trouble in manipulating only the movement profile, as this
can be altered in training which in itself can alter muscle mass.
Though the data analyzed based on ultrasound imaging did not prove to be significant,
the methods of cartilage thickness analysis, as well and lean body mass analysis, all proved to be
extremity lean mass, implications regarding movement profile and its influence on lower
extremity lean mass can be created and further interventions put into place regarding injury
prevention, an important factor in preventing osteoarthritis.40, 51
References Sample (N=40)
SESSION I Jump-Landing Assessment (LESS Movement Screening) Classified as excellent, poor, or excluded
SESSION II
Poor (n=25) Low sagittal plane knee angles,
presence of medial knee displacement or dynamic valgus
during landing mechanics.
Ultraasound - 120* and 145*
- 3 images recorded at each angle, Pre- and Post-testing
sessions
DXA
Analysis of body composition of the lower extremity
Excellent (n=25) High sagittal plane knee flexion angles with no presence of medial
knee collapse.
Ultrasound - 120* and 145*
- 3 images recorded at each angle, Pre- and Post-testing
sessions
DXA
1. Faber, S. C., Eckstein, F., Lukasz, S., Mühlbauer, R., Hohe, J., Englmeier, K.-H., & Reiser, M. (2001). Gender differences in knee joint cartilage thickness, volume and articular surface
areas: assessment with quantitative three-dimensional MR imaging. Skeletal
Radiology, 30(3), 144–150. doi:10.1007/s002560000320
2. Eckstein, F., & Wirth, W. (2011). Quantitative Cartilage Imaging in Knee
Osteoarthritis. Arthritis, 2011, 1–19. doi:10.1155/2011/475684
3. Hall, F. M., & Wyshak, G. (1980). Thickness of articular cartilage in the normal knee. The
Journal of Bone and Joint Surgery, Inc., 62(3), 408–413. doi:1535-1386
4. Kuroki, H., Nakagawa, Y., Mori, K., Kobayashi, M., Yasura, K., Okamoto, Y... Nakamura, T. (2008). Ultrasound properties of articular cartilage in the tibio-femoral joint in knee
osteoarthritis: Relation to clinical assessment (international cartilage repair society
grade). Arthritis Research and Therapy, 10(4), R78-R78. doi:10.1186/ar2452
5. Goldring, M. B. (2007). Osteoarthritis. Journal of cellular physiology, 213(3), 626–634.
doi:10.1002/jcp.21258
6. Sherwood, J., Bertrand, J., Eldridge, S., & Dell’Accio, F. (2014). Cellular and molecular
mechanisms of cartilage damage and repair. Drug Discovery Today, 19(8), 1172–1177.
doi:10.1016/j.drudis.2014.05.014
7. NIAMSD: National Institute of Arthritis and Musculoskeletal and Skin Diseases. (2014). Knee
Problems. Retrieved from http://www.niams.nih.gov/Health_Info/Knee_Problems/default.asp
8. Goldring, M. B., & Goldring, S. R. (2007). Osteoarthritis. Journal of Cellular
9. Ekblom-Bak, E., Ekblom, B., Vikström, M., de Faire, U., & Hellénius, M.-L. (2014). The
importance of non-exercise physical activity for cardiovascular health and longevity. British
Journal of Sports Medicine, 48(3), 233–238. doi:10.1136/bjsports-2012-092038
10. Deslandes, A., Moraes, H., Ferreira, C., Veiga, H., Silveira, H., Mouta, R., . . . Laks, J. (2009). Exercise and mental health: Many reasons to move. Neuropsychobiology, 59(4),
8. Retrieved from http://search.proquest.com/docview/233443086?accountid=14244
11. Ogden, J.A., Neame, P. J. (1992). Articular cartilage and osteoarthritis. Journal of
orthopaedic trauma, 6(3), 398–399. ISSN:0890-5339
12. Carter, D. R., Beaupré, G. S., Wong, M., Smith, R. L., Andriacchi, T. P., & Schurman, D. J.
(2004). The Mechanobiology of Articular Cartilage Development and Degeneration. Clinical
Orthopaedics and Related Research, 427S, S69–S77. ISSN:0890-5339
13. Lotz, M., & Carames, B. (2011). Autophagy and cartilage homeostasis mechanisms in joint
health, aging and OA. Nature Reviews Rheumatology,7(10), 579–587.
doi:10.1038/nrrheum.2011.109
14. Ding, C., Stannus, O., Cicuttini, F., Antony, B., & Jones, G. (2013). Body fat is associated
with increased and lean mass with decreased knee cartilage loss in older adults: A prospective
cohort study. International Journal of Obesity, 37(6), 822-7.
doi:http://dx.doi.org/10.1038/ijo.2012.136
15. Wagner, D. R., & Heyward, V. H. (1999). Techniques of body composition assessment: A
review of laboratory and field methods. Research Quarterly for Exercise and Sport, 70(2),
16. Mezhov, V., Ciccutini, F. M., Hanna, F. S., Brennan, S. L., Wang, Y. Y., Urquhart, D. M. and Wluka, A. E. (2014), Does obesity affect knee cartilage? A systematic review of magnetic resonance imaging data. Obesity Reviews, 15: 143–157. doi: 10.1111/obr.12110
17. Montgomery, M. M., Shultz, S. J., Schmitz, R. J., Wideman, L., & Henson, R. A. (2012).
Influence of Lean Body Mass and Strength on Landing Energetics. Official Journal of the
American College of Sports Medicine, 2376–2383.
18. Bell, D. R., Sanfilippo, J., Binkley, N., & Heiderscheit, B. C. (2014). Lean Mass Asymmetry
Influences Force and Power Asymmetry During Jumping in Collegiate Athletes. Journal of
Strength and Conditioning Research, 28(4), 1. doi:10.1519/JSC.0000000000000367
19. Singh, D., & Singh, S. (2012). Influence of Exercise Specificity on Depth Jump
Performance. Brazilian journal of biomotricity, 6(4), 261–268. ISSN:1981-6324
20. Desmarais, M., Aissaoui, R. (2008). Modeling of Knee Articular Cartilage Dissipation During Gait Analysis. Journal Of Mechanics In Medicine & Biology, 8(3), 377-394.
21. Mithoefer, K., Hambly, K., Logerstedt, D., Ricci, M., Silvers, H., & Della Villa, S. (2012).
Current concepts for rehabilitation and return to sport after knee articular cartilage repair in
the athlete. The journal of orthopaedic and sports physical therapy, 42(3), 254–273.
doi:10.2519/jospt.2012.3665
22. Pineda, C., Hernández-Díaz, C., Pena, A., & Villaseñor-Ovies, P. (2011). The place of ultrasonography in knee joint osteoarthritis: An update. International Journal of Clinical
Rheumatology, 6(6), 635-642. doi:http://dx.doi.org/10.2217/ijr.11.59
Extension Constraint Knee Bracing on Dynamic Balance, Gait Mechanics, and Joint
Alignment. PM&R, 6(4), 309–315. doi:10.1016/j.pmrj.2013.09.011
24. Harding, G. T., Hubley-Kozey, C. L., Dunbar, M. J., Stanish, W. D., & Astephen Wilson, J.
L. (2012). Body mass index affects knee joint mechanics during gait differently with and
without moderate knee osteoarthritis. Osteoarthritis and Cartilage, 20(11), 1234–1242.
doi:10.1016/j.joca.2012.08.004
25. Stief, F., Böhm, H., Dussa, C. U., Multerer, C., Schwirtz, A., Imhoff, A. B., & Döderlein, L. (2014). Effect of lower limb malalignment in the frontal plane on transverse plane mechanics
during gait in young individuals with varus knee alignment. The Knee, 21(3), 688-93.
doi:http://dx.doi.org/10.1016/j.knee.2014.03.004
26. Kumar, D., Souza, R. B., Subburaj, K., MacLeod, T. D., Singh, J., Calixto, N. E., Nardo, L.,
et al. (2015). Are There Sex Differences in Knee Cartilage Composition and Walking
Mechanics in Healthy and Osteoarthritis Populations? Clinical Orthopaedics and Related
Research, 473(8), 2548–2558. doi:10.1007/s11999-015-4212-2
27. Cordero, A., Masiá, M. D., & Galve, E. (2014). Physical Exercise and Health.Revista
Española de Cardiología (English Edition), 67(9), 748–753. doi:10.1016/j.rec.2014.04.005
28. Campbell, K., Foster-Schubert, K., Alfano, C., Duggan, C., Irwin, M., & McTiernan, A.
(2012). Injuries in Sedentary Individuals Enrolled in a 12-Month, Randomized, Controlled,
Exercise Trial. Journal Of Physical Activity & Health,9(2), 198-207.
29. Jones, C. S., Christensen, C., & Young, M. (2000). Weight training injury trends: a 20-year
survey. The Physician and Sportsmedicine, 28(7), 748–753. doi:10.3810/psm.2000.07.1086
30. Nicolini, Alexandre Pedro, Carvalho, Rogério Teixeira de, Matsuda, Marcelo Mitsuro,
of a specialized center. Acta Ortopédica Brasileira, 22(3),
131.https://dx.doi.org/10.1590/1413-78522014220300475
31. Pescatello, L. S., Arena, R., Riebe, D., & Thompson, P. D. (Eds.). (2013). Chapter 1:
Benefits and Risks Associated with Physical Activity. ACSM’s Guidelines for Exercise
Testing and Prescription (pp. 1–11). Baltimore, MD: Lippincott Williams & Wilkins.
32. Patricia, D. A. (2001). Common knee injuries in primary care. Nurse Practitioner, 26(10), 26-45; quiz 46-7. Retrieved from
http://search.proquest.com/docview/222349393?accountid=14244
33. Madeti, B. K., Chalamalasetti, S. R., & Sundara siva rao Bolla Pragada, S. K. (2015).
Biomechanics of knee joint — A review. Frontiers of Mechanical Engineering, 10(2), 176–
186.
34. Fukaya, T., Mutsuzaki, H., Ito, H., & Wadano, Y. (2014). Relationships Between Kinetic
Variables and Smoothness Of Knee Joint Movement in the Stance Phase. Journal Of
Mechanics In Medicine & Biology,14(5), -1. doi:10.1142/S0219519414500791
35. Stone, E. R. (2010). t Test, Independent Samples. In N. J. Salkind (Ed.),Encyclopedia of
research design. Sage Publications.
doi:http://dx.doi.org.libproxy.lib.unc.edu/10.4135/9781412961288.n475
36. Sato, K., & Mokha, M. (2009). Does Core Strength Training Influence Running Kinetics,
Lower-Extremity Stability, and 5000-m Performance in Runners? Journal of Strength and
Conditioning Research, 23(1), 133-40. Retrieved from
http://search.proquest.com/docview/213041059?accountid=14244
37. Blackburn, J. T., & Padua, D. A. (2009). Sagittal-Plane Trunk Position, Landing Forces, and
38. Alentorn-Geli, E., Mendiguchía, J., Samuelsson, K., Musahl, V., Karlsson, J., Cugat, R., &
Myer, G. D. (2013). Prevention of anterior cruciate ligament injuries in sports—Part I:
Systematic review of risk factors in male athletes. Knee Surgery, Sports Traumatology,
Arthroscopy, 22(1), 3–15.
39. Wu, H., Webber, C., Fuentes, C., Bensen, R., Beattie, K., Adachi, J., & ... Levy, D. (2007).
Prevalence of knee abnormalities in patients with osteoarthritis and anterior cruciate ligament
injury identified with peripheral magnetic resonance imaging: a pilot study. Canadian
Association Of Radiologists Journal, 58(3), 132-175
40. Naredo, E., Acebes, C., Garrido, J., Delgado-Baeza, E., áenz-Navarro, I., de Miguel, E.,
Filippucci, E., et al. (2009). Ultrasound validity in the measurement of knee cartilage
thickness. Annals of the Rheumatic Diseases, 68, 1322–1327. doi:10.1136/ard.2008.090738
41. Iagnocco, A., Perricone, C., Scirocco, C., Ceccarelli, F., Modesti, M., Gattamelata, A.,
Vavala, C., et al. (2012). The interobserver reliability of ultrasound in knee
osteoarthritis. Rheumatology, 51(11), 2013–2019. doi:10.1093/rheumatology/kes161
42. van der Ploeg, G. E., Withers, R. T., & Laforgia, J. (2003). Percent body fat via DEXA:
comparison with a four-compartment model. Journal of Applied Physiology, 94(2), 499–506.
43. Ajuied, A., Wong, F., Smith, C., Norris, M., Earnshaw, P., Back, D., & Davies, A. (2014).
Anterior Cruciate Ligament Injury and Radiologic Progression of Knee Osteoarthritis A
Systematic Review and Meta-analysis. The American Journal of Sports Medicine, 42(9),
2242–2252.
44. Accardi, M. A., Dini, D., & Cann, P. M. (2011). Experimental and numerical investigation of
lubrication mechanisms. Tribology International, 44(5), 565–578.
doi:10.1016/j.triboint.2010.09.009
45. Kent, M. (2007). SAID Principle. The Oxford Dictionary of Sports Science & Medicine (3
ed.). Oxford University Press. eISBN:9780191727788
46. Kent, M. (2007). Wolff’s law. The Oxford Dictionary of Sports Science & Medicine (3 ed.).
Oxford University Press. eISBN:9780191727788
47. Koo, S., Rylander, J. H., & Andriacchi, T. P. (2011). Knee Joint Kinematics during Walking
Influences the Spatial Cartilage Thickness Distribution in the Knee. Journal of Biomechanics,
1405–1409. doi:10.1016/j.jbiomech.2010.11.020
48. Koo, S., & Andriacchi, T. P. (2007). A comparison of the influence of global functional loads
vs. local contact anatomy on articular cartilage thickness at the knee. Journal of
Biomechanics, 40(13), 2961–2966.
49. Andriacchi, T. P., Koo, S., & Scanlan, S. F. (2009). Gait Mechanics Influence Healthy
Cartilage Morphology and Osteoarthritis of the Knee. The Journal of Bone and Joint Surgery,
Incorporated, 91-A, 95–101.
50. Andriacchi, T. P., & Dyrby, C. O. (2005). Interactions between kinematics and loading
during walking for the normal and ACL deficient knee. Journal of Biomechanics, 38, 93–298.
51. Roos, E. M. (2005). Joint injury causes knee osteoarthritis in young adults. Current Opinion