User Guide
Zend Platform V3.0
By Zend Technologies, Inc.
Zend Platform User Guide Disclaimer
The information in this document is subject to change without notice and does not represent a commitment on the part of Zend Technologies Ltd. No part of this manual may be reproduced or
transmitted in any form or by any means, electronic or mechanical, including photocopying, recording, or information storage and retrieval systems, for any purpose other than the purchaser’s personal use, without the written permission of Zend Technologies Ltd.
All trademarks mentioned in this document, belong to their respective owners. © 1999-2007 Zend Technologies Ltd. All rights reserved.
Zend Platform User Guide issued June 2007. DN: ZP-UG-190607-3.0-010
Zend Platform is an extremely diverse, runtime-environment management platform. As such, a greater understanding of the underlining concepts is required to benefit from the Zend Platform capabilities and features. This User Guide reflects these concepts by providing a workflow driven description of Zend Platform’s features.
Part One: Introduction to Zend Platform is an introduction describing the background and architectural design of Zend Platform along with who should read this guide and how to maximize the benefits of deploying Zend Platform in your environment.
Part Two: Administration and Configuration, describes the initial tasks that should be done in order to customize Zend Platform to any given environment.
Part Three: Performance Management Server describes the features and functionality included with the “Performance Management Server”. This part includes functional descriptions of the performance
management components, which include: Platform (Management Console), PHP Intelligence, Performance and Configuration.
Part Four: Enterprise Server describes the features and functionality included with the “Enterprise Server”. This part includes functional descriptions of Enterprise grade components, which include: Session
Clustering, Job Queues and SNMP Traps.
Part Five: Integration Server describes the features and functionality included with the “Integration Server”. This part includes functional descriptions of Integration components, which include: Zend Platform’s Java Bridge and advanced reporting facilitated by Actuate’s BIRT Reporting Tool.
Part Six: Reference Information, provides additional reference information. This part includes an API and Directives list, Tutorials and Appendixes.
Audience
Zend Platform is responsible for providing solutions to the challenges faced by different stakeholders in the organization; therefore, this guide is suited for Managers, System Administrators and Developers. Managers will learn how to utilize this solution to support PHP lifecycle management by streamlining the PHP application lifecycle across development and production.
This kind of development method is responsible for shortening release cycles by integrating the working environment.
Managers can benefit from knowing how to utilize Zend Platform with their testing staff to obtain a means for detecting and pinpointing run-time problems throughout the production lifecycle while having the safety of knowing that when run-time problems are located, testing staff will have a complete audit trail to help resolve the issue.
From a usability aspect, delivering a product on time is only part of the equation. Find out how to improve user experience and increase performance, up-time and customer satisfaction through using Zend
Platform.
From the PHP aspect, know why Zend Platform considerably improves PHP execution while maintaining and synchronizing PHP configurations.
From an organizational standpoint, find out how to leverage existing investments in Java applications as well as reducing costs on hardware.
System Administrators will be able to understand how to detect problems with PHP Intelligence to pinpoint run-time problems with detailed information. Learn how to control configuration by synchronizing
configuration of '.ini' files accurately across PHP servers and improve performance by getting more out of each PHP server (less servers doing the same job).
Developers can learn how to integrate with Zend Studio to improve quality by quickly identifying problems and reducing the testing cycle. They can also benefit from the PHP/Java Integration Bridge to reuse code by utilizing existing code.
Zend Platform requires that each installation of Zend Platform (Central and Node) meet the following hardware and software specifications:
Hardware Requirements
Minimum 350MB Hard Disk space for installation
4GB HD space required for a typical live system with 1000-2000 events
Recommended minimum CPU - Pentium 4, 3.2GHz
Recommended 1GB RAM for a Central Server with 3 Nodes
Network card Software RequirementsTo be sure you have the most current details regarding the Platform compatibility with platforms, PHP versions, and Zend's other products refer to the information available online at:
http://www.zend.com/store/products/zend-platform/system-requirements.php. The Zend team regularly updates this information.
Table of Contents
Part I: Introduction to Zend Platform ...13
About Zend Platform ...14
Navigation ... 14
Central Control Center ... 14
Standard and Enterprise Servers ... 15
Zend Platform Overview...16
Architecture... 18
Central Server... 19
Nodes ... 20
Central-Node Communication... 22
Platform Administration, a Single Point of Access... 23
Part II: Administration and Configuration...25
Cluster Management ...26
Server Management ... 27
Group Management ... 28
VHost Management ... 28
Restricting Access to Virtual Hosts ... 29
Change Server Option... 29
PHP Intelligence ...31
Configuring Event Triggers ... 31
Why Configure Event Triggers ... 33
Filtering Event Triggers ... 33
Defining Event Triggers ... 33
Choosing and Defining Event Triggers ... 34
Watched Functions File Event Types... 37
Slow Function Execution ... 37
Excess Memory Usage (Absolute and Relative) ... 38
Database Error ... 38
Slow Query Execution ... 39
Inconsistent Output Size... 40
Load Average ... 40
Custom Events ... 40
Define Event Actions... 41
Performance...45
Configuring Performance ... 45
Performance Tab ... 45
Settings ... 47
File View... 49
File Compression ... 57
Transparent Mode... 60
Testing the ZDS ... 62
Running a Test ... 63
Understanding Test Results... 63
Configuration Tab...65
Tunneling (Communication Settings) ... 65
Configuring Preferences for Tunneling ... 66
Configuring Zend Studio Tunneling Settings ... 67
On Demand Connection... 69
Studio Settings ... 70
PHP Configuration... 73
Configuring Settings for a Server (Node) ... 74
Clone Wizard ... 75
Users and Groups ...76
User Management ... 76
Adding and Editing Users... 77
Adding a User ... 77
Editing a User ... 78
Adding and Editing Groups ... 78
Add/Edit a Group... 78
Passwords ... 81
Password Structure... 81
Licenses ...82
License Management ... 82
About Zend Platform Licenses ... 82
Managing Licenses... 82
Part III: Performance Management Server ...85
The Problem Resolution Lifecycle...86
The Problem Resolution Lifecycle... 86
Implementing the Problem Resolution Lifecycle ... 87
Creating Events... 88
Configuring Events... 88
Disabling Events (Triggers) ... 88
List Entry of Watched Functions... 88
Finding Events that Interest You... 89
PHP Intelligence ...90
System Health ... 90
Aggregation Groups ... 91
Event List ... 92
Working with the Event List ... 92
Event Details ... 95
Understanding Event Details ... 95
General Information... 96
Event Occurrence Info... 97
Zend Studio Diagnostics ... 97
Event Context ... 98
Show Source Code... 99
Event Administration... 100
Controlling Information Displayed in an Event ... 100
Change Event Details ... 101
Database Maintenance ... 104
Graphs... 105
Graph Behavior ... 105
Generating Graphs... 106
Performance...107
Overview... 107
Performance Lifecycle ... 108
Implementing the Performance Lifecycle ... 110
Benchmark - Site Analysis ... 110
Testing... 112
Test URL... 112
Additional Variables ... 113
Analyze Site (Benchmark) ... 113
Event Trigger Settings and Analysis ... 115
Calibrating Event Triggers for Performance Optimization... 115
Investigating Performance Related Events ... 116
Performance Optimization Tools ... 118
When to Apply Optimization Tools... 119
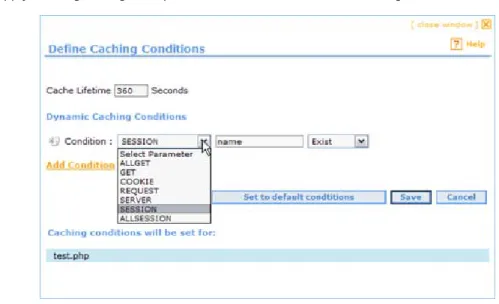
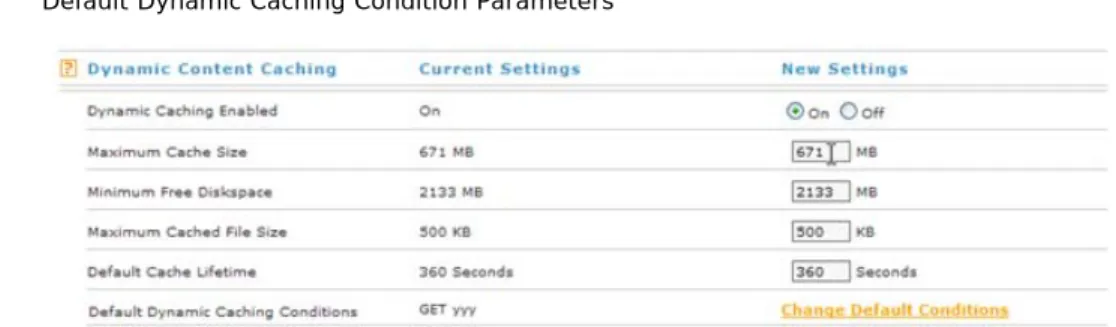
Content Caching (Dynamic) ... 119
Code Acceleration ... 121
Code Compression ... 122
Zend Optimizer ... 123
Tuning ... 124
Accelerator Performance Level Descriptions ... 124
Web Services...126
Introduction... 126
System Requirements for Web Services ... 126
General Tasks ... 127
Get/Set Actions... 128
Add/Remove Servers Actions ... 129
What is Session Clustering? ... 134
Session Clustering and HA (High Availability) ... 135
About HA... 136
Session Clustering Statistics ... 136
Session Clustering Settings... 137
General Settings... 138
Storage Settings... 138
Network Settings ... 139
The Importance of Session IDs... 140
Session Clustering Storage Models ... 141
Memory... 141
Write Through ... 141
Delayed Write ... 142
Defining Storage Models ... 142
Session Clustering Directives ... 143
Job Queues ...146
Introduction... 146
Job Queues... 147
The Job Queue API ... 147
Job Queue Tab (Job Management)... 149
Queues ... 149
Queue Details and Statistics... 149
Queue Operations... 150
Jobs... 151
Job Details... 154
Job Details Page Components... 155
Job Details Page Buttons: ... 155
Job Queue Settings... 156
View Queue Settings ... 157
Edit Queues ... 158
Job Queue Server ... 158
Creating Jobs... 158
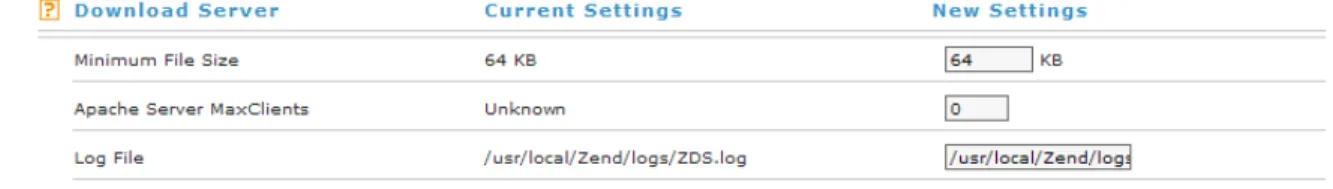
Zend Download Server (ZDS) ...159
Configuring the Zend Download Server (ZDS)... 159
Manual Mode... 159
Transparent Mode... 161
Testing the ZDS ... 162
Running a Test ... 163
Understanding Test Results... 164
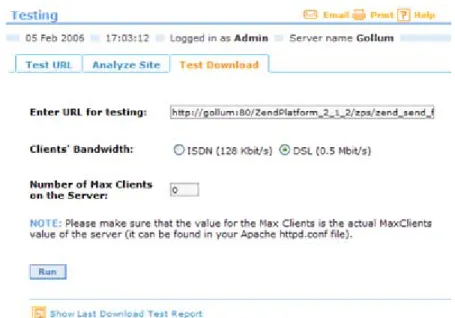
Test Download ... 165
Java Bridge ...168
About Zend’s Java Bridge Technology ... 169
Zend Platform Node ... 169
J2EE Application Server ... 170
Added Value ... 171
Operating and Configuring Zend Platform’s Java Bridge ... 171
Java Status Page... 171
Working with the Java Bridge User Interface ... 172
Configuring the Java Bridge ... 174
Common Tasks ... 175
Usage Scenarios ... 175
Activities ... 175
Usability Issues ... 179
Chain Functions Call... 179
Exceptions ... 179
Java Array/Hashtable Objects ... 181
Iterators... 182
BIRT Reports...183
About BIRT Reports ... 183
The BIRT Reports Tab ... 183
Setting-Up the BIRT Report Engine ... 184
Zend Platform BIRT Report Examples... 185
Part VI: Reference Information...191
Zend Platform APIs and Directives...191
Zend Platform APIs ... 191
APIs and Directives... 206
Zend Platform Directives ... 207
Zend Platform Built-In Services and Extensions...213
About... 213
Setup Tool... 214
Running the Setup Tool ... 214
Services ... 215
Java Bridge... 215
Session Clustering ... 216
Job Queues... 217
Cache Cleaner ... 218
Collector Center ... 219
Extensions... 220
zend_extension_manager.optimizer ... 220
zend_extension_manager.download_server (not applicable in Windows) ... 220
zend_extension_manager.platform ... 220
Zend Platform Action (Windows Only) ... 220
Tutorials...222
Integrating Existing and Legacy Applications... 222
Calling an EJB on Websphere from PHP ... 226
Partial and Preemptive Page Caching ... 228
Partial Page Caching APIs ... 228
Action Based Partial Page Caching ... 234
Appendixes ...236
Appendix A – Troubleshooting Zend Platform ... 236
Web Server... 236
The Communication Tunnel... 236
Appendix B – Configuration Check List ... 238
Appendix C – Performance Lifecycle Check List ... 239
Appendix D - Event Aggregation Mechanism ... 240
Appendix E – Zend Platform Support ... 243
Zend Platform Support ... 243
Zend Support Center... 243
Support Tool ... 243
Getting Support... 244
Appendix F – zend.ini Configuration Settings ... 245
Accelerator Directives ... 245
Monitor Directives... 246
Debugger Directives... 247
ZDS Directives ... 247
Appendix G - Network Port Requirements ... 248
Appendix H - About SNMP ... 250
Available Operations ... 250
SNMP Trap... 250
SNMP Message Structure ... 251
The MIB ... 251
The OID ... 252
MIB file structure... 252
Online MIB Validators... 253
Using NET-SNMP ... 253
Other Sources of Information ... 255
IN THIS CHAPTER... NAVIGATION
CENTRAL CONTROL CENTER STANDARD AND ENTERPRISE SERVERS OVERVIEW
ENVIRONMENTS ARCHITECTURE CENTRAL SERVER NODES
CENTRAL-NODE COMMUNICATION
PLATFORM ADMINISTRATION A SINGLE POINT OF ACCESS
Zend Platform is a complete runtime environment for managing and maintaining mission critical and enterprise PHP applications from a single, centralized location.
This environment consists of cluster management; performance management, monitoring, detection and recovery; and Java integration.
Zend Platform improves both the end user experience and IT productivity by combining cluster and performance management; automated monitoring and detection capabilities; and powerful Java Integration capabilities into one integrated environment.
Zend Platform provides the PHP-enabled enterprise with the ability to:
Manage every aspect of PHP from a single, Web-based interface
Quickly drill-down to critical issues to resolve and optimize
Create user defined thresholds and error values
Configure servers from a remote management station and to perform controls at a click of a button
Clone servers: one-to-one and one-to-many
Monitor performance improvement with Code Acceleration, Content Caching and File Compression
The Zend Download ServerAbout Zend Platform
Zend Platform is the only robust PHP production environment that ensures your applications run smoothly at all times.
Designed for IT personnel and businesses that require industrial-strength applications in highly reliable production environments, Zend Platform offers high performance and scalability to provide your customers with the best possible Web experience and response time.
Zend Platform uniquely guarantees application up time and reliability through enhanced PHP monitoring and immediate problem resolution that removes the troubleshooting guesswork out of the equation and replaces it with peace-of-mind.
You spent time and money developing your state-of-the-art PHP application, now it is time to ensure its up and running.
Navigation
Zend Platform is a browser-based application. The general layout of functionality is in a tabbed view where each tab represents a unique functionality.
Platform - management functionality
PHP Intelligence- Monitoring and event generation capabilities Performance - Performance enhancement tools
Configuration - Integration settings and PHP configurations Session Clustering - Session Clustering statistics
Job Queues - Streamline offline processing
Integration - Incorporate a Java environment to enrich your applications
The tab colors indicate the server type that is determined by the license type you have. The pale blue tabs belong to the Performance Management Server and the darker blue tabs belong to the Enterprise and Integration servers.
Central Control Center
Zend Platform handles clusters and standalone servers. As such, users can navigate freely between the central server and nodes.
Users stay on the central server until they select a tab that prompts to select a server; as soon as a server is selected, subsequent actions and settings will be applied to the selected server only.
A status bar showing the date, time and login name will also display the name of the server on which the user is currently working.
Standard and Enterprise Servers
Zend Platform is distributed as either a Performance Management Server or an Enterprise Server. Choosing the appropriate server depends on your organization's requirements.
The following table lists the different servers and their respective functionality: Feature Performance
Management
Enterprise Comments
Platform This includes the Dashboard, Server Status indicator, User and license Management. PHP Intelligence This includes the System Health overview,
Event management and the Graph generator. Performance This includes performance management
features: Code Acceleration, Dynamic Content Caching, File Compression, Updating Virtual Hosts and testing URLs.
Configuration This includes the advanced configuration features for configuring your PHP directly from Platform Administration and enabling the connectivity with Zend Studio to provide a complete development lifecycle.
Session Clustering Enterprise Session management for cluster based environments.
Job Queues Improve response time during interactive web sessions and utilizing unused resources. Integration This includes Java Bridge connectivity and
integration with business intelligence reporting using Actuate's BIRT reporting system.
Zend Platform Overview
Zend Platform is a central management solution and run-time environment for:
Configuration Management - Platform’s architecture provides full control of the PHP application platform, including performance management settings, event thresholds, etc. allowingadministrators to set up groups of multiple identical servers via:
•
Remote server configuration.•
Clone configurations or parts of configurations from one server to another or from one server to an entire group of servers.
Performance Management * - Platform is equipped with three management modules for tracking and improving speed and responsiveness of Web applications. These include Code Acceleration, Dynamic Content Caching and File Compression.
PHP Intelligence - Platform features new technology that detects and recovers crashes, whether they occur in PHP itself, the database software, or your own application. The integrated suite of monitoring, detection and recovery features allows users to drill down to critical issues and optimizations quickly and easily.
Session Clustering * – Zend Platform is equipped with a comprehensive solution for synchronizing session data across a cluster. Protect your applications from session corruption and erratic application behavior while providing an additional performance boost (up to x10). Immediately implement this solution to existing PHP code and attain linear scalability. Fully integrated with load balancers the Session Clustering module is a mechanism to ensure session data quality and integrity.
Actuate Reports - Advanced reporting capabilities: have been integrated into Zend Platform, to provide enterprise users with expandable reporting functionality. Actuate's reporting application is the chosen application, together with Zend Platform's Java Bridge it can extract reports from Java libraries and generate reports on any information. This solution is essentially a PHP API to the Actuate BIRT 2.0 run time environment that supports both PHP 4 and PHP 5.
Job Queues - Zend Platform’s Job-Queue provides PHP production environments with a standard approach to streamline offline processing. A Job-Queue server is services the Job Queue that provides the ability to reroute and delay the execution of processes that are not essential during user interaction with the Web Server.
PHP/Java Integration - The Platform PHP/Java Bridge module provides PHP centric companies with a well-rounded environment making sure that the organization benefits from the “best of both worlds”. Be it, existing investments in J2EE application servers that require this solution, or to provide a means for organizations - if they choose, to bridge language limitations by use of Java applications. The Java Bridge is not limited to interactions strictly with J2EE and legacy systems, the Platform PHP/Java Bridge also provides the ability to interact with plain Java objects.Environments
A typical environment for running any Web application consists of three basic components: Web servers for running the Web application, a load-balancer to handle traffic and a firewall to protect form
unauthorized entry into the hosting network.
Zend Platform, once introduced to this kind of an environment becomes a control environment for web server activity.
In an environment where a single web server manages activity, Zend Platform resides on the web server to provide system health and analysis information.
Moreover, environments that include several web servers, as clusters servicing a single Web application or a collection of clusters servicing different Web applications, Zend Platform serves as a single control center for system health information, cluster management and runtime process optimization.
The Zend Platform system diagram below, demonstrates where Zend Platform components typically reside in the PHP- enabled enterprise.
Figure 1: Zend Platform System Diagram The system diagram illustrates the following points:
Zend Platform’s Standalone Cluster Server is installed on a Web server.
The System Administrator controls all Platform Central functions. Providing the ability to work with Platform from a single workstation using a standard Web Browser.
Nodes host resident PHP-based services that fill requests from the Web.Note:
Platform Server and the Platform nodes are separate entities; therefore, it is important to configure Firewall and security devices to allow communication between the nodes and the Platform Server. Identify which ports are in use and if necessary, open these ports on your Firewall.
To read more about working with Firewalls and Nat go to “Configuring Zend Studio Tunneling settings”.
Architecture
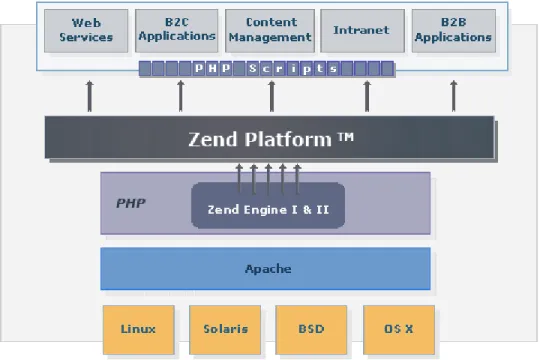
Zend Platform is a complete environment that provides rich functionality by interacting with the existing PHP in a simple and generic way. Zend Platform is a non-intrusive extension to an existing environment with minimal overhead that helps obtain enhanced performance and reliability.
Zend Platform extends the Zend Engine with the organization's execution environment, providing the platform on which to base Web services, business to commerce applications, content-management, Intranet and business-to-business applications.
Figure 2: Zend Platform and the PHP-enabled Enterprise
Zend Platform consists of two deployed components the Central Server (consists of a Server + Node) and the Node component.
Zend’s Central Server is a central management component for governing node configurations and script performance information. The Central Server can be deployed as a standalone Zend Platform environment for a single server and for this reason, contains fully functioning node components. However, the
prominent application for Zend Platform is multiple server/cluster based environments. Zend Central provides a single point of access and control for multiple nodes.
Nodes are web servers that run with Apache and service a PHP application. The Zend Platform components are installed on the node to report script, database and system activity to the Central Server. Each node
installation also includes a debugger that is integrated with Zend Studio extended code management features such as profiling, debugging and correcting code directly on a node.
In essence, similar components are installed on the Central Server and the Nodes since the Central Server also performs as a node. However, the Central Server and the Node Components employ different
modules for their overall activity.
Central Server
The Central Server provides the necessary functionality for handling event information, node management and performance monitoring.
No matter how many nodes are registered in the cluster, from the users point of view Zend Central provides an efficient and useful single point of entrance. Zend Central resides on the Central Server and is in charge of displaying Platform Administration for Central Server and Node configuration. Zend Central is the main communication component for collecting, storing, configuring and receiving information from the nodes.
Communication is carried out via regular TCP/IP communication and event information is stored in a dedicated database. Zend Central governs the PHP application performance and monitoring features including configurations for nodes, PHP and event collection.
The following illustration is a representation of Zend Platform Server components:
Figure 3: Zend Platform Server Components
The Central Server is a central management component for managing and configuring nodes. The Central server component is installed once. All subsequent installations are for node components that are registered to this server in the installation process. Standalone environments base on one server only require the central component that also includes all the node components necessary for working in a single server environment.
The installation includes three main components:
1. Zend Central that includes information collection and functionality: Zend Performance, PHP Intelligence and the Java Bridge.
2. The Database is the main repository for event information collected from all registered nodes. 3. One of the main components of Zend Central is the Collector. This component, collects and
aggregates information from nodes in the cluster that is displayed in the Zend Platform PHP Intelligence module. The collector collects and aggregates information according to configurations applied to a single server or to several servers (grouped servers).
Nodes
The Nodes are the web servers that run PHP. Nodes are the individual servers that service a Web application and a collection of nodes is a cluster.
The central server governs clusters.
The following components need to be on each Node:
Basic:•
A supported operating system (Linux, Unix, Windows etc)•
A Supported Web Server (Apache, IIS)
PHP:•
PHP version 4 or 5
Zend Products•
Zend Platform•
Zend Download Server•
Zend Java Bridge•
Zend Optimizer•
Zend DebuggerNodes have to be registered with the Central Server in order to enable communication between the Node and the Central Server. There are two ways to register a Node to the Central Server: through the installation process or by manually registering the Node.
Zend Platform Nodes consist of several components that report information to the Central Server and provide debug capabilities for PHP scripts residing on a node.
A Collector Component for transferring event information to the central
Debug Infrastructure for debugging live pages directly from a node (This option is supported by Zend Studio)The following illustration is a representation of Zend Platform Node components:
Figure 4: Zend Platform Node Components
The Collector component listens to the running processes and collects event information (For more on Events go to “Configuring Events”), to be reported to the Central Server over a regular TCP/IP connection using SSL. However, only if the node has the appropriate certificate indicating that it is part of the cluster will the Central Server agree to receive event information from a node’s collector.
The type of information the Collector listens to and collects is event information determined by Event Rules that are configured on the Central Server. Event information is sent to the Central server where it is aggregated according to event type (more about event aggregation can be found in Appendix D - “Event Aggregation Mechanism”). Different Rules can be applied to different nodes in a cluster environment or specific settings can be applied to more than one node in a cluster (by using the Clone Server feature). The Debugger Infrastructure is enabled via the Zend Studio/Zend Platform Communication Tunnel that is geared to work in development and production environments. With the appropriate configuration, the Debugger Infrastructure can work through Firewalls or NAT devices that may be positioned between the Node and Zend Studio (more about Firewall traversal can be found in “Configuring Communication with Zend Studio". The Debugger Infrastructure provides full lifecycle support for editing debugging, profiling and deploying code by enabling to view and edit Event source code in the Zend Studio development environment. This provides Zend Studio users with access the remote debugger via the same
communication tunnel that routs full-duplex traffic over HTTP. The Debugger Infrastructure utilizes the Communication Tunnel, ensuring that multiple servers can be debugged through the same Communication Tunnel at once.
Figure 5: Communication with Zend Studio
Central-Node Communication
Traffic between the Central Server and Node clusters mostly occurs from the nodes to the central server with the nodes reporting event information through the collector component to Zend Central.
However, Zend Platform has a Server Status feature that periodically checks the availability of each Node in the cluster and provides up to date information regarding the components installed on the nodes. The following diagram illustrates the communication between the Central Server and Nodes in a Cluster:
Platform Administration, a Single Point of Access
Zend Platform’s sophisticated architecture enables to use the Central Server as a single point of access for node availability and configuration, enabling to configure node settings and behavior from the Central Server itself. This connectivity is achieved by the addition of Platform Administration components on the Nodes as well as on the Central Server in the installation process. In this process the Central Server’s URL is specified to the Nodes as a central control unit and from that point onwards, access and read write permissions to nodes, can be established from the Central Server.
The Zend Platform installation, produces an out-of-the-box fully functioning version of Zend Platform. This installation includes basic default settings for monitoring events and code acceleration. At this stage Zend Platform already generates events and improves code generation. However, to benefit from Full-Power Cluster Management, Development integration with Zend Studio, Audit Trails, and much more, it is necessary to tune Zend Platform’s performance settings to suit your individual work environment. In this chapter, each configuration task is detailed by module in a chronological order beginning from the initial configuration tasks to configurations that may rely on other settings.
The configuration actions addressed in this chapter are listed below:
Cluster Management - Add the servers that you want Zend Platform to control. Each server should be added and then grouped to create a cluster environment to be treated as a single entity in terms of event collection.
PHP Intelligence•
Configure Event Triggers - customize the Event Triggers to suit your working environment. The Zend Platform installation comes ready with default configurations; however, it is recommended that a person with an understanding of the environments settings and performance standards, configure Event Triggers accordingly.•
Configure Event Actions - once Event Triggers are configured the next logical step is to determine the actions and action rules that can be applied to Events generated according to Event Triggers.
Performance -Adjust performance requirements is a way to benefit from Zend Platform's advanced performance features.
Configuration•
Configure Studio Server / Tunneling - Zend Platform’s tight integration with the Zend Studio IDE provides an efficient means for improving the development lifecycle. Environments that contain security precautions such as firewalls and NAT can set up Zend Platform to provide a secure means for obtaining integration with Zend Studio without compromising an organization's security measures.•
Configuring PHP Settings - configure your PHP and Zend products directly from Zend Platform.•
Clone Settings - once all initial settings have been configured, the Clone Settings feature can beused to apply settings to other nodes in one single step.
Users and Groups - Grant different levels of permissions to different users provides a means for controlling actions performed in the environment and for enforcing work procedures. This is the last step to customizing Zend Platform to your working environment.
License Management - Manage licenses for the central server and all nodes belonging to the cluster.Cluster Management
IN THIS CHAPTER... SERVER MANAGEMENT GROUP MANAGEMENT VHOST MANAGEMENT
RESTRICTING ACCESS TO VIRTUAL HOSTS
Zend Platform manages clusters to make them available and manageable from a single location – the Central Server. Zend Platform treats clusters as a single unit for monitoring and management purposes. Moreover, through the Central Server each node in the cluster can be individually accessed.
(The Central Server aggregates events originating from different servers; however, they include an identifier for each node on which the Event occurred).
The installation process (and later on the Setup Tool) is used for adding servers to the cluster to become Nodes belonging to the Central Server. Once users add a server, the server's settings can be applied and modified using the Central Server.
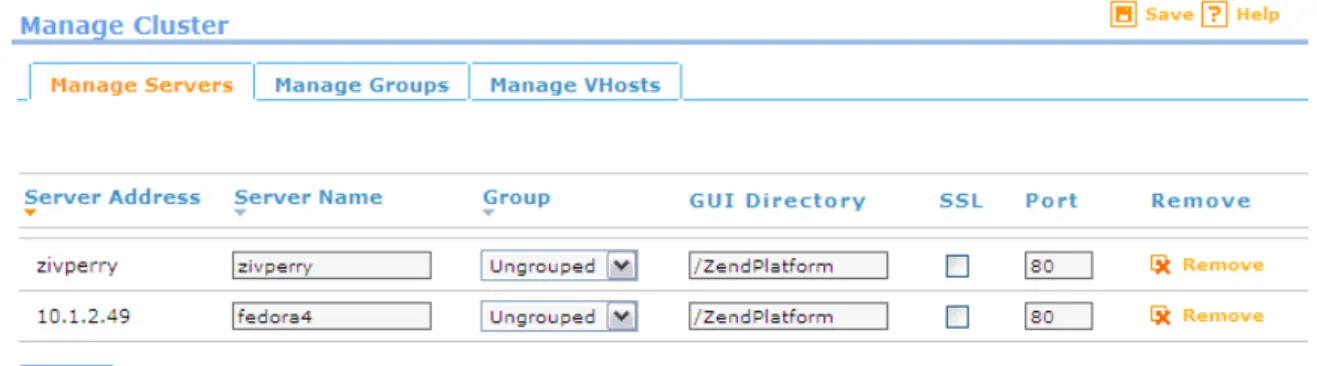
The following cluster setting options are available from: Platform | Cluster Management:
Manage Servers - Configure, delete and define servers.
Manage Groups - Group servers together for event reporting and configuration purposes.
Manage VHost (Virtual Hosts) - Manually delete and define Virtual HostsFigure 7: Manage Clusters Dialog Define Event Triggers once the servers have been configured and grouped.
Server Management
To access this tab go to Platform | Cluster Management and select Manage Servers.
The Manage Servers tab provides options for configuring and defining settings for servers added to Zend Platform using Zend Platforms Setup Tool.
Only servers installed with the Zend Platform Setup Tool will appear in the Manage Server tab. To add a server to Zend Platform so that it appears in the Manage Clusters screen:
1. Run the Setup Tool (Please see the Zend Platform Installation Guide for details on Node installation).
2. Zend Platform automatically identifies registered servers and displays them in the Manage Servers tab.
3. The installation script sets the Server Name and users can now define the new server's settings. Server settings are defined from Platform | Cluster Management | Manage Servers.
The Server management settings are as follows:
Server Address - The actual hosts address (not editable).
Server Name - The server’s name for identification and all references to the server from Zend Platform.
Group - Designate a server to an existing group (new groups are added to the list from the Manage Groups tab).
GUI Directory - States the location of the server’s Platform Administration Installation.
SSL - Check the box if the server uses SSL.
Port - Specifies the port with which the specific server works.
Remove - Removes the server from the database (unregistered) and deletes all events related to the removed server.These settings should only be changed if changes that may affect these settings occurred since the node installation.
Removing a Server
1. To remove servers go to: Platform | Cluster Management and selecting Manage Servers. 2. Select a server from the list and click "Remove.
3. Manage Servers will remove the server from Zend Platform and all functionality will be disconnected.
Attempting to remove a server while another user is working on the server (through Zend platform), will activate a prompt message asking the user to select another server. Active Pop-up Blockers may interfere with this action causing a notification message to appear asking the user to actively select the "Select Server" option. This message will only appear once furthermore, deactivate all Pop-up Blockers when using Zend Platform or allow Pop-ups from the Zend Platform URL.
Note:
To add a removed server you can re-register by going to the server and running in UNIX: …<install dir>/bin/register_node.sh and in Windows by running the Setup Tool: Start | Programs | Zend Platform | Setup Tool.
Group Management
The Group Management tab provides options grouping servers together for event reporting and configuration purposes.
Groups are created for three distinct purposes:
To aggregate Events across nodes (only if the nodes are running the same Web application).
To enable configurations to be automatically applied to other servers belonging to the same group (using the Clone Configurations feature).
To facilitate handling and managing groups of servers.Note:
Groups should only be aggregated when the PHP application on all servers in the group is identical. To create a new group:
1. Give the Group a name in the "Add a new group field" and press Add. A new group will be added to the list below.
2. If you want to aggregate all events that occur on the servers associated with the specific group select the Aggregated option.
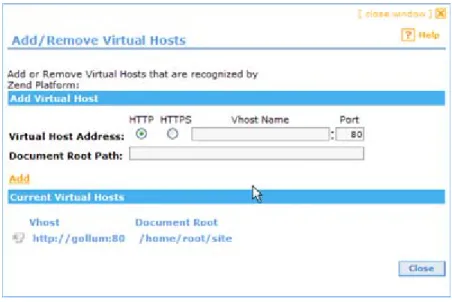
VHost Management
The Manage VHosts tab provides a way to manually define Virtual Hosts.
In general, virtual hosts are automatically added based on Event activity. However, Virtual Hosts only appear in the lists after an event is generated for a specific virtual host.
To ensure that all Virtual Hosts can be visible, an additional option has been added to manually add Virtual Hosts. This option allows users to create the actual virtual host list for any given server.
Virtual hosts can be added or deleted from this tab.
Virtual hosts are added per server and deleted in one of two ways:
1. Per virtual host name - do not select a specific server name before adding or deleting the virtual host.
2. Per virtual host for a specific server - select a specific server name before adding or deleting the virtual host.
When deleting a virtual host the database will permanently delete all events related to the deleted virtual host.
Restricting Access to Virtual Hosts
Defining Virtual Hosts provides a way to prevent certain users from gaining access to information regarding certain Virtual Hosts. Restricting access to a Virtual Host by user name is an additional level of authorization that is more precise than granting permissions per server.
To restrict user permissions by virtual host: 1. Go to Platform | User Management.
2. Select the User (who should be denied permissions) and click "Edit".
The Edit User Wizard opens (see Adding and Editing Users for complete instructions on the Edit User Wizard).
3. In step two make sure the check box next to "No Server Restriction" is left unchecked. 4. Select the check box next to the virtual hosts that should be granted access.
This will grant access to the selected virtual hosts only
5. Click "Finish" to close the Edit User Wizard and return to the User Management Screen.
Change Server Option
Zend Platform provides a single user interface for activities that are performed both on the Zend Central (the cluster governing component) and nodes (servers that have been assigned to the central). The transparent user interface provides users with the ability to transition between servers.
Note:
The Change Server screen is a pop-up. If you have a Pop-up Blocker activated on your browser, make sure that pop-ups are allowed for the Zend Platform URL or deactivate the Pop-up Blocker entirely. The user interface is divided into actions that are performed on the central server and actions that are performed on a selected node.
The actions performed on the Central server are as follows:
Platform (administration menu): Dashboard, Status, Preferences, User Management, Cluster Management and license Management.
PHP Intelligence: System Health, Graphs, Event List, Event Triggers and Event Actions.
Session Clustering: Statistics and Settings.
Job Queues: Queues, Jobs and Settings.
Integration: BIRT Reports (The Java Bridge must be up and running on the central server in order to render the reports).The actions performed on a selected node are as follows:
Performance: Console, Settings, File View, Testing, Tuning and ZDS.
Configuration: Studio, PHP Configuration, PHP Info and Clone wizard.
Integration: Java Bridge.The Server Indicator, displays the name of the server on which you are currently working, the user name used to log-in, a log-out option and the current date and time.
When on a node, the Server Indicator will add an additional option to change the server. This option will not appear on when performing actions on the central server.
The "Change Server" option opens a tree that displays all the available servers that the currently logged-in user is permitted to view. Servers can be displayed logged-in the tree by Groups or alphabetically.
To change a server:
1. Click "Change Server".
2. Choose a Sever from the list and click Select.
3. If you cannot see a specific server, it is possible that you do not have the correct user
permissions, in that case go to: Platform | User Management and check to see if your User has a "Server Restriction". Alternately, contact your System administrator to grant access to this server through your Zend Platform user permissions.
PHP Intelligence
IN THIS CHAPTER...
CONFIGURING EVENT TRIGGERS WHY CONFIGURE EVENT TRIGGERS FILTERING EVENT TRIGGERS DEFINING EVENT TRIGGERS
CHOOSING AND DEFINING EVENT TRIGGERS CUSTOM EVENTS
DEFINE EVENT ACTIONS
Configuring Event Triggers
Customize Event triggers to suit your working environment. Zend Platform comes ready with default configurations. However, a person with an understanding of the environment’s settings and performance standards should construct the Event Triggers to suit each unique environment. Event Triggers define the conditions under which events are captured by the monitoring system (PHP Intelligence).
To Configure Event Triggers, go to PHP Intelligence | Event Triggers or use the Shortcut from Platform | Dashboard.
Users are prompted to select a node before entering the Event configuration screen as all configurations are made to a selected node. The top bars of screens display the name of the node, no name means the user is working directly on the Central Server.
For example, the image below displays the following text: Server name "zivperry". This means that the user is no longer working on the Central Server but working directly on the node (in our case a node aliased zivperry).
The Event Triggers screen is used for defining and modifying Event Triggers to monitor events on a specific node. The table is used to define the conditions under which an event will be captured by the monitoring system.
The possible actions on this screen are:
Configure Event Triggers for a specific server.
View Event Triggers currently defined for the node.
Filter the view of events displayed in the “Define Event Triggers” table.
Clone EventsTo configure Event Triggers:
1. Click “Event Triggers” in the “Configuration and Management Tools” list of shortcuts. The "Select Server to Configure" screen opens.
2. Select a server from the “Server Tree.”
3. Click "Select" to open the “Event Triggers” screen for the selected server.
Figure 9: Select Server to Configure
Notes:
To configure multiple servers or a server group with the same Event Triggers: (1) configure a selected server
(2) use the Quick Clone button to propagate settings from that server to other server nodes.
Event Types are specific events configured by administrators for monitoring a server/node. The Define Event Triggers procedure is used to define the conditions under which a server will generate an Event of a specific severity when an event (of the type) occurs. The Event Types supported in the current version of Zend Platform are described below.
Why Configure Event Triggers
Event Triggers are an essential tool for pinpointing bottlenecks in Web applications. Events not only indicate that one of the thresholds was breached they also collect information relevant to the occurrence to provide a full audit-trail for diagnostics.
In terms of the outcome, these thresholds can be directly translated into performance issues the end user may encounter. Therefore, the more Events resolved the better the application will run.
By using Event Triggers, scripts can be monitored to identify with precision the number of milliseconds or percentage it takes to execute a script. This identification is based on parameters that you can determine as acceptable performance thresholds.
Filtering Event Triggers
Zend Platform is equipped with 12 types of Events for monitoring performance and script execution. The default Event Trigger display is a non-filtered view that shows all the available Alerts. A filter is provided to allow displaying a selection of events by type.
To filter events:
1. Click "Filter By" to expand the filter list.
2. Use the two drop-down fields to select the Events to display by:
•
Events from – The area where the event originated (script, database, web server, etc.)•
Event Types – Filter view to display Events according to their Event Type (The selection changes according to the area chosen in the “Events From” field).3. Click "Go" to filter the view.
Defining Event Triggers
The fields that make up the Define Event Triggers table are:
Event Type - The type of event that, under the rules defined, will produce an alert in the monitoring system.
Active - When enabled for a specific event, Zend Monitor (node) will report alerts when they occur (This gives the user the right to disable an event for a particular server).
Rules - Defines the conditions under which an event will produce a report. For example, (Red) Script Runtime Exceeds 500 Seconds means that the system will generate a critical (red) event— for Slow Script Execution (Absolute) type events, when meeting the condition (> 500 sec.).Note:
The user defines the thresholds for both the moderate and severe events. Some events have only one level of severity (like function error).
To define whether Zend Monitor will report a specific event, enable/disable the event in the Active column of the Define Event Triggers table.
To save the changes to Event Trigger definitions, click Save Rules. The database will update with the changes.Each event type has its own advantages and characteristics. See the Chapter on Choosing and Defining Event triggers for more information about each Event type.
Note:
Events marked as “Performance Monitoring Events” have a special role in optimizing web application performance.
Choosing and Defining Event Triggers
Each Event Type has its own advantages and characteristics. Listed below are the different Event Types, their descriptions and recommended usage.
Note:
Events marked as “Performance Monitoring Events” have a special role in optimizing web application performance. This topic is addressed in the Chapter on "Implementing the Performance Lifecycle". The following is a list of event types, click on the event name for more information about a specific event:
Slow Script Execution Absolute - Generates an event when executing a script exceeds defined limits.
Slow Script Execution Relative - Generates an event when script execution is lower or higher than the average script execution time.
PHP Error - PHP Errors are used to identify all types of PHP errors. This type of event is useful in QA processes to identify problems that may have slipped through the cracks during production.
Function Error - Generate a severe event when an error in one of the specified PHP Functions occurs
Slow Function Execution - Identify bottlenecks within functions.
Excess Memory Usage (Absolute and Relative) - Identify when scripts are using excess memory that can hinder the application's ability to perform.
Database Error - Report database-related function fails.
Slow Query Execution - Identify database performance slow queries that can directly influence Web server performance.
Inconsistent Output Size - Verify the page is rendering the same output to the client each time.
Load Average - Monitor the overall health of processes running on the server.
Custom Event - Generate an event whenever the API function monitor_custom_event() is called from a PHP script.Slow Script Execution Absolute
This is a performance-monitoring event.
Absolute Slow Script Execution is used to generate an event when executing a script exceeds defined limits. This function is used to maintain performance standards.
Default parameters are 500 msec for moderate, 2000 msec for severe alerts. Additional Rules:
Suppress in case a "Slow Function Execution" event occurs. Selecting this option ignores "Slow Script Execution" events caused by a slow function. This is to prevent double reporting, as PHP Intelligence will report these events as "Slow Function Execution" events.
Suppress in case the load average is above X - Selecting this option ignores events that occur when the average number of active processes waiting for CPU time is above x active processes (3 active processes is the default value).Note:
These additional rules are applied to the Absolute and Relative Slow Script Execution event types.
Slow Script Execution Relative
This is a performance-monitoring event.
Relative Slow Script Execution generates an event when script execution is lower or higher than the average script execution time. Parameters should be set to a certain percentage for moderate and severe alerts.
The default values for this event type are set to 0. To generate events, configure these settings to a value that suits required script run-time.
Additional Rules:
Suppress in case a "Slow Function Execution" event occurs. Selecting this option ignores "Slow Script Execution" events caused by a slow function. This is to prevent double reporting, as PHP Intelligence reports these events as "Slow Function Execution" events.
Suppress in case the load average is above x - Selecting this option ignores events that occur when the average number of active processes waiting for CPU time is above x active processes (3 active processes is the default value).Note:
These additional rules are defined in the Absolute Slow Script execution cell. Relative Events:
Event definitions are based on relative values i.e. percentage. Relative values are set according to warm-up settings, default value of 500 requests. If necessary, modify the default value by changing the zend_monitor.warmup_requests directive in the zend.ini.
PHP Error
PHP Errors identify all types of PHP errors such as:
Hard errors that cause stops in page execution.
Warnings that interrupt the end user experience.
Notices that could lead to larger problems.This type of event is useful in QA processes to identify problems that may have slipped through the cracks during production.
Description:
Used to generate severe or moderate events on selected PHP errors, when they occur, and identify real-time failures for given users.
To select a PHP Error Level, scroll through the selection and use CTRL for multiple selections. The trigger types lists are the same; therefore severe event selection takes priority over moderate event selection. Additional Rules:
Event reporting for PHP errors can be changed by setting error reporting to 0 or using the silence operator @.
There are three options for activating Additional Rules:
1. Always Report Errors - Ignore the error-reporting setting and the silence operator and report all PHP errors.
2. Report errors that match the error-reporting criteria - Ignore all PHP errors silenced using either the error-reporting setting or the silence operator.
3. Report any errors not silenced with the operator @ - Ignore the error-reporting setting and only ignore errors silenced with the silence operator.
Function Error
Functions return Function Errors and therefore offer specific information about the root of the error that does not always arise from PHP errors.
QA and Production use this Event for identifying run-time events, as opposed to PHP errors that identify code-related/syntactical events.
Function Errors can prove to be invaluable to an organization as they provide a different perspective on problems (view the outside problems through the eyes of PHP). Despite the fact that the code may be running okay, this Event indicates what other outside problems (i.e. network, database, web services, file system etc.) you may have, based on the PHP function’s behavior. Issues like these used to be difficult to reproduce however with the complete audit trail and full problem context, Function Errors can be easily reproduced to a level of accuracy that mirrors the actual time of occurrence.
Description:
Generate a severe event when an error in one of the specified PHP Functions (built-in or user-defined) fails (returns a FALSE value).
There are three ways to monitor PHP functions:
1. Specify the function name, object methods can also be used (for example, bar::foo). 2. Use wild cards (*) to specify a range of function names for example myFunc_* will select all
functions beginning with myFunc_.
3. Specify the full path to a file containing a list of functions, each in a new line.
Note:
Database related functions are directed and reported as Database Errors (see the "Database Error" event type).
Watched Functions File Event Types
The Watched Functions file can add Function Error and Slow Function Execution event types (PHP Intelligence | Event Triggers) by entering a function in the field and pressing Add or specifying the full path to a file containing a list of functions.
When users apply the Watched Functions file to the “Function Error” Event Type, the functions included in the file will be monitored and an Event Details screen will be generated.
Slow Function Execution
This is a performance-monitoring event.
Slow Function Execution identify bottlenecks within functions providing a more granular approach than finding bottlenecks in pages.
This type of event is useful in the production process for pinpointing performance bottlenecks by watching functions that the user specifies.
Slow Function Execution events provide a different perspective on problems (view outside problems through the eyes of PHP). Despite the fact that the code may be running okay, this Event indicates what other outside problems (i.e. network, database, web services, file system etc.) you may have, based on the PHP function’s behavior. This Event is also useful for catching pure PHP functions that are performing slowly.
Description: Generates an event when function execution exceeds the setting defined in the rule. The default values are, 500 msec for moderate, 1000 msec for severe alerts. This applies to the functions selected in the additional rules section.
Additional Rules:
Generate events for specified PHP functions (built-in or user-defined). There are three ways monitor functions:
1. Specify the function name, object methods can also be used (for example, bar::foo). 2. Use wild cards (*) to specify a range of function names for example mysql_* will select all
functions beginning with mysql_.
3. Specify the full path to a file containing a list of functions, each in a new line.
Note:
Database related functions reported as Slow Query Execution events (see the "Slow Query Execution" event type).
When applying a Watched Functions file to “Slow Function Execution” events, the functions included in the file are monitored and Event Reports are generated when the function execution exceeds the values defined to trigger a moderate or severe event.
Excess Memory Usage (Absolute and Relative)
This is a performance-monitoring event.
(Absolute – a customer configured hard number; Relative – a customer configured percentage) Excess Memory Usage events identify when scripts are using excess memory that can hinder the application's ability to perform.
Production environments mainly use this event type but QA can also benefit from monitoring by KB or percentage of memory used by a script to execute.
Description:
Excess Memory Usage (Absolute) - Generates an event when memory for PHP script execution uses more than a set amount of KB for moderate events and severe events.
Excess Memory Usage (Relative) - Generates an event when memory use for PHP script execution is above or below average, a set percent for moderate and severe events.Note:
Both Event Types are only active if the PHP is compiled with memory limit. (Compile the PHP, with the configure switch "--enable-memory-limit".
The default values for both of these event types are set to 0. To generate events, configure these settings to a value that suits required memory usage.
Relative Events:
Event definitions are based on relative values i.e. percentage. Relative values are set according to warm-up settings, default value of 500 requests. If necessary, change the
zend_monitor.warmup_requests directive in the zend.ini.
Database Error
Database Error Events report function errors such as:
Connection errors
Database selection errors
General database function errorsThese events do not require any additional configurations to the database. Production environments can use the information to delineate between a PHP problem and a database problem.
Database Errors can prove to be invaluable to an organization as they provide insight into the Database reliability along with a different perspective on problems (view outside problems through the eyes of PHP). Issues like these used to be difficult to reproduce however with the complete audit trail and full problem context, Database Errors can be easily reproduced to a level of accuracy that mirrors the actual time of occurrence.
Description:
Database errors generate events when database-related functions fail. This event is directly associated to the "Function Error" event and is activated and defined in correlation with this event type.
Database functions that should be reported are defined (or deleted) from the "Function Error" functions list.
Note:
To view supported databases, see the database related function prefixes listed in: <install_dir>/lib/db_functions.txt or in windows <install_dir>\lib\db_functions.txt.
Slow Query Execution
Slow Query Execution events identify slow queries that are related to database performance that can directly influence Web server performance.
Slow queries, if not pinpointed, can bring the server down by:
Causing excess web server processes (Apache).
Hang up queries in the database causing slower responses in the database.These events do not require any additional configurations to the database. Production environments can use this information to pinpoint performance bottlenecks in the database.
Description:
Generates an event whenever database related function execution rises above the given threshold. This event is directly associated to the "Slow Function Execution" event and is activated and defined in correlation with this event type.
Database functions that should be reported are defined in the "Slow Function Execution" function list (in additional rules).
Note:
To view supported databases, see the database related function prefixes listed in: <install_dir>/lib/db_functions.txt or in windows <install_dir>\lib\db_functions.txt.
Inconsistent Output Size
Inconsistent Output Size events verify that pages render the same output to the client each time. If pages do not render the same each time, some clients are seeing different output than others and an error has occurred.
Production environments use this event as an indicator for possible usability issues. Description:
Inconsistent Output events generate an event whenever the output size is below or above the normally produced average output. The default values for this event type are set to 0. To generate events, configure these settings to a value that suits acceptable variance in percents from output to output of scripts.
Relative Events:
Event definitions are based on relative values i.e. percentage. Relative values are set according to warm-up settings, default value of 500 requests. If necessary, the default value can be modified manually by changing the zend_monitor.warmup_requests directive in the zend.ini.
Load Average
Load Average events monitor the overall health of processes running on the server.
This event is used in production to highlight critical situations that might require analysis during high traffic situations.
Description:
In Unix, Mac and Linux this event is triggered when the number of active processes waiting for CPU time, is higher than the number defined in the rule. The default definitions for are set to 0 for moderate and 0 for severe events.
In Windows this event is triggered when the CPU exceeds a certain load percentage threshold. The default definitions for Windows are 90% for moderate and 95% for severe.
To start generating events set a logical value based on the server’s capabilities.
Custom Events
Custom events are a unique type of event for Zend Platform users to initiate events from scripts. This type of event is different from other event types because it controls event generation as opposed to other events that trigger events by a certain occurrence.
Custom events are used to generate an event whenever the API function monitor_custom_event() is called from the PHP script.
Description:
This event type enables the generation of an event on occurrences that are not necessarily built-in Zend Platform events (error and performance issues). Custom events are used whenever you decide that it is significant to generate an event in a certain situation. Each event type is given a name for easy
Function Usage:
monitor_custom_event(string $class, string $text[, integer $severe, mixed $user_data]) Parameters:
$class – helps to define several types of custom events. This description will be showed in the Event List and in the Event Details.
$text - error text used to describe the reason for the event. This text will appear in the Event Details.
$severe - the severity level of the triggered event, default value is Severe.
$user_data - adds a PHP variable that will be viewed in the Event Details (in Event Context-> Variables->User Defined). This forms the stored event data (similar to the information obtained in a PHP error event).Aggregation takes place for these events when two events occur in the same place and have the same $class $text $sever(ity)
Note:
Action Rules defined for these events should be set to “send to URL” rather than “sending by e-mail” as there is only one definition for these events and event reports sent to a URL can be easily forwarded elsewhere. This is to prevent the overloading of e-mail. If we use the e-mail action, for every custom event, e-mail will be sent, and there can be many classes of custom events. However if the URL action is used, a script can be used to identify the event’s class and different behaviors can be implemented according to class.
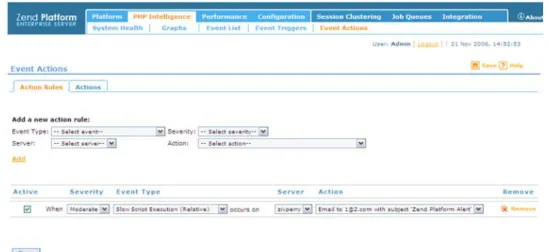
Define Event Actions
Once Event Triggers are configured, the next logical step is to determine event actions and action rules. All Events are immediately reported inside Zend Platform’s PHP Intelligence module. Events can be viewed from: PHP Intelligence | Event List. However, Events and the information included in the Event Details screen can also be sent via E-mail or to a URL by configuring Event Triggers.
Actions are applied to generated Events.
All Events are immediately reported inside Zend Platform’s PHP Intelligence module. Events can be viewed from: PHP Intelligence | Event List.
Event Actions enable sending Event details via E-mail, URL or by SNMP (Simple Network Management Protocol).
To configure Event Actions go to: PHP Intelligence | Event Actions.
There are two steps to defining event actions. The first is to define “Actions and the second is to define “Action Rules".
Actions determine how the Event Details will be sent by specifying an e-mail address, a URL or an SNMP alert.
Actions Rules determine which events by specific criteria will be sent.Note:
Define Actions
Clicking the Event Actions URL opens the Actions dialog. This dialog allows you to define or remove Actions for the entire cluster.
Figure 10: Event Actions From the Actions screen you can:
Add/remove global Action Types from a central administrative station
View Action Types currently defined in the system To add an Action:1. Select one of the options from the Action Type drop-down list.
2. Depending on the selection e-mail, URL or SNMP trap the action type details will change. 3. Enter the information according to the selected Action Type:
•
Target URL for the action type “Submit a report to the specified URL”•
Recipient Address and Subject for the Action Type, “Send a report via e-mail.”•
SNMP:o
NMS Target Machine - The SNMP Trap's destination address.o
Community String - The Community and port (default port is 162, and the default community string is 'public').o
Download MIB (Management Information Base) file - Browse to find the MIB file and place it in the NMS. If a problem occurs accessing the MIB file, the relevant error will be given instead.4. Click "Add" to add the new Action Type to the “Current Action Types” list.
Note:
These Action Types can now be associated with Action Rules (see below). You can also change or remove the Action Type settings at any time.