MJCCA9 – 716 ISSN 1857-5552 e-ISSN 1857-5625
Received: October 15, 2016 DOI: 10.20450/mjcce.2016.1073
Accepted: November 21, 2016 Original scientific paper
HPLC METHOD VALIDATION AND APPLICATION FOR ORGANIC ACID ANALYSIS
IN WINE AFTER SOLID-PHASE EXTRACTION
Krste Tašev1,2, Marina Stefova2, Violeta Ivanova-Petropulos3*
1State Phytosanitary Laboratory, Blvd. Alexander the Great bb, 1000 Skopje, Republic of Macedonia
2Institute of Chemistry, Faculty of Natural Sciences and Mathematics, Ss. Cyril and Methodius University,
Arhimedova 5, Skopje, Republic of Macedonia
3Faculty of Agriculture, Goce Delčev University, Krste Misirkov bb, Štip, Republic of Macedonia
A solid-phase extraction method followed by reverse phase high-performance liquid chromatog-raphy (RP-HPLC) was optimized and validated for the quantitative determination of tartaric, malic, shi-kimic, lactic, citric and succinic acids in wine. Solid-phase extraction was carried out with C18 cartridges and extraction recoveries for all acids ranging from 98.3 to 103% were obtained. HPLC separation was performed with isocratic elution on a LiChrosorb RP-18 column (250 × 4.6 mm I.D., 5 µm) protected with the appropriate guard column. The mobile phase was a 5 mM solution of H3PO4 with pH 2.1 at a
flow rate of 1 ml/min. Detection of the organic acids was performed at 210 nm. The developed method was validated by checking its linearity, limit of detection (LOD), limit of quantification (LOQ), precision and recovery. The method was applied to the analysis of organic acids in Macedonian red and white wines.
Keywords: wine; organic acids; separation; HPLC; validation
ВАЛИДАЦИЈА И ПРИМЕНА НА HPLC ЗА АНАЛИЗА НА ОРГАНСКИ КИСЕЛИНИ ВО ВИНО ПО ЦВРСТО-ФАЗНА ЕКСТРАКЦИЈА
Оптимизиран и валидиран е метод за квантитативна анализа на винска, јаболкова, шикимска, млечна, лимонска и килибарна киселина во вино со цврсто-фазна екстракција следена со реверзно-фазна високо ефикасна течна хроматографија (RP-HPLC). Цврсто-фазната екстракција е изведена со колони C18 и добиениот аналитички принос за сите киселини се движи од 98,3 до 103%. Разделувањето со HPLC е извршено со изократско елуирање на LiChrosorb-ова колона RP-18 (250 × 4,6 mm I.D., 5 µm) користејќи соодветна претколона. Мобилната фаза којашто е употребена за елуирање е раствор од H3PO4 со концентрација 5 mM и pH 2,1 при проток од 1
ml/min. Детекцијата на органските киселини е извршена со следење на апсорбанцата на 210 nm. Развиениот метод е валидиран со проверка на неговата линеарност, осетливост, граница на детекција (LOD), граница на квантификација (LOQ), аналитички принос и прецизност. Методот потоа е применет за анализа на органски киселини во македонски црвени и бели вина.
Клучни зборови: вино; органски киселини; сепарација; HPLC; валидација
1. INTRODUCTION
Organic acids are major components in wine that determine its acidity and influence its sensorial
grow, meaning wine is more stable and has greater potential for aging. During aging, acids are in-volved in reactions leading to the formation of esters and influence the development of the desired wine bouquet. In general, white wine has higher
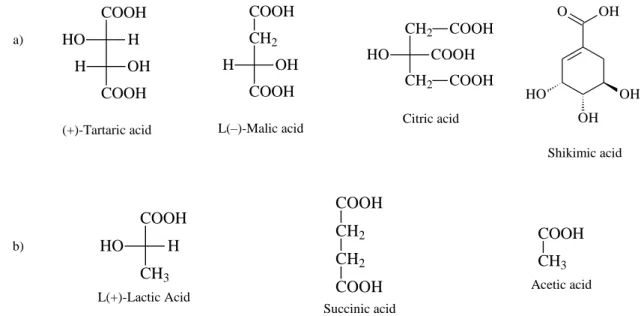
acidity than red wine. The organic acids in wine mainly originate from the grapes (tartaric, malic, citric and shikimic) (Fig. 1a) or they are formed during the alcoholic and malolactic fermentation (lactic, succinic and acetic) (Fig. 1b).
a) COOH H HO OH H COOH (+)-Tartaric acid COOH CH2 OH H COOH L(–)-Malic acid CH2 CH2 COOH HO COOH COOH Citric acid OH O HO OH OH Shikimic acid
b) HO H
CH3 COOH L(+)-Lactic Acid COOH CH2 CH2 COOH Succinic acid COOH CH3 Acetic acid
Fig. 1.
Chemical structures of organic acids in wine: a) originating from grapes and b) formed during vinification
Tartaric acid is one of the most abundant ac-ids in grapes and wine with concentrations in un-ripe grapes as high as 15 g/l, while in the grape must, it ranges between 2 and 6 g/l depending on the temperature to which the grapes were exposed [2]. Malic acid is also present in grapes and wine. Unripe grapes may contain as much as 25 g/l, but during ripening, its concentration is halved due to dilution as the grapes grow larger. The presence of malic acid results in a wine with “harsh” taste. During malolactic fermentation, malic acid con-verts to lactic acid, which leads to “wine soften-ing” and fruity and vegetative aromas, as well as the mouthfeel of wine [3]. Shikimic acid is another grape organic acid present in low concentrations in the grape must (0.01–0.15 g/l). It is considered a factor for the determination of grape origin [4, 5]. Citric acid also belongs to the group of grape or-ganic acids, and is an important component in bio-chemical and metabolic processes (e.g. Krebs cy-cle), which slow the yeast growth, but do not block it [2]. Its concentration in grape must ranges be-tween 0.5 and 1 g/l. This component is allowed to be added to wine to regulate the acidity, but its level should not exceed 1 g/l. Succinic acid is a product of the alcoholic fermentation and gives a “bitter” note to the wine causing salivation. Acetic acid is formed during fermentation and it is the
principal component of the volatile acidity of wine, which should be monitored throughout the wine-making process.
Among the different methods used for wine analysis, reversed phase high-performance liquid chromatography (RP-HPLC) is commonly em-ployed for the separation of organic acids in wine and grapes using a C18 column and UV/Vis diode-array detector. Separation is usually performed with isocratic elution with an acidified polar sol-vent, such as an aqueous solution of phosphoric or sulfuric acid [6–9]. Organic acids show an absorb-ance maximum in the UV/Vis region at 210 nm. Before HPLC analysis, sample pre-treatment pro-cedures should be performed: (a) simple pre-treatment, such as dilution and filtration, or more complex treatment, such as solid-phase extraction (SPE). The more common previous treatments are extraction with ion-exchange resins or with SPE cartridges and a derivatization procedure in order to avoid interference from sugars and colored compounds, which could co-elute with organic acids [10, 11].
wines. Sample pre-treatment included SPE of acids on C18 cartridges prior to the HPLC analysis.
2. EXPERIMENTAL
2.1. Chemicalsand reagents
Standards of the organic acids used in this study are listed as follows: L(-) malic acid (>98%), citric acid (>98%) and succinic acid (>98%), sup-plied from Sigma Aldrich (Steinheim, Germany), and L(+)-tartaric acid (>98%), L(+)-lactic acid (>98%) and shikimic acid (>98%), supplied from Fluka (Munich, Germany). H3PO4 (85%) was pro-vided by Carlo Erba (Cornaredo, Italy). Water and acetonitrile of HPLC grade were from Sigma (Steinheim, Germany). The used HPLC columns were Supelco LiChrosorb RP-18 (250 x 4.6 mm I.D., 5 μm particle size), Varian C18 (150 × 4.6 mm I.D., 5 μm particle size), Agilent Zorbax C18 SB (150 × 4.6 mm I.D., 5 μm particle size) and Perkin Elmer C18 (150 × 4.6 mm I.D., 5 μm parti-cle size). The cartridges used for SPE were Supelclean LC-18 (Supelco). PTFE filters (25 mm × 0.45 μm) (Supelco) were used for filtration of the samples.
2.2. Wine samples
Ten white (Riesling, Chardonnay, Temja-nika, Smederevka and Traminec) and ten red (Vranec, Merlot and Cabernet Sauvignon) wines from different Vitis vinifera L. grape varieties from vintages 2011, 2012 and 2013 were collected di-rectly from the commercial wineries located in different wine regions in Macedonia.
2.3. Sample preparation using SPE
SPE was performed in order to separate or-ganic acids from the other components in the com-plex wine matrix, such as anthocyanins, carbohy-drates and so on, which could co-elute with the acids and interfere in their measurement. For this purpose, the wine samples were first filtered and then subjected to SPE using Supelclean LC-18 SPE 500 mg cartridges. The cartridges were condi-tioned with 1 ml methanol and 1 ml water. Then, the wine samples (500 μl) were loaded on the car-tridges. Elution was performed with two portions (500 μl each) of buffered water at pH 2.1 with H3PO4 (5·10–3 mol/l). A volume of 10 μl of the eluate was injected into the HPLC system for anal-ysis of the organic acids.
2.4. HPLC analysis
A HPLC system (Varian Pro Star, Palo Alto, USA), equipped with an autosampler (model 410), photodiode array detector (PDA model 330), tem-perature control oven (model 500) and Varian Star Chromatography Workstation software (Ver. 6.41), was used for the identification and quantification of organic acids in the wine samples. Separation of the analytes was performed with isocratic elution on a Supelco LiChrosorb RP-18 column (250 mm × 4 mm I.D., 5 μm particle size). The mobile phase was an aqueous solution of H3PO4, with a concen-tration of 5·10–3 mol/l at pH 2.1, containing 1% acetonitrile as an organic modifier, at a flow rate of 1 ml/min. Separation and quantification of the organic acids was monitored at 210 nm and the sample injection volume was 10 μl.
2.5. Method validation
Linearity, precision, accuracy, limit of de-tection (LOD) and limit of quantification (LOQ) were investigated as method validation parameters. The compound peaks were identified by their re-tention times and compared with the standards and UV-Vis spectra. Quantification was performed with five point external calibration curves. Preci-sion was determined as repeatability (six succes-sive injections) and intermediate precision (three injections on five different days in one week). Ac-curacy was determined as a recovery for two dif-ferent concentration levels. The LOD was deter-mined as LOD = 3 × SD/slope and the LOQ as LOQ = 10 × SD/slope at the low concentration calibration level.
2.6. Calibration curves
For quantitative analysis of the organic acids in wine samples, external calibration curves were built in the following concentration ranges: tartaric acid 0.50–7.00 g/l; malic acid 0.05–2.50 g/l; lactic acid 0.05–1.50 g/l; citric acid 0.05–0.60 g/l; suc-cinic acid 0.05–1.20 g/l and shikimic acid 0.003– 0.07 g/l.
2.7. Statistical analysis
represent patterns of similarities or differences between the studied wines in order to make a con-clusion about possible classification.
3. RESULTS AND DISCUSSION
3.1. Method optimization
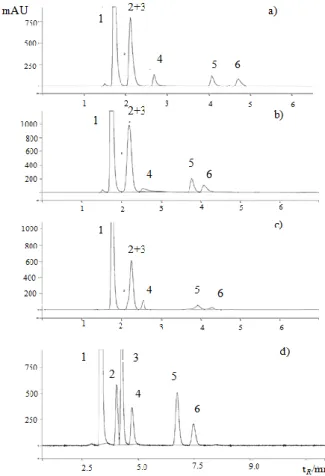
In order to develop a convenient, simple and accurate HPLC method for the quantitative deter-mination of organic acids in wine, several investi-gations were performed. A set of HPLC columns with the same bonded phases (C18) were tested in our preliminary experiments, such as PerkinElmer Brownlee C18 (150 x 4.6 mm I.D., 5 μm particle size), Varian Microsorb C18 (250 × 4.6 mm I.D., 5 μm particle size), Agilent Zorbax C18 SB (250 × 4.6 mm I.D., 5 μm particle size) and Supelco Li-Chrosorb RP-18 (250 × 4.6 mm I.D., 5 μm particle size). The general characteristics of the columns are presented in Table 1. Symmetrical peak shapes, satisfactory resolution between malic and shikimic acids and relatively short analysis times were ob-tained when separation was performed on the Supelco LiChrosorb RP-18 protected with the ap-propriate guard column (Fig. 2d).
When using the other three columns for sepa-ration, co-elution of malic and shikimic acids was observed, or the time of analysis was longer, as presented in Figure 2 a, b and c. This result can be explained by the higher carbon content of the Supelco LiChrosorb stationary phase, which is bet-ter deactivated, causing less retention and tailing due to sylanol groups on one side, and better resolu-tion due to dispersive interacresolu-tions on the other. The elution was monitored in the whole UV region and a
wavelength of 210 nm was chosen for detection of organic acids because it gives the highest sensitivity.
Fig. 2. UV-Vis chromatograms of standard solutions of organic acids obtained with the following columns: a) Perkin Elmer RP-18, b) Varian RP-18, c) Agilent ZORBAX C-18 SB and d) Supelco LiChrosorb RP-18. Peak numbers:1 - tartaric acid;2 - malic acid; 3 - shikimic acid; 4 - lactic acid; 5 - citric acid and
6 - succinic acid.
T a b l e 1
General characteristics of the HPLC columns used
Stationary phase Dimensions
(mm)
Particle size
(µm) Pore size (Å) Content of carbon, % Spherical
High purity silica gel
pH range
Agilent Zorbax C18 SB 250 × 4.6 5 80 10 yes yes 2–10
Varian Microsorb C18 250 × 4.6 5 100 12 yes yes 2–10
PerkinElmer Brownlee C18 150 × 4.6 5 110 13 yes yes 2–10
Supelco LiChrosorb RP-18 250 × 4.6 5 100 17 no no 2–10
The pH value of the mobile phase should be taken into consideration as a critical parameter for determination of organic acids in wine. This is due to the low pKa values of the organic acids: tartaric (pKa1= 3.03, pKa2= 4.45), malic (pKa1= 3.40, pKa2 = 5.20), shikimic (no data available), lactic (pKa1=
was tested through the analyte retention and the shape of analyte peaks. When using a mobile phase with a pH higher than 6, the separation was poor and the analysis time was relatively long (data not shown), which could be explained by the poor retention of the anionic forms on the reversed phase. When lowering the pH value of the mobile phase, the equilibrium was shifted towards the non-dissociated forms of the acids, separation im-proved and the best resolution between the peaks with short analysis time was obtained with a mo-bile phase with pH 2.1. Additionally, acetonitrile
(1%) was added as a modifier in order to protect the column and prolong its life.
3.2. Method validation
The linearity data, including the slope, inter-cept and coefficient of determination, are presented in Table 2. As can be seen from the table, the line-arity of the method, tested at five concentration calibration levels for each organic acid, is satisfac-tory in all cases with coefficients of determination (R2 > 0.99) ranging from 0.9988 for succinic acid to 0.9998 for tartaric acid.
T a b l e 2
Linear regression data: range of determination, coefficients of the regression curves (slope and intercept), coefficient of determination R2, LOD and LOQ
Organic acids Range (g/l) Slope Intercept R2 LOD (g/L) LOQ (g/l)
Tartaric acid 0.5–7.00 1627 51969 0.9999 0.0028 0.0093
Malic acid 0.05–2.50 817 –3718 0.9999 0.0118 0.0389
Shikimic acid 0.003–0.07 52240 70137 0.9999 0.0007 0.0026
Lactic acid 0.05–1.50 669 1628 0.9999 0.0136 0.0449
Citric acid 0.05–0.60 927 7421 0.9996 0.0128 0.0423
Succinic acid 0.05–1.20 508 –3109 0.9999 0.0123 0.0406
The order of acids is according to their elution in chromatographic separation (Fig. 2).
The LOD and LOQ were determined in the low concentration calibration region and ranged from 0.0007 to 0.0136 g/l and from 0.0026 to 0.0448 g/l, respectively.
The accuracy of the procedure was checked using the standard addition method. One Vranec wine sample was spiked with the appropriate
vol-umes of mixed standard solution of organic acids at two concentration levels (Table 3). Satisfactory results for the recovery at both concentration levels ranged from 95.7 to 105% and from 94.5 to 105 %, confirming that the method is accurate and conven-ient for quantitative analysis of organic acids in red wine.
T a b l e 3
Standard additions for checking the accuracy of the SPE-RP-HPLC method for the determination of organic acids in wine samples (n = 3)
Organic acids Conc. (g/l)
I conc. level II conc. level
Added (g/l)
Found (g/l)
Recovery (%)
Added (g/l)
Found (g/l)
Recovery (%)
Tartaric acid 3.29 1.50 4.76 97.6 3.00 6.18 96.3
Malic acid 1.10 0.30 1.40 98.6 0.912 2.06 105
Shikimic acid 0.027 0.025 0.05 100 0.035 0.062 94.6
Lactic acid 0.55 0.15 0.69 95.7 0.445 0.983 97.1
Citric acid 0.24 0.091 0.34 105 0.301 0.532 95.5
Succinic acid 0.87 0.205 1.08 104 0.513 1.363 95.9
Additionally, to check the repeatability of the method, six replicate measurements on an actu-al red wine sample were performed within one day. The RSDs of the six replicate samples for each acid ranged from 1.03% for malic acid to 3.45%
T a b l e 4
Repeatability and reproducibility for each organic acid (g/l) in red wine
<x>– average value, SD – standard deviation, RSD – relative standard deviation
3.3. Application to wine sample analysis
The optimized and validated method was ap-plied to the analysis of organic acids in Macedonian white and red wines. Table 5 summarizes the concen-trations of individual organic acids in white and red Macedonian wines determined by HPLC. The chro-matogram presenting separation of organic acids at 210 nm in Vranec red wine is shown in Figure 3.
Fig. 3. UV-Vis chromatogram of organic acids in Vranec wine. Peak numbers:1 – tartaric acid;2 – malic acid; 3 – shikimic
acid; 4 – lactic acid; 5 – citric acid and 6 – succinic acid.
In total, six acids were determined, includ-ing tartaric, malic, lactic, citric, succinic and shi-kimic acid. Tartaric acid was the dominant com-pound in all wines, both red and white. Its content in white wines ranged from 0.61 g/l in Chardonnay wine to 2.22 g/l in Temjanika. Red wines con-tained between 1.45 and 2.26 g/l (Table 5). Tartar-ic acid, whTartar-ich influences the acidity of wines, was present in a highest amount in the red wine Caber-net Sauvignon (2.26 g/l). In general, red wines contained slightly higher amounts of tartaric acid (on average 1.75 g/l) compared to white wines (on average 1.54 g/l).
Malic acid ranged between 0.12 and 0.83 g/l for the white wines and up to 0.88 g/l for the red wines (Table 5). In fact, the concentration of malic acid is highest at the beginning of alcoholic fer-mentation when the organic acids are extracted from the grapes. After fermentation, malic acid is converted into lactic acid, spontaneously, or in the presence of malolactic bacteria, during the malo-lactic fermentation [2, 12]. As a consequence of this process, the content of malic acid decreases and the content of lactic acid increases in wine. In our study, white wines contained relatively high concentrations of malic acid and relatively low con-centrations of lactic acid, meaning that malolactic fermentation was not completed in these samples. Alternatively, almost all red wines (except Vranec 4) presented low concentrations of malic acid, since it was almost completely converted into lactic acid as a result of the successful malolactic fermentation. Thus, the average content of lactic acid was 0.18 g/l in the white wines and 0.51 g/l in the red wines.
Citric acid was present in higher concentra-tions in the white wines (on average 0.25 g/l) com-pared to the red wines (on average 0.11 g/l) (Table 5). Usually, this acid is added to wine in order to correct the wine acidity and therefore its content should be controlled. All tested wines contained citric acid concentrations lower than 1 g/l, in ac-cordance with regulations [13]. In addition, succin-ic acid, whsuccin-ich is a by-product of yeast metabolism during fermentation, with a bitter-salty flavor, was found in low concentrations in both red and white wines (average value for white wines of 0.18 g/l and average value for red wines of 0.33 g/l). Shi-kimic acid was present in lowest concentrations compared to the other acids, as expected, since this acid is also present in the lowest concentrations in grapes. Thus, the average value of this acid in red wines was higher (0.0127 g/l) than in white wines (0.0046 g/l), ranging from 0.009 to 0.026 g/l and from 0.002 to 0.007 g/l, respectively (Table 5). Red wine Tartaric acid Malic acid Shikimic acid Lactic acid Citric acid Succinic acid
Repeatability (6 repetitions during one day)
<x> 3.29 1.10 0.028 0.55 0.24 0.87
SD 0.053 0.011 0.0004 0.019 0.0051 0.025
RSD (%) 1.61 1.03 1.69 3.45 2.10 2.89
Reproducibility (3 repetitions × 5 days)
<x> 3.42 1.15 0.029 0.58 0.248 0.869
SD 0.136 0.045 0.001 0.025 0.0072 0.028
T a b l e 5
Organic acid contents in commercial red and white wines (in g/l)
Wine Vintage Tartaric
acid Malic acid Lactic acid Citric acid Succinic acid
Shikimic acid
White wines
W1 Riesling 1 2012 1.94±0.01 0.34±0.01 0.15±0.00 1.59±0.01 0.15±0.01 0.004±0.00
W2 Chardonnay 1 2012 1.78±0.01 0.44±0.01 0.07±0.01 1.24±0.01 0.16±0.00 0.007±0.00
W3 Temjanika 2012 2.22±0.01 0.36±0.00 0.09±0.01 1.67±0.01 0.13±0.01 0.002±0.00
W4 Smederevka 1 2012 1.04±0.00 0.17±0.01 0.30±0.01 0.95±0.00 0.31±0.00 0.005±0.00
W5 Smederevka 2 2012 1.96±0.00 0.12±0.00 0.27±0.00 0.87±0.01 0.38±0.00 0.005±0.00
W6 Cuve (Riesling
and Smederevka) 2012 1.60±0.01 0.18±0.01 0.27±0.01 2.51±0.01 0.20±0.00 0.004±0.00
W7 Smederevka 3 2013 1.45±0.01 0.52±0.01 0.79±0.00 3.05±0.01 0.09±0.00 0.006±0.00
W8 Riesling 2 2013 1.69±0.00 0.67±0.01 0.13±0.01 3.31±0.00 0.10±0.00 0.002±0.00
W9 Traminec 2013 1.09±0.01 0.83±0.01 0.15±0.01 5.81±0.01 0.19±0.01 0.007±0.00
W10 Chardonnay 2 2013 0.61±0.00 0.73±0.01 0.23±0.01 3.73±0.01 0.05±0.01 0.003±0.00
Average 1.54±0.01 0.44±0.01 1.75±0.01 2.47±0.01 0.17±0.01 0.005±0.00
Red wines
R1 Vranec 1 2012 1.89±0.01 0.06±0.01 0.97±0.01 0.23±0.00 0.11±0.01 0.015±0.00
R2 Vranec 2 2011 1.81±0.01 n.d 0.64±0.00 0.12±0.01 0.17±0.01 0.026±0.00
R3 Merlot 1 2011 1.45±0.00 n.d 0.95±0.00 0.02±0.00 0.42±0.01 0.010±0.00
R4 Cabernet
Sauvignon 2012 2.26±0.01 0.06±0.00 0.49±0.01 0.13±0.00 0.34±0.01 0.011±0.00
R5 Vranec 3 2012 2.05±0.01 0.06±0.01 0.48±0.01 0.12±0.01 0.33±0.00 0.012±0.00
R6 Merlot 2 2012 1.95±0.00 0.06±0.00 0.46±0.01 0.10±0.01 0.36±0.01 0.011±0.00
R7 Vranec 4 2012 1.27±0.01 0.88±0.00 0.12±0.01 0.08±0.01 0.51±0.01 0.009±0.00
R8 Vranec 5 2013 1.47±0.01 0.03±0.01 0.38±0.01 0.06±0.00 0.21±0.01 0.011±0.00
R9 Vranec 6 2013 1.74±0.01 0.20±0.00 0.28±0.01 0.11±0.01 0.50±0.01 0.009±0.00
R10 Merlot 3 2013 1.56±0.00 0.06±0.00 0.34±0.01 0.08±0.01 0.37±0.01 0.009±0.00
Average 1.75±±0.01 0.16±0.00 0.51±0.01 0.11±0.01 0.33±0.01 0.013±0.00
In general, the analyzed wines contained or-ganic acids in amounts that are mostly related to the varieties, but also to some extent to the applied vinification procedures. Furthermore, the acid con-tents were high enough to ensure an appropriate acidity of wines, which is necessary for their chemical and microbiological stability, and espe-cially important for the sensorial characteristics and aging of wines. The obtained results for the organic acids in Macedonian wines were similar to those of previous studies published for Slovenian and Greek white and red wines [5, 8, 14], as well as for Port wines [15] and Brazilian wines [16].
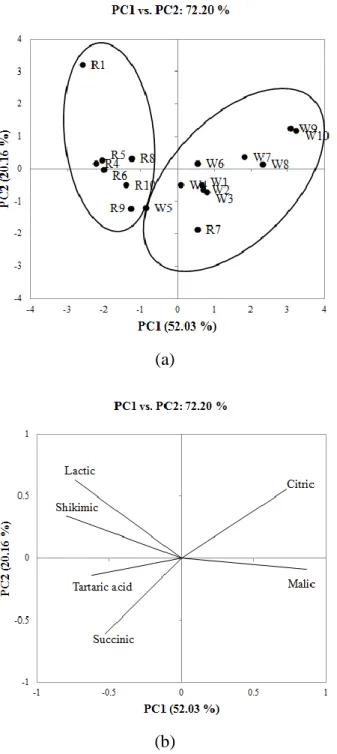
3.4. Principal component analysis
Principal component analysis was used to study the contribution of each parameter (organic acid content) on the clustering among the wines. Projection of the wines on the first two principal components (explained variability of 72.20%)
(a)
(b)
Fig. 4. Principal component score plot (a) and correlation scatterplots (b) of the variables with PC1 and PC2 based on the organic acids determined by HPLC for various white
and red wines.
4. CONCLUSIONS
The established HPLC method presented good separation and enabled appropriate determi-nation of the main organic acids in wine in a rela-tively short analysis time (less than 10 min). The best separation of organic acids was achieved with Supelco LiChrosorb RP-18 column, presenting satisfactory resolution between malic and shikimic acid, that were closely eluting or co-eluting when
other HPLC columns were used. The wine pre-treatment involved a simple SPE method, which allowed for the successful elimination of the ma-trix components, resulting with good recoveries for all analytes. Good linearity, sensitivity, precision and accuracy of the method confirmed its suitabil-ity for analysis of organic acids in red and white wines. The optimized and validated method was applied on determination of organic acids in Mac-edonian wines, observing differences in the content that can be attributed mainly to varietal character-istics and also to vinification practices
.
Acknowledgment. This research is based upon work supported by the Ministry of Education and Science of the Republic of Macedonia under the bilateral project titled: “Biogenic aminies and aroma in Vranec wines from Macedonia and Montenegro and effect of malolactic fermentation on their formation”, which is gratefully acknowl-edged.
REFERENCES
[1] J. H. Swiegers, P. J. Chambers, I. S. Pretorius, Olfaction and taste: Human perception, physiology and genetics.
Australian Journal of Grape and Wine Research, 11, 109–113 (2005).
[2] P. Ribґereau-Gayon, Y. Glories, A. Maujean, D. Dubourdieu, Handbook of Enology, The Chemistry of Wine and Stabilization and Treatments, Volume 2. John Wiley & Sons, Ltd. (2006).
[3] T. Henick-Kling, Control of malolactic fermentations in wine: energetics, flavor modification and methods of starter culture preparation. Journal of Applied Bacteriol-ogy, 79, 29–37 (1995).
[4] C. Tessini, C. Mardones, L. Rivas, D. von Baer, Measurement uncertainty of shikimic acid in red wines produced in Chile. Accreditation and Quality Assurance, 14, 381–387 (2009).
[5] C. Mardones, A. Hitschfeld, A Contreras, K. Lepe, L. Gutiérrez, D. von Baer, Comparison of shikimic acid de-termination by capillary zone electrophoresis with direct and indirect detection with liquid chromatography for varietal differentiation of red wines. Journal of Chroma-tography A,285–292 (2005).
[6] A. Schneider, V. Gerbi, M. Redoglia, A Rapid HPLC Method for Separation and Determination of Major Organic Acids in Grape Musts and Wines. American Journal of Enology and Viticulture,38,151–155 (1987). [7] D. Tusseau, C. Benoit, Routine high-performance liquid
chromatographic determination of carboxylic acids in wines and Champagne. Journal of Chromatography, 395, 323–333 (1987).
[9] M. Kordiš-Krpež, V. Abram, M. Kač, S. Ferjančič, De-termination of Organic Acids in White Wines by RP-HPLC. Food Technology and Biotechnology, 39, 93–99 (2001).
[10] I. Mato, S. Suarez-Luque, J. Huidobro, Review of the analytical methods to determine organic acid in grape juices and wines. Food Research International, 38, 1175–1188 (2005).
[11] A. Hakan Aktas, S. Sen, M. Yilmazer, E. Cubuk, Determination of Carboxylic Acids in Apple Juice by RP HPLC, Iranian Journal of Chemistry and Chemical Engineering, 24, 1–6 (2005).
[12] C. R. Davis, D. Wibowo, G. H. Fleet, T. H. Lee, Properties of wine lactic acid bacteria: their potential oenological significance. American Journal of Enology and Viticulture, 39, 137–142 (1988).
[13] Official Gazette of Republic of Macedonia, No. 50, 2010.
[14] A. Zotu, Z. Lokou, O. Karava, Method Development for the Determination of Seven Organic Acids in Wines by Reversed-Phase High Performance Liquid Chromatog-raphy. Chromatographia, 60, 39–44 (2004).
[15] V. I. Esteves, S. S. F. Lima, D. L. D. Lima, A. C. Du-arte, Using capillary electrophoresis for the determina-tionof organic acids in Port wine. Analytica Chimica Ac-ta, 513, 163–167 (2004).
[16] R. G. Peres, E. P. Moraes, G. A. Micke, F. G. Tonin, M. F. M. Tavares, D. B. Rodriguez-Amaya, Rapid method for the determination of organic acids in wine by capillary electrophoresis with indirect UV detection,