PSYCHOBEHAVIORAL FACTORS, ARTERIAL STIFFNESS, AND BLOOD PRESSURE IN KOREAN AMERICANS
Jeongok G. Logan
A dissertation submitted to the faculty of the University of North Carolina at Chapel Hill in partial fulfillment of the requirements for the degree Doctor of Philosophy in the School of Nursing.
Chapel Hill 2011
Approved by:
Debra J. Barksdale, Chair Joanne Harrell
John Carlson Mi Ja Kim Barbara Carlson
iii ABSTRACT
JEONGOK G. LOGAN: Psychobehavioral Factors, Arterial Stiffness, and Blood Pressure in Korean Americans
(Under the direction of Debra J. Barksdale)
High levels of psychological stress and a high prevalence of hypertension (HTN) have been reported in Korean Americans (KAs). Immigration may be one source of stress which contributes to HTN in KAs. Arterial stiffness is another cardiovascular condition which is also related to both stress and hypertension. Traditionally, arterial stiffness was viewed as the result of HTN, but longitudinal studies have shown that arterial stiffness may itself predict progression of HTN in non-hypertensive people. Thus, this study explored the associations among stressors (acculturation and time in the U.S.), psychobehavioral responses (psychological stress, chronic active coping, and stress emotions of anger, anxiety, and depression), and physiological responses (blood pressure and arterial stiffness) in KAs.
iv
Age and mean arterial pressure (MAP) were the major determinants of arterial stiffness as measured by carotid-femoral pulse wave velocity (cfPWV) and augmentation index adjusted at heart rate 75 (AI_75). When age and MAP were controlled, state anger and state & trait anxiety significantly and independently predicted levels of cfPWV. Women had a significantly higher AI_75 than men. Perceived stress significantly predicted AI_75 after controlling age, MAP, and gender. Anger, anxiety, and perceived stress were related to arterial stiffness but not BP. Age was an independent predictor of cfPWV but not of BP; thus, age-associated increases in BP reported in previous studies may actually be the effect of age-associated increases and related effects of PWV on BP. More studies are needed to compare psychobehavioral factors and arterial stiffness in KAs and other racial groups, and to explore specific mechanisms by which
v
ACKNOWLEDGEMENTS
I would like to acknowledge and express my sincere gratitude to those who have supported and helped me during my doctoral program.
vi
I am also very grateful to those in the Biobehavioral Laboratory, Dr. Virginia Neelong and Brant Nix, for all their help. It was a pleasure to work with them and they contributed greatly to my doctoral study in biobehavioral research.
I would also like to thank all of my friends and church members who made my days so rich. Thanks to my family members in Morganton and Korea for always being beside me giving infinite support and love. Thanks especially to my husband, John Logan who is so patient and loving and was always there to share my struggles and celebrations.
Most importantly, my doctoral program was a journey to meet my Lord and be closer to Him. He is so faithful and His love is so real. I am incredibly blessed that He placed all these people in my life.
vii
TABLE OF CONTENTS
LIST OF TABLES……….……….……….………..….………..…….xii
LIST OF FIGURES……….……….……….………..….…………....…xiv
CHAPTER I. INTRODUCTION……….……….……….….………….….…….….……….……1
Significance of the Problem……….………...……….…....…..………1
Purpose of the Study……….………...………6
Overview of Conceptual Model and Variables………….……….………..…7
Research Questions……….………..……….…...…..………8
II. LITERATURE REVIEW……….……….………..………..………...……9
Psychological Stressors……….………...…..………..…....………9
Low acculturation status as a significant psychological stressor…….………...……9
Immigration and hypertension ……….……….……….11
Psychobehavioral Stress Responses………...………...………13
Psychological stress…...…….…….………..………….………...……….……13
Stress emotions; anger, anxiety, and depression ……….……14
Anger……….……….……….……...16
Anxiety ……….……….……….………...………...17
viii
John Henryism chronic active coping……...……….……….…20
Physiological Stress Response……...……….……….……....…....………...…….23
Arterial stiffness, hypertension, and cardiovascular disease…….………23
Arterial stiffness and altered wave reflection…….……….………..………25
The Relations among Psychobehavioral and Physiological Stress Responses…...…27
Perceived stress and arterial stiffness …..………..……….…27
Stress emotions and arterial stiffness………....……….…..….……….….….29
Chronic active coping and arterial stiffness……….……...………..…...……..30
Psychological Problems and Hypertension in Korean Americans….………...……..31
III. METHODS………..……....34
Research Design……….……….……….34
Subjects and Setting……….……...…………..34
Measures……….……….…..…………....36
Stressors………...………..38
Acculturation……...……….………….………...………...38
Time in the U.S. ……….……….……….………..……...…..39
Psychobehavioral responses…..…………..………..………..39
Psychological stress……...……….………..……….………...39
Stress emotions ….……….……….………...….…………..41
Chronic active coping .……….….…………..………..……..42
Physiological responses…....……….………….………..………43
Arterial stiffness…….……….……….………43
ix
Stressors, personal factors, and control factors……….……….……….……..46
Time in the U.S., age, gender ,socioeconomic status, and smoking……....46
Procedures……….………...……….…46
Data analysis……….………..…...48
IV. RESULTS……….51
Descriptive Results of Variables……..…………..………..…….……….….51
Research Questions……….……….…..………..…..55
Question 1. Acculturation and time in the U.S….………..………...….…..…...55
Question 2. The associations among psychobehavioral responses ……..….…….56
Question 3. The associations among physiological responses ………...…...…..60
Question 4. Factors associated with arterial stiffness………..…….61
Question 5. Factors associated with blood pressure.………..………….…….….72
V. DISCUSSION……….………...………80
Introduction………...………..………..……….80
Acculturation and Time in the U.S.……….……….….………...……….80
Psychobehavioral Responses.…………..………..……….………..…….………….82
Physiological Responses………...……….…85
Systolic & diastolic blood pressure………..…….….85
Carotid-femoral pulse wave velocity………...……….…85
Augmentation index adjusted at heart rate 75………87
Systolic & diastolic blood pressure and arterial stiffness……….…...………..…87
Factors for Carotid-Femoral Pulse wave velocity………..…...….…88
x
MAP as a predictor of cfPWV………...………...………89
Anger as a predictor of cfPWV………90
Anxiety as a predictor of cfPWV……….………..…91
Factors for Augmentation Index adjusted at Heart Rate 75……….………...…93
Gender as a predictor of AI_75……….……….……….………93
Age as a predictor of AI_75………...……….………...……94
MAP as a predictor of AI_75………...……….95
Perceived stress as a predictor of AI_75……….….……….96
Factors for Systolic Blood Pressure and Diastolic Blood Pressure .……...……….97
PWV as a predictor of SBP and DBP………...…97
Gender as a predictor of SBP and DBP………..…………...98
Education as a predictor of SBP and DBP………..………99
Limitations in the Current Study………..………..………...100
Conclusion………...………...…102
Implication for Clinical Practice………..………...…103
Directions for Future Research……….…………...…...…104
APPENDICES1……….………..……...….106
Appendix A: Conceptual framework with variable IDs………...…...…106
Appendix B: Demographic Information Form.……….……….………...107
Appendix C: Bidimentional Acculturation Scale……..……….………..111
Appendix D: Perceived Stress Scale ……….……….………...115
Appendix E: Acculturative Stress Scale……..……….………..……….………...117
1
xi
xii
LTST OF TABLES Table
1. Subject Inclusion and Exclusion Criteria……….….…………...….36
2. Variables and Measurements…….……….………...…..38
3. Descriptive Statistics for Personal Factors………....……53
4. Descriptive Statistics for Stressors and Psychobehavioral Responses……...…...…54
5. Descriptive Statistics for Physiological Responses…..……….……..……54
6. Correlations among Psychobehavioral Stress Responses…..…………..………….….….57
7. Prior Factor Analysis and Squared Multiple Correlations……....……….………….59
8. Eigenvalue Results…..………...………..……59
9. Factor Loading Matrix………..………...…….60
10. Final Communality Estimates….………..………...60
11. Correlation among Physiological Variables..……..………...61
12. Correlation of Arterial Stiffness and BP with All Other Variables…………..…....63
13. Multiple Regression Results for model 1 Predicting PWV………...….….64
14. Multiple Regression Results for Simplified Model 1 Predicting PWV..…..……65
15. Multiple Regression Results for Model 2 Predicting PWV……….………....…..65
16. Multiple Regression Results for Model 3 Predicting PWV……..……….…..…..66
17. Multiple Regression Results for Simplified Model 3 Predicting PWV………….67
18. Multiple Regression Results for Model 4 Predicting PWV……….…………....……..67
19. Multiple Regression Results for Simplified Model 4 Predicting PWV………...68
20. Multiple Regression Results for Model 1 Predicting AI_75……….………....…69
xiii
22. Multiple Regression Results for Model 2 Predicting AI_75.…… ………..……..…...70
23. Multiple Regression Results for Simplified Model 2 Predicting AI_75..….…...71 24. Multiple Regression Results for Model 1 Predicting SBP………..…….………...73 25. Multiple Regression Results for Simplified Model 1 Predicting SBP…………...74 26. Multiple Regression Results for More Simplified Model 1 Predicting SBP….75 27. Multiple Regression Results for model 2 Predicting SBP..………..………...75
28. Multiple Regression Results for model 1 Predicting DBP.……… ………76
29. Multiple Regression Results for simplified model 1 Predicting DBP..…….….…77
30. Multiple Regression Results for More Simplified Model1 Predicting DBP.…78
xiv
LTST OF FIGURES Figure
CHAPTER I INTRODUCTION
Significance of the Problem
Cardiovascular disease (CVD) is a major health problem and the leading cause of death in the United States. An estimated 81,100,000 American adults (more than 1 in 3) have one or more types of CVD. In 2006 alone, 831,272 people died of CVD, which was 34.3% of all deaths or one of every 2.9 deaths in the U.S. (Lloyd-Jones et al., 2010). Considering that 569,490 deaths from all kinds of cancer are projected to occur in the U.S. in 2010 (Jemal, Siegel, Xu, & Ward, 2010), the severity of the problem posed by CVD is easily recognized.
2
Traditionally, it was believed that arterial stiffness was attributable to elevated blood pressure (BP) or hypertension (Franklin, 2005; Risler, Cruzado, & Miatello, 2005). However, population-based longitudinal studies have shown that arterial stiffness may itself predict progression to hypertension in nonhypertensive subjects (Dernellis &
Panaretou, 2005; Liao et al., 1999). Arterial stiffness is characterized by decreased elastin and increased collagen fibers in arteries (Levy, Pappano, & Berne, 2007). The change of elastic properties in arteries causes disorders in arterial function. For example, left ventricular ejection initiates an arterial pressure wave, and the pulse wave is reflected back toward the ascending aorta when it meets arterial walls. However, stiffened arterial walls cause a fast reflection of the pulse wave, boosting pressure during systole and therefore, increasing the left ventricular load (Barksdale & Logan, 2009; Hamilton, Lockhart, Quinn, & McVeigh, 2007). In this regard, it is not surprising that arterial stiffness has also been identified as an independent marker of cardiovascular morbidity and mortality (Cohn, Duprez, & Grandits, 2005; Laurent et al., 2006). Indeed, arterial stiffness is recognized as an independent predictor of hypertension (Dernellis & Panaretou, 2005) as well as a marker for increased CVD risk (Cernes, Zimlichman, & Shargorodsky, 2008; Laurent & Boutouyrie, 2007), including myocardial infarction (Matsuoka et al., 2005), heart failure (Gradman & Alfayoumi, 2006), cognitive
impairment (Scuteri, Brancati, Gianni, Assisi, & Volpe, 2005) and renal diseases (Taal, Sigrist, Fakis, Fluck, & McIntyre, 2007).
3
psychobehavioral factors have long been of interest as risk factors for hypertension. Literature has been accumulating on the relationship of psychological stress, stress emotions, and coping to hypertension.
Psychological Stress. When an external stressor is appraised as harmful, challenging, or threatening (Lazarus & Folkman, 1984), this perceived psychological stress is thought to contribute to elevated BP. If the condition persists, the psychological stress may contribute to the development of hypertension (Larkin, 2005) and other CVD (McCarron, Smith, Okasha, & McEwen, 2000).
Stress Emotions. The stress model of Lazarus and Folkman (1984) indicates that appraisal and coping lead to short term outcomes including emotional responses; thus, emotions should be evaluated to better understand a person‟s response to perceived stress. Among stress emotions defined by Lazarus (1999), anger, anxiety, and depression have been frequently investigated as risk factors for CVD (Bleil, Gianaros, Jennings, Flory, & Manuck, 2008; Rozanski, Blumenthal, & Kaplan, 1999; Suls & Bunde, 2005).
Population-based longitudinal studies have shown that trait anger has been associated with increased risk of progressing to hypertension, incident coronary heart disease (Player, King, Mainous, & Geesey, 2007) and total mortality (Eaker, Sullivan, Kelly-Hayes, D'Agostino, & Benjamin, 2004; Player et al., 2007). A large number of studies report that anxiety poses a strong risk for coronary artery disease (CAD) (Vural, Satiroglu, Akbas, Goksel, & Karabay, 2007) and myocardial infarction (MI) or death among
4
that depression is linked to high prevalence of coronary heart disease (CHD) and hypertension (Artinian, Washington, Flack, Hockman, & Jen, 2006; Herbst, Pietrzak, Wagner, White, & Petry, 2007). However, there is some evidence that depression is negatively associated with BP (Lenoir et al., 2008; Licht et al., 2009). Therefore, there are conflicting results on the role of stress emotions including anxiety and depression in the development of hypertension.
Coping. The association between perceived stress and disease can be modified by the coping characteristics of the individual and by social support from family and friends (Folkman & Moskowitz, 2004). Chronic active coping, which is defined as a strong predisposition to confront daily psychosocial stressors in an active and effortful manner (James, Hartnett, & Kalsbeek, 1983), has been associated with high BP and increased heart rate responses (Smith, Ruiz, & Uchino, 2000). In particular, when chronic active coping is combined with limited psychosocial and socioeconomic resources (e.g.
education and income), it may result in a greater risk for hypertension and CVD (Merritt, Bennett, Williams, Sollers, & Thayer, 2004).
Although psychobehavioral factors including stress, emotions, and coping have long been implicated in the development of hypertension, the exact pathways by which psychobehavioral factors contribute to the development of hypertension are still not clear. Therefore, the investigation of the association between these psychobehavioral factors and arterial stiffness may provide important information to elucidate these inconsistent links.
5
arterial stiffness. No studies have examined these relationships in Korean Americans, the fifth largest Asian populations in the U.S. (Reeves & Bennett, 2004).
Studies on the health of Korean Americans are limited. Nevertheless, a study among 761 Korean Americans aged 18 to 89 years revealed a high prevalence of hypertension (32%) (Kim, Kim, Juon, & Hill, 2000), higher than the prevalence of hypertension in Koreans in Korea (21.8% for all ages, and 26.1% in those aged 30 and older [KNSO, 2001]). Factors that contribute to the increased prevalence of hypertension in Korean Americans have not been systematically examined. However, international immigration, which is considered one of the most significant stressful life events (Shen & Takeuchi, 2001), may be a source of psychological stress that increases the risk of
hypertension. Actually, several studies have reported that Korean Americans may experience high levels of emotional distress from adapting to the social, cultural, and economic norms of American society (Chun, Knight, & Youn, 2007; Kim, Han, Shin, Kim, & Lee, 2005; Koh, 1998; Kuo, 1984; Saint Arnault & Kim, 2008; Shin, 1993). In addition, psychological problems related to anger and depression are reported to be common in elderly Korean immigrants (Han, Kim, Lee, Pistulka, & Kim, 2007; Jang, Kim, & Chiriboga, 2005; Lin et al., 1992). Thus, Korean Americans are a vulnerable population at high risk for psychological problems, arterial stiffness and hypertension.
Therefore, this study is intended to explore the relationships among the
6 Purpose of the Study
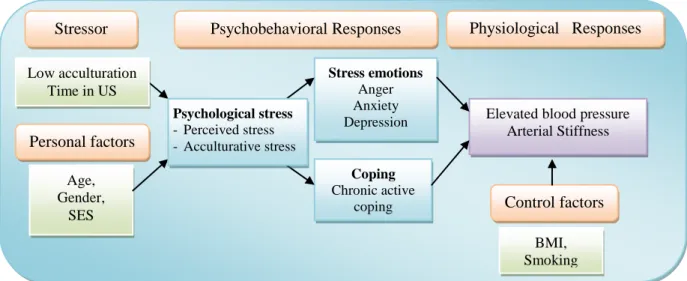
The purpose of the study was to investigate the associations among stressors (acculturation and time in the U.S.), psychobehavioral responses (psychological stress – perceived stress and acculturative stress, chronic active coping, and stress emotions - anger, anxiety, and depression), and physiological responses (BP and arterial stiffness) in Korean Americans.
Figure 1. Conceptual Framework Low acculturation
Time in US
Stressor Psychobehavioral Responses Physiological Responses
Stress emotions
Anger Anxiety Depression
Coping
Chronic active coping
Elevated blood pressure Arterial Stiffness
Age, Gender,
SES
BMI, Smoking Personal factors
Control factors
Psychological stress
7 Overview of Conceptual Model and Variables
The conceptual model for this study consists of five parts: stressors, personal factors, psychobehavioral responses, physiological responses, and control factors (See Figure 1).
Stressors were defined by low acculturation which is considered a very significant stressor for immigrants (Claassen, Ascoli, Berhe, & Priebe, 2005; Fazel, Wheeler, & Danesh, 2005) and time in the U.S. A shorter time in the U.S. is considered a stronger stressor (Steffen, Smith, Larson, & Butler, 2006). The response to stressors can be
influenced by many personal factors. This study included the personal factors age, gender, and socio-economic status (SES). These are believed to influence psychobehavioral and physiological responses to stressors.
Once an individual appraises or perceives an experience as stressful,
8
coping, one of the coping strategies related to the development of hypertension, will be examined as a behavioral component of psychobehavioral responses.
Physiological responses will include elevated BP and arterial stiffness which may lead individuals to develop hypertension. Smoking and body mass index (BMI), well known independent CVD risk factors, are control factors.
Research Questions
In Korean Americans who were born in Korea and have been in the U.S. at least one year;
Question 1. How does acculturation relate to time in the U.S.?
Question 2. What are the associations among the psychobehavioral responses of psychological stress (perceived stress and acculturative stress), emotions (anger, anxiety, or depression), and chronic active coping?
Question 3. What is the relationship between blood pressure and arterial stiffness? Question 4. How much of the variance in arterial stiffness is explained by stressors
(acculturation and time in the U.S.), psychological stress (perceived stress and acculturative stress), chronic active coping, and stress emotions (anger, anxiety, or depression), controlling for BP, age, gender, SES, BMI, and smoking?
CHAPTER II
LITERATURE REVIEW Psychological Stressors
Low acculturation as a significant psychological stressor.
Life involves numerous events which require adaptation. According to life span theories, both normative and nonnormative events are encountered in one‟s life (Baltes, Staudinger, & Lindenberger, 1999). While normative events are predictable and often connected with a biological change of life (e.g., puberty, parenthood, or death of spouse), nonnormative events are less predictable and less prevalent (Laosa, 1997). Immigration is often considered a profound nonnormative life event and requires extensive adaptation (Claassen et al., 2005; Fazel et al., 2005). Immigration usually entails many stressors including loss of intimate relationship with family or friends, language barriers, discrimination, financial strain, different physical environment, unfamiliar culture in social relationship, or non availability of familiar food. The extent to which immigrants adjust or adapt to a different culture is explained by acculturation. Specifically,
10
Kang, 2006). It was also reported that less time of residence in the U.S. related to more life stresses (Mills & Henretta, 2001)
The experience of acculturation can be different in its extent and impact among various racial/ethnic groups. For example, European immigrants who have lived in a society where people are encouraged to express their own goals and desires may have less difficulty with acculturating to the American society than Asian immigrants who have lived in a culture where familial or societal goals are prioritized over an individual‟s goal. The more new or unfamiliar environments one encounters, the more difficult their acculturation process would be; thus, more adaptation efforts may be required. Actually, many studies show ethnic differences in psychological stress, emotional and biological responses. Kim (2008) investigated cultural differences in the psychological and biological effects of verbalization of thoughts. In that study, a visual pattern
discrimination game was given as a task. When a difficult task was given, verbalization of thoughts impaired East Asians or East Asian Americans‟ performance of the task. However, verbalization of thoughts had a neutral or positive effect on performance in European Americans. Furthermore, verbalization decreased the cortisol response to the task in European Americans but not in East Asian Americans. This study demonstrated that the same task could lead to different psychological and biological responses in people from different cultures (Kim, 2008). Lee et al. (2006) compared 45 Asian
11
anxiety, self-construals, and depression in 348 college students (183 White American and 165 Asian Americans) and reported that Asian Americans had significantly higher social anxiety and depression than White Americans (Okazaki, 1997). Despite increasing
evidence that Asian Americans have difficulties with acculturation, few studies have been conducted to explore acculturation in Korean Americans.
Given the literatures showing cultural difference in psychological stress and stress responses, it is important to study how low acculturation, a significant life stressor, plays a role in psychological and physiological health in Asian minority populations who seem to be more vulnerable to the life event of immigration to the U.S.
Immigration and hypertension.
The effect of immigration to a foreign country on blood pressure (BP) has been investigated by researchers. One meta-analytic study investigated the association between stress from immigration and BP in 125 relevant research manuscripts (Steffen et al., 2006). The authors reported that the overall strength of the relationships (effect size) between stress and BP was 0.28 for systolic BP and 0.30 for diastolic BP, with increasing stress related to higher BP. These large effect sizes are similar to those of other well known risk factors such as diet and physical activity. A more interesting finding is that the change in BP caused by immigration was not related to body mass index (BMI) or cholesterol, but instead, it was related to the length of residence in the new country. The largest effect sizes were observed during the initial entry period and then decreased rapidly within the first few years. Another study followed 53 male Ethiopians (on average 21 years old) who immigrated from Ethiopia to Israel, and showed that their BP
12
BP rose 9 mmHg), without any change in BMI and triceps‟ skinfold (Bursztyn & Raz, 1995).
Immigration is also associated with other CVD risk factors including
hyperlipidemia, BMI, sedentary life style, smoking (Patel et al., 2006), and intima-media thickness of the carotid artery (Lear, Humphries, Hage-Moussa, Chockalingam, & Mancini, 2009). Whereas BP may be most increased within the first few years, other CVD risk factors seem to continuously increase over time since immigration. For example, the 2002 National Health Interview Survey (NHIS) of 5,230 immigrant adults found that a longer length of residence in the U.S. was associated with increased
incidence of multiple CVD risk factors, including obesity, hyperlipidemia, and cigarette smoking even after adjusting for relevant confounding factors (Koya & Egede, 2007). Lear et al. (2009) investigated sub-clinical atherosclerosis measured by intima-media thickness in a total of 460 immigrants and 158 non-immigrants of Chinese, European, and South Asian without pre-diagnosed CVD. This study revealed that time since immigration was significantly associated with intima-media thickness after adjustment for age, sex, ethnicity, income, education, family history of CVD, diabetes, smoking, physical activity, BMI, visceral adipose tissue, lipids, insulin, glucose and BP. There was a 2% increase in intima-media thickness for every ten years after immigration in addition to the 7% increase in intima-media thickness for every 10 years of age (Lear et al., 2009).
13
relationship of time in the U.S. and BP in understudied immigrants such as Korean Americans.
Psychobehavioral Stress Responses
For this study, the psychobehavioral responses to stressors selected as possible risk factors for arterial stiffness and elevated BP are psychological stress, coping, and stress emotions (anger, anxiety, or depression). These psychobehavioral factors are also main components of the stress and coping model of Lazarus and Folkman (1984) and his extended work on stress and emotion (Lazarus, 1999). Studies that will be discussed indicated that these cognitive, behavioral and emotional stress responses predict (or are associated with) the development of hypertension and other cardiovascular diseases.
Psychological stress.
In studies on the effects of stress on health, the term „stress‟ has varying
14
ongoing life circumstances and to stress concerning expected future events (Cohen, Kamarck, & Mermelstein, 1983).
A large number of studies have supported that psychological stress may have an important role in the etiology and progression of hypertension. One systematic review of cohort and case control studies reported that 5 out of 7 studies found a significant and positive association between measures of chronic stress and hypertension with risk ratio ranging from 0.8 to 11.1 (Sparrenberger et al., 2009). Recently population-based
longitudinal studies revealed that the incident of hypertension was significantly related to perceived stress from racism (Cozier et al., 2006), life stress such as fire accident (Dorn, Yzermans, Guijt, & van der Zee, 2007), and stress from financial strain (Steptoe, Brydon, & Kunz-Ebrecht, 2005).
It is becoming more apparent that many systems, organs, and mechanisms are responsible in the link between stress and elevated BP. Physiological responses to stress may start in the brain and influence the autonomic nervous system, the neuroendocrine system, immune system, rennin-angiotensin-aldosterone system, volume regulation mechanism, vascular remodeling, and baroreceptor reflex mechanisms (Larkin, 2005). Since several regulators are involved, the relationship between psychological stress and hypertension is not direct, but involves many intervening factors (Larkin, 2005). More studies are needed to further explore how psychological stress is associated with
cardiovascular stress response, such as arterial stiffness, which may play a causal role in the development of hypertension.
Stress emotions; anger, anxiety, and depression.
15
coping result in immediate effects including emotional and physiological changes. Some researchers who focus on the physiological response of stress have challenged the notion that the appraisal mechanism results in emotional reactions. Zautra (2003) reasoned that emotions occur too quickly to require appraisals (Zautra, 2003). Zajonc (1980) also asserted that emotions have meaning and purpose, which are independent of, or unrelated to what we think. However, Clore et al. (2001) suggest that the relationship between appraisal and everyday emotion may be similar to that between the rules of syntax and everyday speech. When people speak very fast, sometimes speech is outside the rules of syntax but still based on the rules. The emotion of fear is often mentioned as the example of how quickly individuals react to fear-producing stimuli before they are aware that they are afraid. Fear, which is necessary to protect individuals from various harm in their lives, is considered to be formulated through the process of appraisal in daily experiences, and also be retrieved through the same process either consciously or unconsciously. In this regard, emotions are thought to require either a conscious or unconscious appraisal process, regardless of the time it takes.
Emotion affects all aspects of health through physiological responses (Lazarus, 1999). Therefore, exploring the relationships of emotion with physiological responses may provide helpful information to understand the effect of stressors on the development of hypertension. Emotions have both a state and a trait component. State emotions fluctuate from time to time, while trait emotion represents stable individual
predispositions to certain states (Diener & Emmons, 1984). Since substantial differences exist among people in the frequency and the intensity with which emotions are
16
emotion, and both state and trait emotion should be included in measures of psychological stress (Spielberger, 1985).
Stress emotions, defined by Lazarus (1999), include anger, envy, jealousy, anxiety, fright, guilt, shame, and sadness. Among these stress emotions, anger, anxiety, and depression which is often described as prolonged sadness have been most frequently investigated as risk factors for hypertension and other CVD (Bleil et al., 2008; Rozanski et al., 1999; Suls & Bunde, 2005) and are included in this study.
Anger.
17
years (Eaker et al., 2004). In that study, anger measured by trait anger, symptoms of anger, hostility, and anger expression significantly predicted the development of arterial fibrillation. Given the strong evidence that anger is related to risk for hypertension and CVD, more studies should be conducted to further explore specific mechanisms by which anger is implicated in pathological processes of chronically increased blood pressure, hypertension.
Anxiety.
Anxiety is another emotion that has long been of interest as a risk factor of CVD. Anxiety is described as a vague, diffuse, continuing, and anticipatory state of uneasiness (Lazarus, 1999). The emotion of anxiety is also considered synonymous with
apprehension, unease, concern, and worry (Lazarus, 1999). In studies on anxiety and hypertension, anxiety appears to cause the “white coat effect” during clinic visit,
producing temporary BP elevations (Ogedegbe et al., 2008; Spruill et al., 2007). Studies have also shown that anxiety scores or symptoms are higher in hypertension patients (Han et al., 2008; Vural et al., 2007), and diabetes mellitus and coronary artery disease patients compared with their referents (Vural et al., 2007).
18
Williams, & Myer, 2009). In a study with a 10-20 year supervision period of 2,149 middle-age Russian men, the relative risk of CVD development within five years in men with high level of anxiety compared with men with average level of anxiety was 6.0 times higher for arterial hypertension (AH), 2.5 times higher for myocardial infarction (MI), and 6.4 times higher for stroke. Within 10 and 15 years, relative risk for MI and stroke continuously increased, while within 20 years, relative risk decreased. This longitudinal study demonstrated that high levels of anxiety may predict higher cardiovascular risk in middle-age men (Gafarov, Gromova, Gagulin, Ekimova, & Santrapinskiy, 2007).
On the other hand, one study with 36,530 men and women aged 20-70 years indicated that symptoms of anxiety predicted lower blood pressure 11 years later (Hildrum et al., 2008).
The results of long-term anxiety are not always consistent. Further examination is needed to see how trait anxiety is related to elevated blood pressure (Tjugen, Flaa, & Kjeldsen, 2009) and arterial stiffness which may contribute to the development of hypertension.
Depression.
19
the association between depression and hypertension. In one study with 245 African-American women, those with higher levels of depression had higher diastolic BP
(Artinian et al., 2006). In that study, depression mediated the relationship between stress and higher diastolic BP. A cross-sectional study with 1017 participants aged 12 to 62 years presented evidence for the indirect effect of depression symptoms and hypertension which was mediated through higher level of BMI in both whites and African Americans (Kabir, Whelton, Khan, Gustat, & Chen, 2006).
While a large body of evidence supports the link between depression and CVD, several population-based studies reported conflicting results on the associations between depression and hypertension. The Norwegian Nord-Trndelag Health Study with 60,799 men and women aged 20-89 years presented epidemiological evidence showing
depression was associated with low BP (Hildrum et al., 2007). However, in that study, depression was measured with different instruments at baseline and follow-up (The Anxiety and Depression Symptom Index at basement and The Hospital Anxiety and Depression Scale at follow-up). In addition, different methods were used to measure blood pressure at baseline and follow-up (measured using calibrated mercury manometers with standard cuff size at basement and at follow-up, BP was measured with a Dinamap 845XT based on oscillometry and cuff size was adjusted after measuring the arm
20
depressed individuals had lower BP (Lenoir et al., 2008). Furthermore, one study that examined the relationship between depressive symptom and cardiovascular reactions to psychological stress in 1608 adults reported that depression scores were negatively
associated with systolic BP and heart rate reactions (Carroll, Phillips, Hunt, & Der, 2007). This result is opposite to the expectation that cardiovascular and sympathetic nervous system responses may be exaggerated in depressive subjects. For example, a study with 60 healthy women aged 18-49 reported that the depressive symptom group exhibited higher systolic and diastolic BP, shorter pre-ejection period (as a marker of increased cardiac sympathetic activity), and lower heart rate variability (Light, Kothandapani, & Allen, 1998). In this study, the depressive symptom group also showed greater increases in plasma norepinephrine and higher cardiac output responses with faster heart rate than the control group during a speech task. The association between depression and
hypertension can be multifaceted and bidirectional (Artinian et al., 2006). Investigating the association between depression and arterial stiffness may provide important
information which can be helpful in disentangling their link. John Henryism chronic active coping.
Coping is defined as thoughts and behaviors that people use to manage the internal and external demands of situations that are appraised as stressful (Lazarus & Folkman, 1984). The association between stress and disease can be modified by coping
characteristics of the individual (Coker, Sanderson, Ellison, & Fadden, 2006). In the 2-year longitudinal study by Twisk et al. (1999), the positive relationship between stress (measured as daily hassles) and coronary heart disease risk factors (measured as
21
coping style characterized by strict use of either emotion or problem-focused coping (Twisk, Snel, Kemper, & van Mechelen, 1999).
One coping style related to hypertension, John Henryism active coping is defined as a strong behavioral predisposition to cope with psychosocial environmental stressors in an active, determined, and hard-working manner (James et al., 1983; James, Strogatz, Wing, & Ramsey, 1987). The construct of John Henryism is coined from the story of the American folk-legend of John Henry who worked himself to death to beat a steam engine. He was known for his incredible physical strength and endurance (James et al., 1987). Individuals who are high in John Henryism coping are considered to believe that they can manage daily stressors and accomplish goals through hard work and determination (Wright, Treiber, Davis, & Strong, 1996).
22
resistance. This relationship was more pronounced in those with low socioeconomic status (Wright et al., 1996).
While several studies have identified negative effects of chronic active coping (John Henryism) on the development of hypertension in African Americans with low socio-economic resources (Duijkers, Drijver, Kromhout, & James, 1988; James et al., 1987; Wiist & Flack, 1992), some studies have shown that chronic active coping is adaptive and health promoting (Bonham, Sellers, & Neighbors, 2004; Derogatis, Abeloff, & Melisaratos, 1979; Haritatos, Mahalingam, & James, 2007). For example, one exercise participation study showed that exercise participation was significantly associated with higher levels of John Henryism active coping in 922 low-income pregnant Black women (Orr, James, Garry, Prince, & Newton, 2006). Although studies conducted on minority groups other than African Americans are very limited, one study examined how John Henryism was associated with self-reported physical health among high socio-economic status Asian immigrants (318 Chinese and Indian immigrants aged 18-73) and found that higher John Henryism significantly predicted better self-rated health, physical
functioning (measured by the physical health subscale of the Health Survery Short Form-36) and few somatic symptoms (Haritatos et al., 2007). Although these studies showed chronic active coping may promote health behaviors or self-reported health, it is not clear whether or not chronic active coping also has positive effect on their actual health
23
conducted to examine health implications of John Henryism among different socioeconomic groups of racial/ethnic minorities.
Physiological Stress Response
Arterial Stiffness, hypertension, and cardiovascular disease.
About 73 million adults (33.6%) in the United States have hypertension, a leading cause of cardiovascular morbidity and mortality. The causes of 90-95% of cases of hypertension are unknown (Rosamond et al., 2008; Stergiou & Salgami, 2004). Increasing evidence suggests that arterial stiffness may precede the development of hypertension (Franklin, 2005). A 4-year longitudinal study with 2,512 nonhypertensive subjects, defined as having systolic BP less than 140 mmHg or diastolic BP less than 90 mmHg, showed that aortic stiffness was an independent predictor of progression to hypertension (Dernellis & Panaretou, 2005). A 3.3 year longitudinal study conducted on 6,992 nonhypertensive participants, defined as systolic BP < 160 mmHg or diastolic BP < 95 mmHg, showed that higher arterial stiffness was associated with greater risk of
hypertension, and the relationship was independent of well known risk factors for hypertension and baseline BP (Liao et al., 1999).
24
disease or symptoms were followed for 7.9 years: Aortic stiffness, measured by carotid-femoral PWV, was an independent predictor of fatal stroke even after adjusting for classic CVD risk factors including age, cholesterol, diabetes, smoking, BP, and pulse pressure (PP) (Laurent et al., 2003). A correlation between arterial stiffness and
atherosclerotic plaques was also observed in several studies, including the ARIC study and the Rotterdam study (Qureshi et al., 2007; Riley, Evans, Sharrett, Burke, & Barnes, 1997; van Popele et al., 2001).
Arterial stiffness, measured by pulse wave velocity (PWV) and augmentation index (Alx), is an independent and consistent predictor of left ventricular hypertrophy and the development of left ventricle failure (Tsai, Lin, Huang, Chen, & Chen, 2007). Increased arterial stiffness has been associated with deteriorating glucose tolerance status (Henry et al., 2003), the metabolic syndrome (Saijo, Yoshioka, Fukui, Kawaharada, & Kishi, 2006), end-stage renal disease (Taal et al., 2007), cognitive impairment (Mitchell, 2008; Poels et al., 2007), and retinal arteriolar narrowing (Cheung et al., 2007).
Alterations of the microcirculation in brain, kidney, and retina have been associated with hypertension. However, recent studies on older adults have found that the exposure of small arterioles to high pulsatile pressure caused by arterial stiffness better explains the microvascular damage that leads to renal insufficiency and intellectual deterioration than does mean arterial pressure (MAP) (Fukuhara et al., 2006; Hanon et al., 2005; O'Rourke & Safar, 2005; Safar & Lacolley, 2007; Scuteri et al., 2007).
25
Arterial stiffness and altered wave reflection.
26 hypertension (O'Rourke, 1999).
Determining pulse wave velocity (PWV) is generally accepted as the most simple, noninvasive, robust and reproducible method to measure arterial stiffness (Mackenzie, Wilkinson, & Cockcroft, 2002). PWV can be determined by the distance the pulse travels between two arterial sites divided by pulse transit time, PWV=D(meters)/∆ t(seconds) (Laurent et al., 2006). The wave reflects faster in peripheral arteries, because peripheral arteries are less elastic than proximal arteries, and reflection sites associated with arterial branching are closer (Nichols, McDonald, & O'Rourke, 2005). Carotid-femoral PWV is considered the „gold-standard‟ measurement of arterial stiffness because it is measured along the aortic and aorto-iliac pathway (Laurent et al., 2006), and the thoracic and abdominal aorta make the largest contribution to the arterial buffering function (Laurent et al., 1994).
Pulse wave analysis (PWA) is also widely used to assess arterial stiffness. As noted previously, the pulse pressure
waveform is a composite of the
27
which is expressed as a percentage of pulse pressure (PP). Pulse wave analysis (PWA) is a noninvasive method to generate the ascending aorta pressure wave from the arterial pressure pulse measured in the radial artery by mathematical transformation, using Fourier analysis (Chen et al., 1997). The widely used approach is to apply applanation tonometry containing a high-fidelity micromanometer on the radial arterial site to electronically capture the shape of a peripheral arterial pulse (Pauca, O'Rourke, & Kon, 2001). This is the approach that will be used in the proposed study.
The Relations among Psychobehavioral and Physiological Stress Responses Perceived stress and arterial stiffness.
Perceived stress, which involves neural activation of the brain, is believed to contribute to the development of hypertension and other CVD. The mechanisms by which perceived stress contribute to the development of hypertension may include its effect on the sympathetic nervous system, rennin-angiotensin system, inflammation, cortisol levels, and unhealthy behaviors (Ghiadoni et al., 2000; Rozanski, Blumenthal, Davidson, Saab, & Kubzansky, 2005; Rozanski et al., 1999; Steptoe, Melville, & Ross, 1982). Given the evidence that arterial stiffness may precede hypertension, psychological stress may contribute to arterial stiffness, before hypertension develops. A few studies have examined the relationship between psychological stress and arterial stiffness. For example, Lipman et al. (2002) investigated the relationships among mental stress
28
homeostatic mechanism for maintaining BP, is associated with arterial stiffness (Eveson et al., 2005). Normally, when BP rises, the carotid and aortic sinuses are distended and baroreceptors are activated; this inhibits the sympathetic system, reducing BP (Drew, Bell, & White, 2008). However, low distensibility resulting from stiffened arterial vessels causes a blunted baroreflex so BP remains elevated (Chesterton, Sigrist, Bennett, Taal, & McIntyre, 2005; Pinter, Laszlo, Mersich, Kadar, & Kollai, 2007; Poels et al., 2007). Lipman et al. (2002) suggested that augmented hemodynamic reactions to mental stress may be one example of reduced baroreflex function caused by arterial stiffness.
Vlachopoulos et al. (2006), who assessed the effect of acute mental stress on arterial stiffness in young healthy subjects, found that increased arterial stiffness, induced by a 3-minute mental stress test, was sustained for 60 3-minutes, even after adjusting for changes in mean arterial pressure (Vlachopoulos et al., 2006).
29
Utsugi et al. (2009) also showed that in 4266 local government employees (3,412 men and 854 women) aged 35 years and over, high occupational stress indicated by high demands and low control was associated with increased arterial stiffness only in women, suggesting that job stress associated with a high risk of arterial stiffness may differ by gender (Utsugi et al., 2009). Given the evidence of a positive association between psychological stress and hypertension and the paucity of data on the relationship of psychological stress and arterial stiffness, it is important to further investigate the relationship between psychological stress and arterial stiffness.
Stress emotions and arterial stiffness.
Considering the recent evidence of the deleterious effects of anxiety, depression, and anger emotions on cardiovascular functioning, further studies are needed to examine the role of stress emotions in arterial stiffness. Although research is limited to date, increasing interest is focused on the association of stress emotions (anxiety, depression, and anger) and arterial stiffness.
30
anxiety had significantly higher arterial stiffness measured by brachial-ankle PWV (BaPWV) (Yeragani, Tancer, Seema, Josyula, & Desai, 2006). Midei and Mattews (2009) also reported that 160 Black and White adolescents with higher anxiety had greater arterial stiffness measured by PWV (Midei & Matthews, 2009). One population-based cross-sectional study with 3704 subjects revealed that increased arterial stiffness was significantly related to depressive symptoms and this association was stronger for participants with depressive disorders even after controlling for atherosclerosis risk as measured by presence of plaques in the carotid artery (Tiemeier, Breteler, van Popele, Hofman, & Witteman, 2003). On the other hand, one study on 382 Japanese males aged 24 to 39 years failed to find any significant relations among arterial stiffness and stress emotions including anger, anxiety, and depression (Nakao, Nomura, Karita, Nishikitani, & Yano, 2004).
Further studies to investigate the negative effect of stress emotions such as anxiety, anger, and depression on arterial stiffness may provide important information to clarify the pathophysiological pathway by which stress emotions are associated with increased risks for CVD.
Chronic active coping and arterial stiffness.
31
in relatively understudied population such as immigrants may contribute to better understanding and improving health in racial minorities.
Psychological Problems and Hypertension in Korean Americans
Korean Americans, who are the fifth largest Asian population in the U.S. (Reeves & Bennett, 2004), have the highest uninsured rate (52%) of all ethnicities in the U.S. (Hughes, 2002). Studies on their physiological and psychological health are very limited. Nevertheless, one study revealed a high prevalence of hypertension (32%) in 761 Korean Americans aged 18-89 years (Kim et al., 2000) which is higher than the prevalence of hypertension in Koreans in Korea (21.8% for all ages, and 26.1% in those aged 30 and older) (KNSO, 2001).
The high prevalence of hypertension in Koreans who have immigrated to the United States may be attributed to psychological stress from language inadequacy, loss of ties to family and friends in their home country, discrimination, and lack of social and financial resources (Mui & Kang, 2006). Psychological stress may increase their
susceptibility to illness and contribute to the high prevalence of hypertension seen in this group (Heilemann, Frutos, Lee, & Kury, 2004).
32
Filipinos, or Japanese Americans (Kuo, 1984). Saint-Arnault and Kim (2008), who compared Japanese and Korean undergraduate students in the U.S., reported that Korean students had significantly higher somatic symptoms from emotional distress than
Japanese students (Saint Arnault & Kim, 2008). One study of 472 older Korean Americans (average age of 69.9) reported that 34% of the sample was considered depressed when measured with the Center for Epidemiologic Studies Depression Scale (CES-D) and about 8.5% of the sample had thought about committing suicide at some point in their lives (Jang, Kim, Hansen, & Chiriboga, 2007). This prevalence of
depression is considered very high when compared with another study with 447 Korean elderly people, in which 18.1 % of subjects were considered depressed when measured with CES-D (Cho, Hahm, Jhoo, Bae, & Kwon, 1998).
Culturally formed and shared belief systems or coping patterns may affect people‟s perception of stress and responses to it (Ellsworth, 1994). For example, there is an old Korean proverb that repressing anger is more virtuous than expressing anger. “Hwabyeong,” literally “anger illness” in Korean, is a Korean culture-bound syndrome in response to emotional disturbance (Somers, 1998). This refers to a condition
characterized by passive suffering, and sufferers report such symptoms as palpitation, heavy feeling in the chest, dyspnea, and in severe cases, a feeling of impending death (Lin, 1983). The Diagnostic and Statistical Manual of Mental Disorders (DSM) IV listed Hwabyeong among its culture-bound illnesses (Kwon, Min, & Kim, 2006). Pang (1999) explains that Hwabyeong occurs when distressed emotions are managed in the
33
reported that Korean elderly immigrants have a broad range of symptoms associated with Hwabyeong.
Although Korean Americans seem to be exposed to various sources that may produce a greater risk for hypertension, less is known about what personal factors may produce the higher rates of psychological symptoms, how Korean Americans manage high levels of stress, and how their coping patterns are related to hypertension. More research on psychological stress, coping, and stress emotions in this Korean American population may provide valuable information to better understand their higher prevalence of psychological problems and risk for hypertension.
A few studies have found racial differences in arterial stiffness. Din et al. (2006) compared 20 healthy young South Asian men to 20 age-matched healthy European Caucasian men, and reported that the South Asian men had markedly greater levels of arterial stiffness than the European Caucasians (Din et al., 2006). The Multi-Ethnic Study of Atherosclerosis (MESA) explored aortic distensibility in four ethnic groups (Non-Hispanic white, African American, (Non-Hispanic, and Chinese) and reported that African Americans had the least aortic distensibility (greater arterial stiffness), but the researchers did not report on aortic distensibility for the Chinese subjects (Malayeri et al., 2008).
After an extensive review of the literature, no study has been found that examined arterial stiffness in Korean Americans. In addition, no study was found that explored chronic active coping in Korean Americans and how it is related to psychological stress, stress emotions, and hypertension. Studies on arterial stiffness, hypertension, and
CHAPTER III METHODS Research Design
This was a descriptive, correlational, and cross-sectional study of psychobehavioral factors for hypertension and arterial stiffness in a sample of Korean Americans.
Subjects and Setting
A total of 102 male and female Korean Americans 21-60 years of age were recruited for the study from the Triangle area (Durham, Orange and Wake Counties) of North Carolina (NC). NC saw a 30.71% growth in its Asian population from 2000 to 2006, and Koreans are one of the fastest growing groups of Asian immigrants in the U.S. (U.S. Census Bureau, 2006). For this study, Korean Americans were defined as people who were born in Korea and have lived in the U.S. for at least 1 year. Because the consent form and questionnaires were administered in Korean, only subjects who were able to speak and read Korean were recruited. The ability to use Korean language was important because those who cannot speak and read Korean may have been already acculturated to America. Since language and culture are not separate, but are acquired together (Mitchell and Myles, 2004), people who use only the English language may have different
35
children. Further, the parameters for arterial stiffness have not been standardized in children and the relationship between arterial stiffness and hypertension in children is unknown. Arterial stiffness progressively increases with age and isolated systolic hypertension affects 50% of people over age 60 (McEniery et al., 2008). Therefore, in order to limit arterial stiffness that may be aggravated by age, only adults 21 to 60 years of age were recruited.
36 Table 1
Subject Inclusion and Exclusion Criteria
Inclusion Criteria Exclusion Criteria
- Age 21-60 - Born in Korea
- Lived in the US at least 1 year
- Able to speak and read Korean
- Taking antihypertensive medication or other medications known to affect BP (e.g., β-blockers, thyroid hormones, or steroids)
- Having irregular cardiac rhythm
- Having known cardiac conditions (e.g., pace maker, heart failure, coronary artery disease, myocardial infarction, left ventricular dysfunction, or valvular heart diseases) - Having known vascular conditions (e.g., peripheral
vascular disease or diabetes)
- Taking medications for a major mental disorder such as schizophrenia, depression, or bipolar disorder
Measures
The study measured stressors (acculturation and time in the U.S.), personal factors (age, gender, SES measured by education and household income), psychobehavioral responses (psychological stress operationalized by perceived stress and acculturative stress, chronic active coping, and stress emotions including anger, anxiety, depression), physiological responses (arterial stiffness and BP), and control factors (BMI and smoking) (See Table 2). Measures of arterial stiffness are known to have a circadian pattern and to be maximal in the morning (Bonnemeier et al., 2003; Papaioannou et al., 2006), therefore, all data were collected in the morning between 7 and 11am.
37
Permission to translate PSS into languages other than English was provided through the website of the author of the instrument (Dr. Sheldon Cohen). The investigator received permission for translation of JHAC, STAXI-2 and STAI. She is sensitive to Korean subjects‟ cultural nuances and translated them into Korean. A bilingual native Korean speaker who speaks both Korean and English very fluently reviewed the initially
translated version and translated it back into English. A native English speaker who has a major in English and is not familiar with the scales compared the original scales with the back translated English version of the scales. Based on the results of this comparison, the investigator refined the initially translated Korean version of the scales. These processes were repeated until the original scales were judged equivalent to the back translated English version of the scales by the American professor, who is familiar with the American version of the scales.
38 Table 2
Variables and Measurements
Variables Scale or Index
Stressors
Acculturation Time in the U.S.
Bidimentional acculturation scale (American subscale)
In years
Personal Factor
Age Gender
Social Economic Status (SES)
In years
Male or Female
Education and Household Income
Psychobehavioral Responses
Psychological stress Perceived stress scale (PSS) -10 items Revised social, attitudinal, familial, and
environmental (R-SAFE) acculturative stress scale – 24 items
Chronic active coping John Henryism Active Coping Scale (JHAC12) – 12 items
Stress emotions Anger Anxiety Depression
Spielberger‟s State-Trait Anger
Expression Inventory 2 (STAXI-2) – 57 items
Spielberger State-Trait Anxiety Inventory (STAI) – 40 items
Center for Epidemiological Studies Depression Scale (CES-D) – 20 items Physiological
Responses
Blood Pressure (BP) Arterial Stiffness
Average of two measures of brachial BP Augmentation Index (AI)
Pulse Wave Velocity (PWV)
Control factors Body mass index (BMI) Smoking
Weight (kg) / squared height (m2) 4 items in the demographic form
Stressors.
Acculturation.
Acculturation was measured using the American orientation subscale of
39
(2007) to measure acculturation status for Asian or Korean American older adults who immigrated to the U.S. Although this scale was originally developed for older adults, it includes major aspects of acculturation that are common regardless of age. The subscale of American orientation contains 12 items on English proficiency, frequency of English use, consumption of audiovisual media (e.g., TV or videos), consumption of printed media (e.g., newspaper or magazine), consumption of American food at home,
consumption of American food outside the home, ethnicity of friends, social gathering, sense of belonging, getting along with Americans, familiarity to American culture and custom, and celebration of American holidays. A 4-point Likert scale ranging from 0 (low acculturation) to 3 (high acculturation) is used and total scores were derived from the sum of each item score, with lower scores indicating less adherence or acculturation to the American culture. Internal consistency for this scale was Cronbach‟s alpha .77 in Jang‟s study (2007) and .87 in the present study. In this study, the test-retest reliability of this scale was .93 which is very high.
Time in the U.S.
Time in the U.S. was measured in years. Less time was considered a greater stressor.
Psychobehavioral Responses.
Psychological stress.
Psychological stress was operationalized by perceived stress and acculturative stress.
40
perceived stress that assesses the amount of stress in one‟s life rather than response to a specific stressor, and the items are designed to assess how unpredictable, uncontrollable, and overloaded respondents find their lives (Cohen et al., 1983). A 5-point Likert scale ranging from 0=”never” to 4=”very often” is used and scores are derived from the sum of the item scores, with higher scores indicating greater stress. Possible scores range from 0 to 40. Among the 4, 10, and 14-item versions of the scale, the 10-item version used in this study has shown maximum reliability (Monroe and Kelley, 1995; Cohen, Kessler, & Gordon, 1995). The 10-item Perceived Stress Scale (PSS) has good internal consistency (Cronbach‟s alpha=0.85), test - retest reliability (r=.85) (Cohen et al., 1983), construct validity and predictive validity (Cohen, Tyrrell, & Smith, 1993). In this study, internal consistency was Cronbach‟s alpha 0.83 and test – retest reliability was .79.
41
Chon, Bowen, & Khan, 2005). In the present study, this scale showed good internal consistency (Cronbach‟s alpha .88) and good test – retest reliability (r=.73).
Stress emotions.
Anger. Anger was measured with the 57-item Spielberger‟s State-Trait Anger Expression Inventory 2 (STAXI-2). This 4-point Likert-type scale was developed to assess the intensity of state anger and trait anger and measure the way these two components contribute to pathologic conditions such as hypertension, coronary heart disease, and cancer. The STAXI-2 includes 2 subscales to measure state anger and trait anger. Possible scores for the state anger subscale range from 15 to 60 and possible scores for the subscale of trait anger range from 10 to 40 (Spielberger et al., 1983a). In both subscales, higher scores indicate greater anger. Several recent studies, which have adopted STAXI-2 to examine the relationship between anger and cardiovascular responses, reported that STAXI-2 has good internal consistency reliability with
Cronbach‟s α ranging from .73 to .95 for the total scale scores and from .73 to .93 for the sub-scales (Burns, Quartana, & Bruehl, 2007; Caska et al., 2009; Narita et al., 2007). In this study, the STAXI-2 showed good internal consistency (Cronbach‟s α .95 for the subscale of state anger and .85 for the subscale of trait anger). Its test – retest reliability was .69 for state anger and .66 for trait anger. Although it is odd that state anger has higher test-retest reliability than trait anger, both reliabilities are considered still accepted (Kerlinger & Lee, 2000).
42
(Spielberger et al., 1983b). Total scores obtained from the tool range from 20 to 80 with higher scores indicating greater anxiety. When used as an interval scale, a score between
1 and 20 is evaluated as no anxiety, 21 to 40 as a mild level of anxiety, 41 to 60 as a
moderate level of anxiety, and 61 and higher as a severe level of anxiety. This scale has
been used extensively in practice demonstrating good construct and divergent validity and test– retest reliability (Spielberger et al., 1983b; Oner and Le Comple, 1985). In this study, the internal consistency of STAI was very good (Cronbach‟s α .93 for the state anxiety and .93 for the trait anxiety).
Depression. Depression was assessed with the Center for Epidemiological Studies Depression Scale (CES-D) (Radloff, 1977). This 20-item self-report instrument was developed to assess mood, somatic symptoms, and interpersonal relationships within the last week (Radloff, 1977). This 4-point scale measures the frequency of occurrence, ranging from 0 (rarely or none of the time) to 3 (most or all of the time). The total sum score ranges from 0 to 60 with higher scores indicating greater depressive symptoms (Radloff, 1977). This scale is extremely useful for screening depressed persons, demonstrating its validity (Myers & Weissman, 1980). One study showed that the reliability coefficients (Cronbach‟s α) for the CES-D scores at 18 months, 3, 6, and 10 years were 0.89, 0.90, 0.89, and 0.91, respectively (Seto, Cornelius, Goldschmidt, Morimoto, & Day, 2005). In this study, the internal consistency of the CES-D was Cronbach‟s α = .93. and the test – retest reliability was r = .68.
Chronic active coping.
43
to cope actively and persistently with difficult psychosocial stressors and barriers. According to James et al. (1987), the scale consists of three themes: a commitment to hard work, a determination to achieve one‟s goals, and efficacious mental and physical tenacity. The 5-point Likert scale ranges from 1 = completely false to 5 = completely true, and the total John Henryism score is derived by summing the numerical values for all 12 items; thus, possible scores range from 12 to 60 with higher scores indicating greater active coping. The Cronbach‟s alpha of .76, and .73 have been reported by Haritatos et al. (2007) and Fernander, et al. (2005), respectively. Several authors stated there is no
published study that has reported test-retest reliability of this scale (Fernander et al., 2005; Haritatos et al., 2007). In this study, the internal consistency of JHAC12 was Cronbach‟s alpha of .79 and the test – retest reliability was r = .61.
Physiological Responses.
Arterial stiffness.
Arterial stiffness was measured by carotid-femoral pulse wave velocity (C-F PWV) and augmentation index (AI) from pulse wave analysis (PWA). C-F PWV was obtained noninvasively using the commercially available SphygmoCor system (AtCor medical). Carotid and femoral waveforms were acquired by applying a pressure sensitive transducer (tonometer) on carotid and femoral sites. The transit time of the pulse from the left ventricle (The peak of R wave in electrocardiogram [ECG]) to the carotid artery (t1)
44
on the body using a tape measure. PWV is the difference in the distances from
suprasternal notch to two arterial sites (dpwv) divided by the mean time difference (∆t) in
t1 from t2 (Millasseau, Stewart, Patel, Redwood, & Chowienczyk, 2005) (Figure 3).
Figure 3
Pulse Wave Velocity (PWV) Using SphygmoCor
t1: The time difference between the R wave of ECG and the foot of carotid artery wave form (A)
t2: The time difference between the R wave of ECG and the foot of radial artery wave form (B)
∆t: The mean difference in time between A and B, taking the difference in t1 from t2
dpwv: The difference between d- femoral and d- carotid
45
Therefore, the augmentation index (AI) was adjusted to a heart rate of 75 beats per minutes and was used only to support pulse wave velocity data.
Figure 4
Pulse Wave Analysis (PWA) Using SphygmoCor (Williams et al., 2006)
Blood Pressure.
Blood pressure (BP) is a measure of the force applied to the walls of the arteries as the heart pumps blood through the body. BP is determined by both the force and amount of blood pumped, as well as the size and flexibility of the arteries. Brachial BP was measured using WelchAllyn Vital Signs Monitor 300 Series. Since incorrect cuff size causes error in BP measurement (Pickering et al., 2005), the mid-section
circumference of the dominant upper arm was measured with a tape, and the proper sized cuff was selected according to the upper arm circumference. The bladder of the cuff
T0 : The time at the start of the waveform T1 : Duration from start of the waveform to
the first peak/shoulder (outgoing pressure wave)
T2 : Duration from start of the waveform to the second peak/shoulder (reflected pressure wave)
ED: (ejection duration): duration from start of the waveform to closure of the aortic valve (incisura)
SP: Central aortic systolic pressure DP: Central aortic diastolic pressure P1 : Height difference between the minimum pressure and the pressure at the first peak/shoulder (T1)
∆P : Augmentation, difference between Maximal pressure (central aortic systolic pressure)
and pressure at the fist peak/shoulder (P1 height) PP: Pulse pressure