ISSN: 2231-7716
DOI: http://10.24191/ji.v14i2.240 Copyright © Universiti Teknologi MARA
Programming
Nur Fatihah Fauzi1*, Nurul Asyiqin Supardi2, Rohana Alias3, and Nor Hayati Shafii4
1,2,3,4 Faculty of Computer and Mathematical Sciences, Universiti Teknologi MARA Perlis Branch, 02600 Arau, Perlis, Malaysia
Authors’ Email Address: *1[email protected], 3[email protected], 4[email protected] Received Date: 30 September 2019
Accepted Date: 19 November 2019
ABSTRACT
Humans need to eat good and balanced nutritious diet that provides calories for energy requirements and nutrients for proper growth, repair and maintenance of the body tissue. Today, busy lifestyle habits drastically changed the pattern of eating where students are more likely to have irregular meal times and the cost of food may be expensive for them. Therefore, this study is conducted to find the minimum cost that satisfies the daily nutrient requirements. A linear programming (LP) model and goal programming (GP) model are formulated where the objective function is the total cost of food. Food prices were collected from selected cafés in UiTM Perlis and the recommended daily nutrient intakes of 19-29 years old, male and female were obtained from the Ministry of Health Malaysia. The sample used in this research consists of 10 most frequently consumed food items as decision variables. QM for Windows V5 was used to determine minimum cost that satisfies the nutritional requirements. LP results, the minimum cost for male students is RM9.88 and for female students is RM9.10. Based on the GP results, the cost is RM9.00 for both male and female students. It is evident from the results that GP has achieved the minimum cost and the food basket for male students consists of 410g of rice, 140g of chicken, 42.9g of broccoli and 252.7g of mushroom. Meanwhile, the food basket for female students consists of 429g of rice, 113.4g of chicken, 37.44g of broccoli and 321.3g of mushroom.
Keywords: Linear Programming Model, Goal Programming Model, Minimum Cost, Nutritional requirements, Optimization
INTRODUCTION
Nutrition is the intake of food that is related to the body’s dietary requirements (World Health Organization (WHO), 2018). A good nutrition is an adequate and well-balanced diet that increases immunity, reduces susceptibility to diseases, enhances physical and mental development and also increases productivity. Currently, we are living in an environment that encourages unhealthy eating and less physical activity. According to Sidik & Ahmad (2004) and Poh et al. (2013), many children in developing countries, including Malaysia are facing obesity issue.
231 deliberated total cost of diet planning model for boarding schools in Malaysia is less than RM9.00 per day. Furthermore, based on studies of optimization on nutrition by Pasic et al. (2012) found that women need to spend 3.04km and men need to spend 3.39km to obtain all daily nutrient requirements. Meanwhile, Nykänen et al. (2018) created a list of affordable food basket that fulfill all Ghanaian nutrient recommendations while also helping to reduce risk of diet-related non-communicable disease for low-income families of four. Parlesak et al. (2016) designed a range of cost-minimized health promoting food baskets that could both help to prevent micronutrient inadequacies and to be culturally acceptable for a low-income family.
When it was first proposed in 1947 by the author (in connection with the planning activities of the military), LP and its many extensions have come into wide use. In academic settings, decision scientists (operation researchers and management scientists), as well as numerical analysts, mathematicians and economists have written hundreds of books and numerous number of articles on this subject. Moraes et al. (2012) studied that LP plays an important role in optimization such as maximizing profit, minimizing costs and scheduling. Hasan and Arefin (2017) applied LP to the scheduling problem for large organizations and industries. Their main objective is to minimize the number of workers required to meet all shifts. Numerous researches have been conducted with different purposes such as Stamenkovska et al. (2012), Georgakakos (2012), Maurya et al. (2015) and Akpan and Iwok (2016). Stamenkovska et al. (2012) developed an optimization model to maximize the vegetable production in the Republic of Macedonia to help the decision making on Macedonian family farms. In addition, Georgakakos (2012) formulated a model of water allocation in maximizing the water management operation cost. Meanwhile, Maurya et al. (2015) developed LP to optimize the profit of an Ethiopian chemical company in Adama, Ethiopia. They recommended a viable product-mix to ensure optimum profit for the company. Last but not least, Akpan and Iwok (2016) considered the LP to obtain maximum profit so that the bakery production can be optimized.
GP is a branch of multi-criteria decision analysis. It was first introduced by Charnes et al. in 1955, more explicitly defined by the same author in 1961. There are a lot of researches that has been done by using GP. These include the study in maximizing both production and planted areas of rubber in Malaysia (Hassan et al., 2013), optimizing the production planning of clothing company (Anggraeni et al., 2015), reducing the liability, gain earning, profitability, increase asset accumulation, equity wealth and optimum managements items in the financial statement (Halim et al., 2015) and allocating the work force in order to achieve the objectives related to energy, economic and environmental goals of the United Arab Emirates by the year 2030 (Jayaraman et al., 2015).
Motivated by the above-mentioned studies, this study is focused in finding the minimum cost that meets nutrition needs for students in UiTM Perlis and to compare the LP and GP methods to minimize cost. This study will benefit students to minimize costs of food but meet the daily nutritional requirements. The primary data which is price of food per serving were obtained from randomly selected café in UiTM Perlis namely Apple slice, Bachok, Aisyah, D’Durani Rasa and Selera cafes. While, the secondary data which is nutrition facts of each food per serving and the daily nutrient requirement intake for 19 – 29 years old male and female were obtained from the Ministry of Health Malaysia, Putrajaya.
LP MODEL FORMULATION
232 views, LP problem is a mathematical program in optimizing which is to identify the minimum or maximum point of a linear objective function that satisfies a set of constraints.
LP model consists of an objective and constraints functions.
Objective function: Minimize cost
= = 10 1 j j jX aZ (1)
Where Xj is the quantity of the food item j and aj is the cost of food item j. The food items are rice
( )
X1 , chicken( )
X2 , beef( )
X3 , squid( )
X4 , shrimp( )
X5 , egg( )
X6 , broccoli( )
X7 , cabbage( )
X8 , salad( )
X9 and mushroom( )
X10 .The above objective function is subjected to the constraints:
0 ; 10 1
= j j i jijX c X
b (2)
where bij is the amount of nutrient i in the food item j and ci is the minimum daily requirement of
nutrient i. The constraints are energy, protein, fat, vitamin A, vitamin B1, vitamin B2, vitamin D, vitamin K, calcium, iron, zinc, phosphorus, sodium, potassium and magnesium (refer to Table 1).
An example of the constraint is the energy constraint, shown in equation (3).
2240 8 . 15 5 . 277 18 27 78 84 149 204 307 130 10 9 8 7 6 5 4 3 2 1 + + + + + + + + + X X X X X X X X X X (3)
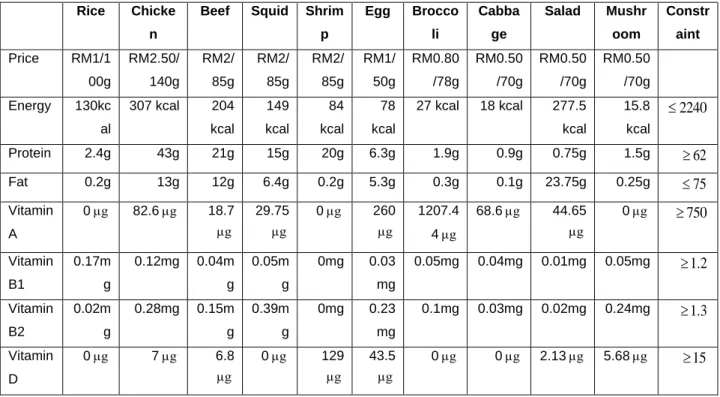
Table 1: Price and Nutritional Content of Food Items
Rice Chicke
n
Beef Squid Shrim
p
Egg Brocco
li
Cabba
ge
Salad Mushr
oom
Constr
aint
Price RM1/1
00g RM2.50/ 140g RM2/ 85g RM2/ 85g RM2/ 85g RM1/ 50g RM0.80 /78g RM0.50 /70g RM0.50 /70g RM0.50 /70g
Energy 130kc
al
307 kcal 204
kcal 149 kcal 84 kcal 78 kcal
27 kcal 18 kcal 277.5
kcal 15.8 kcal 2240
Protein 2.4g 43g 21g 15g 20g 6.3g 1.9g 0.9g 0.75g 1.5g 62
Fat 0.2g 13g 12g 6.4g 0.2g 5.3g 0.3g 0.1g 23.75g 0.25g 75
Vitamin
A
0μg 82.6μg 18.7 μg
29.75 μg
0μg 260 μg
1207.4
4μg
68.6μg 44.65 μg
0μg 750
Vitamin
B1
0.17m
g
0.12mg 0.04m
g
0.05m
g
0mg 0.03
mg
0.05mg 0.04mg 0.01mg 0.05mg 1.2
Vitamin
B2
0.02m
g
0.28mg 0.15m
g
0.39m
g
0mg 0.23
mg
0.1mg 0.03mg 0.02mg 0.24mg 1.3
Vitamin
D
0μg 7μg 6.8 μg
0μg 129 μg
43.5 μg
233 Vitamin
K
0mcg 3.9mcg 1.4mc
g
0mcg 0.33m
cg 0.1m cg 110.1m cg 53.2mc g 45.25m cg
0mcg 90
Calciu
m
3mg 23.8mg 21.25
mg
33.15
mg
59.5m
g
25mg 31.2mg 28mg 9.93mg 4.25mg 1000
Iron 1.49m
g
1.89mg 2.27m
g 0.86m g 0.43m g 0.59 mg
0.52mg 0.33mg 0.15mg 1.23mg 1.37
Zinc 0.42m
g
3.14mg 5.26m
g 1.48m g 1.39m g 0.53 mg
0.35mg 0.13mg 0.13mg 0.63mg 6.6
Phosph
orus
37mg 287mg 181.0
5mg
213.3
5mg
201.4
5mg
86mg 52.26m
g
18.2mg 18.43m
g
61.65m
g
700
Sodium 0mg 127.4m
g
72mg 260m
g
94.35
mg
62mg 204.36
mg
12.6mg 502.5m
g 168.68 mg 1500 Potassi um
29g 359.8g 300.0
5g
237.1
5g
220.1
5g
63g 228.54
g
119g 6.38g 252.3g 4700
Magne
sium
13mg 37.8mg 18.7m
g
32.3m
g
33.15
mg
5mg 16.38m
g
8.4mg 1.43mg 7.75mg 400
The formulated model will be analyzed in QM for Windows V5 software to obtain the optimal solution.
GP MODEL FORMULATION
GP method was introduced in 1955 by A. Charnes, R. O. Ferguson and W. W. Copper. GP is often seen as a multi-objective and multi-decision optimization programming model. GP is a platform of analyzing multiple measures of organizational performance in terms of costs, profitability, productivity and revenue (Charnes and Cooper, 1977).
GP model consists of an objective and the constraints functions.
Objective function: Minimize cost
= − + + = 16 1 i i i d d Z (4)subjected to the constraints
0 , , ; 16 1 = + − + − = − +
i i i ji
i i j
ijX d d c d d X
a (5)
where aij is the coefficient associated with j in goal i-th, di+is the overachievement in goal i-th, di−is the underachievement in goal i-th and c is the target value.
In equation (3), by subtracting di+ and adding di− results in equation (6).
234 Then, the GP model will be run in QM for Windows V5 software to obtain optimal solution.
RESULTS AND DISCUSSION
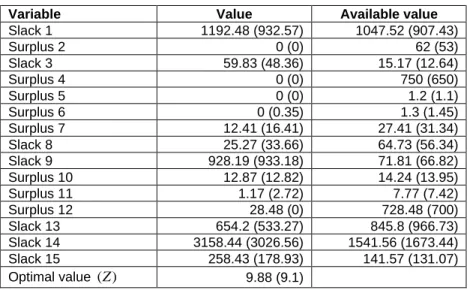
Table 2 represents the results of linear programming technique for male and female students. The lowest cost for male and female students in order to get enough nutrition is RM9.88 and RM9.10, respectively. Meanwhile, the daily meal portion for male (female) students should be 513g (443g) of rice, 141.4g (113.4g) of chicken, 42.9g (37.44g) broccoli and 251.3g (317.8g) of mushroom.
Table 2. Constraints and Output for Male (Female) Students
Rice 1 X Chick en 2 X Beef 3 X Squi d 4 X Shrim p 5 X Egg 6 X Brocc oli 7 X Cabba ge 8 X Salad 9 X Mushr oom 10 X RHS
Price 1 2.5 2 2 2 1 0.8 0.5 0.5 0.5
Energy 130 307 204 149 84 78 27 18 277.5 15.8 2240
(184 0)
Protein 2.4 43 21 15 20 6.3 1.9 0.9 0.75 1.5 62 (53)
Fat 0.2 13 12 6.4 0.2 5.3 0.3 0.1 23.75 0.25 75 (61) Vitamin
A 0 82.6 18.7 29.75 0 260
1207.4
4 68.6 44.65 0 750 (650) Vitamin
B1 0.17 0.12 0.04 0.05 0 0.03 0.05 0.04 0.01 0.05 1.2 (1.1) Vitamin
B2 0.02 0.28 0.15 0.39 0 0.23 0.1 0.03 0.02 0.24 1.3 (1.1) Vitamin
D 0 7 6.8 0 129 43.5 0 0 2.13 5.68
15 (15) Vitamin
K 0 3.9 1.4 0 0.33 0.1 110.1 53.2 45.25 0 90 (90)
Calcium 3 23.8 21.25 33.15 59.5 25 31.2 28 9.93 4.25 1000
(100 0)
Iron 1.49 1.89 2.27 0.86 0.43 0.59 0.52 0.33 0.15 1.23 1.37 (1.13
)
Zinc 0.42 3.14 5.26 1.48 1.39 0.53 0.35 0.13 0.13 0.63 6.6 (4.7) Phosph
orus 37 287 181.0
5 213.3
5
201.4
5 86 52.26 18.2 18.43 61.65 700 (700)
Sodium 0 127.4 72 260 94.35 62 204.36 12.6 502.5 168.68 1500
(150 0)
Potassiu
m 29 359.8 300.0
5 237.1
5
220.1
5 63 228.54 119 6.38 252.3 4700
(470 0) Magnesi
235 Example of calculation for the daily meal portion (male student):
For rice:
5
.
13
100
g
=
513g
. For chicken:1
.
01
140
g
=
141.4g
. For broccoli:0
.
55
78
g
=
42.9g
. For mushroom:3
.
59
70
g
=
251.3g
.Example of calculation for the daily meal portion (female student):
For rice:
4
.
43
100
g
=
443g
. For chicken:0
.
81
140
g
=
113.4g
. For broccoli:0
.
48
78
g
=
37.44g
. For mushroom:4
.
54
70
g
=
317.8g
Table 3 shows the optimal nutrients for both male and female students which are 1047.52kcal (907.43kcal) of energy, 62g (53g) of protein, 15.17g (12.64g) of fat, 750µg (650µg) of vitamin A, 1.2mg (1.1mg) of vitamin B1, 1.3mg (1.45mg) of vitamin B2, 27.41µg (31.34µg) of vitamin D, 64.73mcg (56.34mcg) of vitamin K, 71.81mg (66.82mg) of calcium, 14.24mg (13.95mg) of iron, 7.77mg (7.42mg) of zinc, 728.48mg (700mg) of phosphorus, 845.8mg (966.73mg) of sodium, 1541.56g (1673.44g) of potassium and 141.57mg (131.07mg) of magnesium.
Table 3. LP Summary of Slack and Surplus for Male (Female) Students
Variable Value Available value
Slack 1 1192.48 (932.57) 1047.52 (907.43)
Surplus 2 0 (0) 62 (53)
Slack 3 59.83 (48.36) 15.17 (12.64)
Surplus 4 0 (0) 750 (650)
Surplus 5 0 (0) 1.2 (1.1)
Surplus 6 0 (0.35) 1.3 (1.45)
Surplus 7 12.41 (16.41) 27.41 (31.34) Slack 8 25.27 (33.66) 64.73 (56.34) Slack 9 928.19 (933.18) 71.81 (66.82) Surplus 10 12.87 (12.82) 14.24 (13.95) Surplus 11 1.17 (2.72) 7.77 (7.42)
Surplus 12 28.48 (0) 728.48 (700)
Slack 13 654.2 (533.27) 845.8 (966.73) Slack 14 3158.44 (3026.56) 1541.56 (1673.44) Slack 15 258.43 (178.93) 141.57 (131.07) Optimal value (Z) 9.88 (9.1)
236 855.89mg (976.83mg) of sodium, 1536.72g (1685.56g) of potassium and 130.43mg (129.93mg) of magnesium.
Example of calculation for the daily meal portion (male student):
For rice:
4
.
1
100
g
=
410g
. For chicken:1
.
06
140
g
=
148.4g
. For broccoli:0
.
55
78
g
=
42.9g
. For mushroom:3
.
61
70
g
=
252.7g
.Example of calculation for the daily meal portion (female student):
For rice:
4
.
29
100
g
=
429g
. For chicken:0
.
81
140
g
=
113.4g
. For broccoli:0
.
48
78
g
=
37.44g
. For mushroom:4
.
59
70
g
=
321.3g
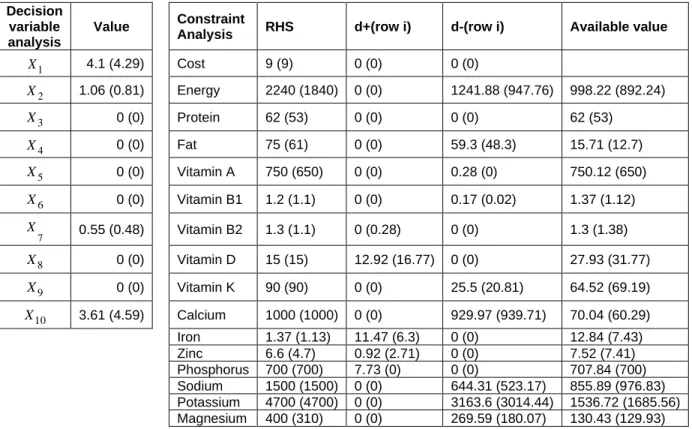
Table 4. GP Summary for Male (Female) Students
Decision variable analysis
Value Constraint
Analysis RHS d+(row i) d-(row i) Available value
1
X 4.1 (4.29) Cost 9 (9) 0 (0) 0 (0)
2
X 1.06 (0.81) Energy 2240 (1840) 0 (0) 1241.88 (947.76) 998.22 (892.24)
3
X 0 (0) Protein 62 (53) 0 (0) 0 (0) 62 (53)
4
X 0 (0) Fat 75 (61) 0 (0) 59.3 (48.3) 15.71 (12.7)
5
X 0 (0) Vitamin A 750 (650) 0 (0) 0.28 (0) 750.12 (650)
6
X 0 (0) Vitamin B1 1.2 (1.1) 0 (0) 0.17 (0.02) 1.37 (1.12)
7
X 0.55 (0.48) Vitamin B2 1.3 (1.1) 0 (0.28) 0 (0) 1.3 (1.38)
8
X 0 (0) Vitamin D 15 (15) 12.92 (16.77) 0 (0) 27.93 (31.77)
9
X 0 (0) Vitamin K 90 (90) 0 (0) 25.5 (20.81) 64.52 (69.19)
10
X 3.61 (4.59) Calcium 1000 (1000) 0 (0) 929.97 (939.71) 70.04 (60.29)
Iron 1.37 (1.13) 11.47 (6.3) 0 (0) 12.84 (7.43) Zinc 6.6 (4.7) 0.92 (2.71) 0 (0) 7.52 (7.41) Phosphorus 700 (700) 7.73 (0) 0 (0) 707.84 (700) Sodium 1500 (1500) 0 (0) 644.31 (523.17) 855.89 (976.83) Potassium 4700 (4700) 0 (0) 3163.6 (3014.44) 1536.72 (1685.56) Magnesium 400 (310) 0 (0) 269.59 (180.07) 130.43 (129.93)
237 both male and female students. The findings revealed that the GP model achieved a lesser minimum cost for both gender than LP model.
Table 5. Comparison Between LP and GP for Male (Female) Students
LP GP
Cost RM9.88 (RM9.10) RM9.00 (RM9.00) Nutrition
Energy 1047.52kcal (907.43 kcal) 998.22 kcal (892.24 kcal)
Protein 62g (53g) 62g (53g)
Fat 15.17g (12.64g) 15.71g (12.7g) Vitamin A 750µg (650µg) 750.12µg (650µg) Vitamin B1 1.2mg (1.1mg) 1.37mg (1.12mg) Vitamin B2 1.3mg (1.45mg) 1.3mg (1.38mg) Vitamin D 27.41µg (31.34µg) 27.93µg (31.77µg) Vitamin K 64.73mcg (56.34mcg) 64.52mcg (69.19mcg) Calcium 71.81mg (66.82mg) 70.04mg (60.29mg) Iron 14.24mg (13.95mg) 12.84mg (7.43mg) Zinc 7.77mg (7.42mg) 7.52mg (7.41mg) Phosphorus 728.48mg (700mg) 707.84mg (700mg) Sodium 845.8mg (966.73mg) 855.89mg (976.83mg) Potassium 1541.56g (1673.44g) 1536.72g (1685.56g) Magnesium 141.57mg (131.07mg) 130.43mg (129.93mg)
Food
Rice
( )
X1 513g (443g) 410g (429g)Chicken
( )
X2 141.4g (113.4g) 148.4g (113.4g)Beef
( )
X3 0 (0) 0 (0)Squid
( )
X4 0 (0) 0 (0)Shrimp
( )
X5 0 (0) 0 (0)Egg
( )
X6 0 (0) 0 (0)Broccoli
( )
X7 42.9g (37.44g) 42.9g (37.44g)Cabbage
( )
X8 0 (0) 0 (0)Salad
( )
X9 0 (0) 0 (0)Mushroom
( )
X10 251.3g (317.8g) 252.7g (321.3g)CONCLUSION AND RECOMMENDATIONS
238 techniques are needed in achieving a better result. The modification can be done by increasing the number of decision variables and constraints.
REFERENCES
Akpan, N. & Iwok, I. (2016). Application of linear programming for optimal use of raw materials in bakery. International Journal of Mathematics and Statistics Invention, 4(8), 51 – 57. https://www.researchgate.net/publication/311038428_Application_of_Linear_Programming_for_Opt imal_Use_of_Raw_Materials_in_Bakery
Anggraeni, W., Vinarti, R. A. Tyasnurita, R. & Permatasari, J. (2015). Production planning optimization using goal programming method in Habibah Busana. Journal of Advance Management Science, 3(4), 270 – 275. http://www.joams.com/index.php?m=content&c=index&a=show&catid=43&id=214 Charnes, A., Cooper, W. W. & Ferguson, R. (1955). Optimal estimation of executive compensation by
linear programming. Management Science, 1, 138 – 151. https://doi.org/10.1287/mnsc.1.2.138 Charnes, A. & Cooper, W. W. (1961). Management Models and Industrial Applications of Linear
Programming. Wiley-New York. https://doi.org/10.1002/nav.3800090109
Charnes, A. & Cooper, W. W. (1977). Goal programming and multiple objective optimizations: Part 1. European Journal of Operational Research, 1(1), 39 – 54. https://doi.org/10.1016/S0377-2217(77)81007-2
Darko, F. A., Allen, B., Mazunda, J., Rahimzai, R. & Dobbins, C. (2013). Cost-minimizing food budgets in Ghana. Journal of Development and Agricultural Economics, 5(4), 135 – 141. https://academicjournals.org/journal/JDAE/article-abstract/99D513A2099
Georgakakos, K. P. (2012). Water supply and demand sensitivities of linear programming solutions to a water allocation problem. Applied Mathematics, 3(10), 1285. https://m.scirp.org/papers/24096 Halim, B. A., Karim, H. A., Fahmi, N. A., Mahad, N. F., Syed Nordin, S. K. & Hassan, N. (2015). Bank
financial statement management using a goal programming model. Procedia-Social and Behavioral Sciences, 211, 145 – 150. https://doi.org/10.1016/j.sbspro.2015.11.066
Hasan, M. M. & Arefin, M. R. (2017). Application of linear programming in scheduling problem. Dhaka
University Journal of Sciences, 211, 498 – 504.
http://journal.library.du.ac.bd/index.php?journal=dujs&page=article&op=view&path%5B%5D=134 2
Hassan, N., Hamzah, H. H. M. & Zain, S. M. M. (2013). A Goal Programming Approach for Rubber Production in Malaysia. American-Eurasian Journal of Sustainable Agriculture, 7(2), 50 – 53. https://ukm.pure.elsevier.com/en/publications/a-goal-programming-approach-for-rubber-production-in-malaysia
Jayaraman, R., Torre, D. L., Malik, T., & Pearson, E. (2015). Optimal work force allocation for energy, economic and environmental sustainability in the United Arab Emirates; A goal programming approach. Energy Procedia, 75, 2999 – 3006. https://doi.org/10.1016/j.egypro.2015.07.611
Maurya, V. N., Misra, R. B., Anderson, P. K. & Shukla, K. K. (2015). Profit optimization using linear programming model: A case study of Ethiopian chemical company. America Journal of Biological and Environmental Statistics, 1(2), 51 – 57. http://www.sciencepublishinggroup.com/j/ajbes
Moraes, L. E., Wilen, J. E., Robinson, P. H. & Fadel, J. G. (2012). A linear programming model to optimize diets in environmental policy scenarios. Journal of Dairy Science, 95(3), 1267 – 1282. https://www.ncbi.nlm.nih.gov/pubmed/22365210
239 Pasic, M., Catovic, A., Bijelonja, I., & Bahtanovic, A. (2012). Goal programming nutrition optimization
model. Annals & Proceedings of DAAAM International, 1(23), 0243-0246, ISSN 2304 – 1382. Parlesak, A., Tetens, I., Jensen, J. D., Smed, S., Blenkuš, M. G., Rayner, M., Darmon, N., & Robertson,
A. (2016). Use of linear programming to develop cost-minimized nutritionally adequate health
promoting food baskets. PLoS ONE, 11(10), e0163411.
https://doi.org/10.1371/journal.pone.0163411
Poh, B. K., Ng, B. K., Siti Haslinda, M. D., Nik Shanita, S., Wong, J. E., Busin, S. T., Ruzita, A. T., Ng, L. O., Khouw, I. & Norimah, A. K. (2013). Nutritional status and dietary intakes of children aged 6 months to 12 years: Finding of the Nutrition Survey of Malaysian Children (SEANUTS Malaysia). British Journal of Nutrition, 110(3), 21 – 35. https://www.ncbi.nlm.nih.gov/pubmed/24016764 Sallan, J. M., Lordan, O. & Fernandez, V. (2015). Modelling and solving linear programming with R.
Omnia Publisher SL.
Sidik, S. M. & Ahmad, R. (2004). Childhood obesity: Contributing factors, consequences and intervention. Malaysia Journal of Nutrition, 10(1), 13 – 22.
Stamenkovska, I. J., Dimitrievski, D., Erjavec, E., Zgajnar, J. & Martinovska-Stojcheska, A. (2018). Optimisation of the vegetable production in the Republic of Macedonia: Linear programming
approach. Malaysia Journal of Nutrition, 10(1), 139492.
https://ideas.repec.org/p/ags/eaa132/139492.html
Stigler, G. J. (1945). The cost of subsistence. J. Farm Econ, 27, 303 – 314.