EXPLORING THE MODERATING EFFECTS OF EXECUTIVE FUNCTIONING ON THE RELATIONSHIP BETWEEN TRAIT ANXIETY AND RESPIRATORY SINUS ARRHYTHMIA DURING STRESS IN ADOLESCENTS WITH AND WITHOUT
ATTENTION-DEFICIT/HYPERACTIVITY DISORDER (ADHD)
Lauren R. Bangert
A dissertation submitted to the faculty at the University of North Carolina at Chapel Hill in partial fulfillment of the requirements for the degree of
Doctor of Philosophy in School Psychology
Chapel Hill 2019
ABSTRACT
Lauren R. Bangert: Exploring the Moderating Effects of Executive Functioning on the Relationship Between Trait Anxiety and Respiratory Sinus Arrhythmia During Stress in
Adolescents with and without Attention-Deficit/Hyperactivity Disorder (ADHD) (Under the direction of Aysenil Belger)
Attention-Deficit/Hyperactivity Disorder (ADHD) is one of the most common
neurodevelopmental disorders of childhood, characterized by persistent symptoms of inattention and/or hyperactivity and impulsivity that negatively impact social and academic functioning (APA, 2013; CDC, 2018b). Adolescents with ADHD commonly exhibit symptoms of trait anxiety, which can contribute to a decreased ability to effectively react to stress (Oh et al., 2018; Weems et al., 2005). Research has indicated that executive functioning also plays an important role in the regulation of stress (Ward et al., 2015), which suggests that adolescents with and without ADHD may respond differently to stressful situations given the variability in executive functioning profiles between these two populations (Kofler et al., 2018). The current study aimed to explore this further by examining how executive functioning moderates the relationship between trait anxiety and stress regulation in adolescents with and without ADHD.
Montuori, & Lushene, 1973). Stress regulation was measured using average respiratory sinus arrhythmia (RSA) assessed at five timepoints before, during, and after participation in the Montreal Imaging Stress Task (MIST; Dedovic et al., 2005).
Results indicated between-group differences in RSA withdrawal, as well as differences in the relationship between trait anxiety and RSA withdrawal. Moderation effects of executive functioning were examined using multilevel modeling (MLM). Cognitive flexibility was found to have a significant moderating effect on the relationship between trait anxiety and stress regulation for both groups. No significant effects were found for inhibitory control or working memory. The results of this study contribute to our understanding of how higher order cognitive processes such as executive functioning influence physiological responses to stress in
TABLE OF CONTENTS
LIST OF TABLES...x
LIST OF FIGURES...xii
CHAPTER 1: INTRODUCTION...1
Attention-Deficit/ Hyperactivity Disorder (ADHD)...1
CHAPTER 2: LITERATURE REVIEW...5
Executive Functioning During Adolescence...5
ADHD and Executive Functioning (EF)...6
ADHD and Working Memory...7
ADHD and Inhibitory Control...8
ADHD and Cognitive Flexibility...9
Trait Anxiety and Executive Functioning...11
ADHD and Trait Anxiety...12
Stress Regulation During Adolescence...14
Hypothalamic-Pituitary-Adrenal (HPA) Axis...15
Polyvagal Theory...16
Heart Rate Variability (HRV)...17
Respiratory Sinus Arrhythmia (RSA)...17
Trait Anxiety and Stress Regulation...18
CHAPTER 3: RESEARCH METHODS...21
Statement of Purpose for the Current Study...21
Research Questions...21
Methods...22
Participants...22
Research Design...24
Procedure...25
Measures...27
Trait Anxiety...28
Working Memory...28
Inhibitory Control...29
Cognitive Flexibility...29
Stress Regulation...31
Analytic Procedures...31
Research Question 1...31
Research Question 2...32
Research Question 3...36
CHAPTER 4: RESULTS...37
Average RSA...37
Change in RSA (RSA Withdrawal)...38
Research Question 1...39
Research Question 2...42
Model 2: Cognitive Flexibility...43
Model 2A. Color-Word Interference Test Scaled Score...44
Model 2B. Moderation Effect of Cognitive Flexibility (CWIT SS)...44
Model 2C. Color-Word Interference Test Corrected Errors...45
Model 2D. Moderation Effect of Cognitive Flexibility (CWIT Corrected Errors)...45
Model 2E. Color-Word Interference Test (Uncorrected Errors)...46
Model 2F. Moderation Effect of Cognitive Flexibility (CWIT Uncorrected Errors)...47
Model 2G. All Cognitive Flexibility Measures...48
Model 3: Inhibitory Control...48
Model 3A. Inhibitory Control (Tower Test Scaled Score)...48
Model 3B. Moderation Effect of Inhibitory Control...49
Model 4: Working Memory...50
Model 4A. Working Memory (Digit Span Scaled Score)...50
Model 4B. Moderation Effect of Working Memory...50
Research Question 3...51
Model 5. Moderator Model for Cognitive Flexibility and ADHD...52
Model 6. Moderator Model for Inhibitory Control and ADHD...52
Model 7. Moderator Model for Working Memory and ADHD...53
CHAPTER 5: DISCUSSION...54
Stress Regulation...54
Moderating Effects of Executive Functioning...57
Group Differences...58
Practical Implications...59
Limitations and Future Directions...60
Conclusions...63
LIST OF TABLES
Table 1. DSM-V Diagnostic Criteria for ADHD: Inattention (APA, 2013)...2
Table 2. DSM-V Diagnostic Criteria for ADHD: Hyperactivity/Impulsivity (APA, 2013)...3
Table 3. Descriptive Statistics for Demographics and Study Variables...24
Table 4. Variables and Measures...27
Table 5. Calculation for Change in RSA...33
Table 6. Average RSA at Each Timepoint by Group...38
Table 7. Bivariate Correlation Matrix for Trait Anxiety and RSA for Combined Sample...40
Table 8. Bivariate Correlation Matrix for Trait Anxiety and RSA for Control Group...41
Table 9. Bivariate Correlation Matrix for Trait Anxiety and RSA for ADHD Group...41
Table 10. Fixed Effects Model for Demographic Variables...43
Table 11. Fixed Effects Model for Cognitive Flexibility (CWIT SS)...44
Table 12. Moderator Model for Cognitive Flexibility (CWIT SS)...45
Table 13. Fixed Effects Model for Cognitive Flexibility (CWIT Corrected Errors)...45
Table 14. Moderator Model for Cognitive Flexibility (CWIT Corrected Errors)...46
Table 15. Fixed Effects Model for Cognitive Flexibility (CWIT Uncorrected Errors)...47
Table 16. Moderator Model for Cognitive Flexibility (CWIT Uncorrected Errors)...47
Table 17. Fixed Effects Model for all Cognitive Flexibility Measures...48
Table 18. Fixed Effects Model for Inhibitory Control...49
Table 19. Moderator Model for Inhibitory Control...49
Table 20. Fixed Effects Model for Working Memory...50
Table 21. Moderator Model for Working Memory...51
LIST OF TABLES (CONTINUED)
LIST OF FIGURES
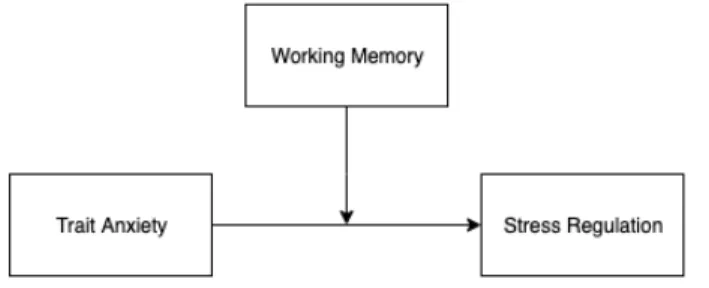
Figure 1. Direct Effect Model for Research Question 1...31
Figure 2. Moderator Model for RQ2 (Cognitive Flexibility)...36
Figure 3. Moderator Model for RQ2 (Inhibitory Control)...36
Figure 4. Moderator Model for RQ2 (Working Memory)...36
Figure 5. Boxplot of Change in RSA by Group...38
CHAPTER 1: INTRODUCTION
Attention-Deficit/Hyperactivity Disorder (ADHD) is one of the most common
neurodevelopmental disorders of childhood (Centers for Disease Control and Prevention; CDC, 2018a). This costly and often debilitating disorder is characterized by a persistent pattern of inattention and/or hyperactivity and impulsivity that impairs functioning and development (American Psychiatric Association; APA, 2013). The estimated prevalence of ADHD in the U.S. has changed over time, due in part to the variability in the measurements used across studies and the evolving definitions of ADHD symptoms; however, there has generally been an upward trend in estimates of parent-reported ADHD since the first national survey was conducted in 1997 (CDC, 2018b). According to a recent, large-scale study by the Centers for Disease Control and Prevention (CDC) using data from the 2016 National Survey of Children’s Health (NSCH), an estimated 6.1 million children in the U.S. between the ages of 2-17 years have received a diagnosis of ADHD at some point in their lives, which accounts for 9.4% of the overall child population in the U.S. (Danielson et al., 2016).
mental disorder or solely the manifestation of oppositional behavior or a failure to understand tasks or instructions. Six or more symptoms are required for a diagnosis in children up to age 16 years and five or more symptoms are required for adults and adolescents older than 17 years. Symptoms of inattention often include failure to attend to details, difficulty sustaining attention, distractibility, failing to follow through on instructions or tasks, difficulty with organization, and forgetfulness (APA, 2013). See Table 1 for the complete list of diagnostic criteria for inattention. Table 1
DSM-V Diagnostic Criteria for ADHD: Inattention (APA, 2013)
a) Often fails to give close attention to details or makes careless mistakes in schoolwork, at work, or during other activities (e.g., overlooks or misses details, work is inaccurate).
b) Often has difficulty sustaining attention in tasks or play activities (e.g., has difficulty remaining focused during lectures, conversations, or lengthy reading).
c) Often does not seem to listen when spoken to directly (e.g., mind seems elsewhere, even in the absence of any obvious distraction).
d) Often does not follow through on instructions and fails to finish schoolwork, chores, or duties in the workplace (e.g., starts tasks but quickly loses focus and is easily sidetracked).
e) Often has difficulty organizing tasks and activities (e.g., difficulty managing sequential tasks; difficulty keeping materials and belongings in order; messy, disorganized work; has poor time management; fails to meet deadlines).
f) Often avoids, dislikes, or is reluctant to engage in tasks that require sustained mental effort (e.g., schoolwork or homework; for older adolescents and adults, preparing reports, completing forms, reviewing lengthy papers).
g) Often loses things necessary for tasks or activities (e.g., school materials, pencils, books, tools, wallets, keys, paperwork, eyeglasses, mobile telephones).
h) Is often easily distracted by extraneous stimuli (for older adolescents and adults, may include unrelated thoughts).
i) Is often forgetful in daily activities (e.g., doing chores, running errands; for older adolescents and adults, returning calls, paying bills, keeping appointments).
Table 2
DSM-V Diagnostic Criteria for ADHD: Hyperactivity/Impulsivity (APA, 2013)
a) Often fidgets with or taps hands or feet or squirms in seat.
b) Often leaves seat in situations when remaining seated is expected (e.g., leaves his or her place in the classroom, in the office or other workplace, or in other situations that require remaining in place).
c) Often runs about or climbs in situations where it is inappropriate. (Note: In adolescents or adults, may be limited to feeling restless.)
d) Often unable to play or engage in leisure activities quietly.
e) Is often “on the go,” acting as if “driven by a motor” (e.g., is unable to be or uncomfortable being still for extended time, as in restaurants, meetings; may be experienced by others as being restless or difficult to keep up with).
f) Often talks excessively.
g) Often blurts out an answer before a question has been completed (e.g., completes people’s sentences; cannot wait for turn in conversation).
h) Often has difficulty waiting his or her turn (e.g., while waiting in line).
i) Often interrupts or intrudes on others (e.g., butts into conversations, games, or activities; may start using other people’s things without asking or receiving permission; for adolescents and adults, may intrude into or take over what others are doing).
There are three subtypes of ADHD that can be diagnosed, depending on the clinical presentation of symptoms: (1) Predominantly inattentive presentation, (2) predominantly hyperactive/ impulsive presentation, or (3) combined presentation (APA, 2013). There are also severity specifiers depending on if the number of symptoms or level of impairment is mild, moderate, or severe. While ADHD is most commonly diagnosed in childhood, symptoms tend to persist well into adolescence and adulthood, making it a costly and chronically disabling
62% were taking medication and 46.7% had received behavioral treatment in the past year (Danielson et al., 2016). A large percentage (23%) had received neither treatment, despite the often deleterious effects of ADHD symptoms on social, academic, and occupational functioning. Children and adolescents with ADHD also commonly experience co-occurring psychiatric disorders and symptoms, including behavior or conduct problems, learning disorders, anxiety, and depression (CDC, 2018c). This often results in poor social and academic performance that has long-term consequences in regards to functionality (CDC, 2018c).
It is well known that children and adolescents with ADHD often exhibit symptoms of trait anxiety that can have compounding effects on overall functioning (Oh et al., 2018).
Experiencing high levels of trait anxiety has been associated with decreased ability to effectively react to stress (Weems et al., 2005), which is a common experience during adolescence. Poor stress regulation during adolescence has been associated with negative psychological outcomes, including increased anxiety and depression in young adulthood (Romeo, 2010). Research has indicated that executive functioning processes play an important role in the regulation of stress (Ward et al., 2015). This has important implications when considering how children with and without ADHD may respond to stressful situations given the variability in executive functioning profiles in these two populations (Kofler et al., 2018). For children and adolescents who
CHAPTER 2: LITERATURE REVIEW
Executive Functioning During Adolescence
Childhood and adolescence are significant periods of development that are indicative of substantial brain maturation as well as psychological and behavioral changes involving the maturation of self-regulatory processes, including executive functions. Multiple definitions and models of executive functioning have been proposed by researchers over the last few decades, with little consensus on a proper definition. Throughout the literature, executive functioning most commonly refers to the collection of neurocognitive processes implicated in the purposeful, goal-directed control and coordination of cognitions, behaviors, and emotions (Zelazo &
Carlson, 2012; Blakemore & Choudhury, 2006; Anderson, 2002). Miyake et al.’s (2000)
prominent model conceptualized executive functioning as consisting of three primary processes: switching (cognitive flexibility), inhibition (inhibitory control), and updating (working memory).
are thought to contribute to better brain connectivity and improved executive functioning (Blakemore & Choudhury, 2006).
Interestingly, although adolescence is generally seen as a time of overall improvement in cognitive and executive functioning skills, behavioral studies have shown a non-linear and varied pattern of development across EF skills, suggesting that not all EF processes have the same developmental trajectory (Blakemore & Choudhury, 2006). Using Miyake et al.’s (2000) three-factor model as a basis, Lee, Bull, and Ho (2013) found age-related patterns of differences in EF processes, suggesting that the efficiency in the three executive control processes becomes more specialized and independent from each other with increased age. Specifically, they found that switching and inhibition correlated significantly enough to indicate that a two-factor model (inhibition-switch and updating) is more appropriate for describing EF patterns in younger children (ages 5-13 years), but that all three processes become less intertwined by age 15 years. ADHD and Executive Functioning
Barkley’s (1997) executive functioning model of ADHD proposed that ADHD is characteristic of a deficit in behavioral inhibition and that inhibition is dependent on four executive neuropsychological functions, including working memory, self-regulation of affect-motivation-arousal, internalization of speech, and reconstitution (or, behavioral analysis and synthesis). Inherent to this model is the assumption that if impairments in behavioral inhibition exist in ADHD, so must deficits in these other four executive functions. His study suggests that the evidence is strongest for impairments in behavioral inhibition, working memory, regulation of motivation, and motor control in those with ADHD.
impairments in EF at all. In fact, children and adolescents with ADHD tend to be quite heterogeneous in their executive functioning profiles (Roberts, Martel, & Nigg, 2017). Kofler and colleagues (2018) found that 89% of children with ADHD demonstrated impairment in at least one executive function, with 62% having impaired working memory, 27% having impaired inhibitory control, and 38% having impaired cognitive flexibility. According to their findings, 54% of children with ADHD showed impairment in one EF domain while only 34% showed impairment in two or all three executive functions. In a longitudinal study, Wåhlstedt, Thorell, and Bohlin (2008) found that early EF impairments in preschool were predictive of later problems with inattention and hyperactivity. Another longitudinal study by Murray, Robinson, and Tripp (2017) found that children with ADHD demonstrated improvements in executive functioning over time, even exceeding expected age-related gains. They also found that better baseline performance on measures of attentional control, information processing, cognitive flexibility, and goal setting was associated with improved ADHD symptoms over time.
ADHD and working memory. Working memory has been defined as the capacity to
actively maintain and manipulate information in one’s mind over a short period of time (Dick, 2014). Research has described two components of working memory: “storage capacity,” or the ability to maintain information in memory after a delay, and “processing capacity,” or the ability to engage in more complex tasks that involve updating or manipulating information held in working memory (Dick, 2014). In general, working memory is crucial to functioning in that it helps individuals to retrieve and maintain relevant information important to executing day-to-day tasks (Gibson et al., 2010).
memory features, including the phonological loop, which is responsible for the temporary storage and rehearsal of verbal information (such as remembering a series of numbers), and the visuospatial sketchpad, which is responsible for the temporary storage and rehearsal of
visuospatial information (such as remembering spatial directions) (Gomez, Gomez, Winther, & Vance, 2014). In this model, working memory also involves a “central executive” that
coordinates higher levels of processing, such as integrating information from the phonological loop and the visuospatial sketchpad, as well as the conversion of information into long-term memory storage. While children with ADHD are heterogeneous in their working memory profiles, evidence has been found for increased difficulties with all three components, with more significant deficits in the visuospatial sketchpad and the spatially-involved central executive (Gomez et al., 2014). Relatedly, Tillman and colleagues (2011) found that visual working memory was associated with inattentive symptoms in children and adolescents aged 6-16 years.
Generally, studies have shown that working memory deficits are reported in 30-37% of ADHD cases (Coghill, Seth, & Matthews, 2014). Similarly, Fried and colleagues (2016) found that significantly more children with ADHD had working memory deficits than controls (31.9% vs. 13.7%, respectively). Their study also noted that impairments in working memory were associated with increased risk for academic and cognitive dysfunction in children with ADHD, beyond the risks attributable to ADHD alone. Kofler and colleagues (2018) found that working memory deficits were associated with higher parent- and teacher-report symptoms of inattention and hyperactivity/impulsivity.
ADHD and inhibitory control. Inhibitory control is perhaps the most complicated of the
self-regulation, effortful control, etc.; Miyake & Friedman, 2012), the different theoretical perspectives by which it is considered (i.e. neuropsychology, evolutionary development, temperament, etc.), and the fact that many measures used to assess inhibitory control are not “pure” in their assessment (i.e. they often concurrently measure other executive functions). In general, inhibitory control refers to a set of cognitive processes involved in the ability to withhold or stop an ongoing response, or resist interference from competing or prepotent responses (Kofler et al., 2018; Lee, Bull, & Ho, 2013).
Researchers have hypothesized that for children and adolescents with ADHD, there is a deficiency in their cognitive control of response inhibition, which impairs their ability to inhibit or delay a response (Wodka et al., 2007). Seemingly inherent in the definition of ADHD
symptomology for those with the hyperactive/impulsive subtype is difficulty with inhibiting impulsive behavior. Recent estimates indicate that deficits in inhibitory control are detected in 21-46% of pediatric ADHD cases (Coghill, Seth, & Matthews, 2014). Kofler et al. (2018) found that only 27% of children with ADHD had impairments in inhibitory control.
ADHD and cognitive flexibility. Cognitive flexibility refers to the ability to efficiently
switch between mental processes in order to adjust one’s behavior according to changes in the environment (Dajani & Uddin, 2015). Cognitive flexibility has been shown to allow individuals to adapt more effectively in response to changes, and has been associated with better academic, social, and emotional outcomes throughout the lifespan. Cognitive flexibility has been found to start developing early in childhood, with an increase in skills between the ages of 7 and 9 years old and substantial maturation by the age of 10 years (Dick, 2014). However, cognitive
In describing cognitive flexibility as an executive function, neuroscience literature commonly refers to two different cognitive processes involved in cognitive flexibility: set shifting and task switching (Dajani & Uddin, 2015). Set shifting is considered a lower-level cognitive flexibility task and is described as the ability to shift one’s attention between different “sets,” or rules, within a task. For example, common tasks used to measure this type of cognitive flexibility involve sorting cards based on one characteristic of the card and shifting to sort the cards based on a different characteristic of the card (e.g. Wisconsin Card Sorting Task). Task switching, on the other hand, is considered to be a more complex, higher-order cognitive flexibility ability that involves switching between two entirely different tasks (Dajani & Uddin, 2015). Research suggests that tasks requiring cognitive flexibility tend to result in slower
response times and decreased accuracy due to the additional cognitive demands it takes to inhibit one’s response set for the previous task and to adapt to the new task or goal (Dajani & Uddin, 2015). As such, although cognitive flexibility is considered to be its own domain of executive functioning, it employs the use of several other executive functioning abilities in order to produce a successful outcome. For instance, neuroimaging studies have shown that cognitive flexibility tasks also recruit neuronal networks implicated in attentional, working memory, and inhibitory processes (Dajani & Uddin, 2015).
compared to typical controls (Cepeda, Cepeda, & Kramer, 2000). Interestingly, they also determined that children who were medicated with methylphenidate (a common stimulant medication used to treat ADHD) had better ability to inhibit responses in order to shift to a new task, regardless of the frequency and unpredictability of the task switch.
Trait Anxiety and Executive Functioning
The relationship between trait anxiety and executive functioning is a complex one that has garnered much attention in the developmental neuropsychology and neuroscience literature. Attentional control theory is a major theoretical perspective that provides a framework through which the relationship between anxiety and executive functioning is commonly examined. Attentional control theory (Eysenck, Derakshan, Santos, & Calvo, 2007) was developed as an extension of the processing efficiency theory proposed by Eysenck and Calvo (1992), which suggested that individuals high in trait anxiety experience diminished efficiency in task performance due to the cognitive interference caused by excessive worry. The processing efficiency theory emphasized that anxiety negatively impacts processing efficiency, or the effort and resources spent performing a task, significantly greater than it affects overall task
effectiveness, or the accuracy with which the task is completed. While this theory offered an important foundational explanation for how anxiety may influence cognitive performance, a primary limitation noted by the authors of attentional control theory is that the processing efficiency theory does not specify which executive functions are most negatively affected by anxiety (Eysenck, Derakshan, Santos, & Calvo, 2007).
tasks (Eysenck et al., 2007). According to this theory, anxiety reduces attentional focus, unless threatening stimuli is present (in which case, individuals with high anxiety are likely to pay more attention). Essentially, attentional control is hindered when anxiety interrupts the balance
between two attentional systems commonly discussed throughout the literature, the goal-directed (or top-down) attentional system and the stimulus-driven (or bottom-up) attentional system.
Waszczuk, Brown, Eley, and Lester (2015) found that children with higher levels of trait anxiety exhibited poorer attentional control. Ursache and Raver (2014) demonstrated that higher levels of trait anxiety were associated with lower levels of executive functioning, particularly inhibitory control, in a sample of typically developing children between the ages of 9 and 12 years. Sportel and colleagues (2011) found that high behavioral inhibition was associated with increased anxiety symptoms in a sample of non-clinical adolescents. Further, their study found that attentional control moderated this relationship, such that the association between behavioral inhibition and anxiety was weakened in those with higher attentional control.
ADHD and Trait Anxiety
The relationship between ADHD and anxiety is a complicated one given the overlap of symptoms and common comorbidity. For instance, children with either ADHD or anxiety may appear restless, irritable, or have difficulty with attention and concentration. However, research indicates that even when this overlap in symptoms is controlled for, between 15% and 35% of children with ADHD demonstrate significant anxiety (Pliszka, Carlson, & Swanson, 1999). Several studies have examined the relationship between ADHD and anxiety, both in terms of the co-morbidity of ADHD and anxiety disorders and in terms of the presence of non-clinical
State-Trait Anxiety Inventory for Children (STAI-C; Spielberger, 1973). State anxiety refers to the intensity of anxious feelings experienced as an emotional state at a particular time
(Spielberger & Reheiser, 2009). Trait anxiety has been defined as a relatively stable individual disposition to perceive stressful situations as more threatening, and a tendency to respond to such situations with increased frequency and intensity of anxiety-related feelings, cognitions, and physical symptoms, including hyperarousal (Spielberger & Reheiser, 2009). Having high trait anxiety, even at a non-clinical level (i.e. having several core symptoms of anxiety but not meeting full diagnostic criteria for an anxiety disorder), has been associated with increased likelihood of other co-occurring psychopathologies, functional impairment, and even suicidal behavior (Balázs et al., 2013). Therefore, trait anxiety is an important construct that captures those who are in between the extremes of low-anxiousness and pathological anxiety.
For children and adolescents with ADHD, there has been conflicting results in the literature regarding the potential pathways by which ADHD and anxiety co-occur. Some
Several studies have indicated that increased anxiety in children with ADHD can
influence performance on cognitive tasks, though there is a lack of consensus regarding findings (Ruf, Bessette, Pearlson, & Stevens, 2017). Results from Ruf and colleagues (2017) suggested that adolescents with ADHD and high trait anxiety performed better on measures of sustained attention and reaction time. They interpreted this as indicative of a “protective” effect of trait anxiety for those with ADHD, such that the brain’s arousal mechanisms may be more balanced in this group which allows them to be more successful at certain cognitive and behavioral inhibition tasks. Rodríguez and colleagues (2014) examined the impact of trait anxiety on attentional functions in children with and without ADHD. Using a four-group design (ADHD only, ADHD + trait anxiety, trait anxiety only, and typical controls), they found that the children with ADHD performed worse on selective and sustained attention tasks than both the typical control group and the group with only trait anxiety. However, there were no statistically significant differences in performance between the ADHD only and the ADHD + trait anxiety groups, suggesting that anxiety did not impact attentional control in this study. Other studies have found that child-reported anxiety is associated with slower response speed and better behavioral inhibition (Bloemsma et al.,2013).
Stress Regulation during Adolescence
regulation. Specifically, studies have shown volumetric increases in the hippocampus and amygdala, especially during the early stages of puberty (Eiland & Romeo, 2013). Other studies have shown developmental changes in cortical gray and white matter volume, such that there are increases in frontal and temporal cortical volumes from childhood to the onset of puberty and then a period of cortical thinning during adolescence (Eiland & Romeo, 2013).
This developmental stage is also distinguishable by the many neuroendocrine shifts that occur during this period, including changes in the hormonal responses to stress. In animal studies, prepubescent animals show a more prolonged hormonal stress response. Specifically, in prepubescent and mid-adolescent animals, ACTH and corticosterone levels can take twice as long to return to baseline following a stressor in comparison to adults (Eiland & Romeo, 2013). Human studies have indicated that boys and girls in later stages of adolescence (ages 15-17 years old) show greater stress-induced levels of cortisol than those who are in late childhood or early adolescence (ages 9-13 years old) (Romeo, 2013). The important changes in stress regulation that occur during adolescence makes this period a critical time to study these processes. Hypothalamic-Pituitary-Adrenal (HPA) Axis
adrenocorticotropic hormone (ACTH) (Romeo, 2013). ACTH then signals the adrenal glands to synthesize and secrete glucocorticoids, or cortisol. After a stressor has ended, the glucocorticoids provide feedback to the pituitary gland and forebrain regions, including the hypothalamus, hippocampus, and prefrontal cortex, which ceases the stress response by diminishing the production and release of CRH and ACTH (Romeo, 2013). Cortisol impacts the activity of several physiological systems, including the function of the autonomic nervous system (ANS), which controls cardiac responses to stress (i.e. increased heart rate) (Rotenberg & McGrath, 2016).
Polyvagal theory. The polyvagal theory, proposed by Steven Porges (1995), is one of the
most prominent models of stress regulation. The theory emphasizes the role of the vagus, or the 10th cranial nerve, in modulating autonomic nervous system responses to stress by influencing the activity of both the sympathetic and parasympathetic nervous systems (PNS). The theory posits that the vagus, also referred to as the vagal nerve, contains myelinated pathways that originate in the nucleus ambiguus and function as an active “vagal break” which can rapidly inhibit or disinhibit the vagal tone of the heart to quickly mobilize or calm an individual (Porges, 2007). It does this by actively inhibiting the influence of the sympathetic nervous system on the heart and decreasing HPA axis activity. Porges (2007) suggested that the PNS remains
consistently active under non-stressful conditions, inhibiting cardiac output by applying the vagal break on the heart. When a stressful situation occurs, the vagal break is quickly withdrawn to increase cardiac output. This vagal withdrawal allows for a more controlled adjustment of heart rate in response to stress and is considered a more adaptive stress response that limits the
Heart Rate Variability (HRV)
One way stress regulation is measured is through cardiac biomarkers such as heart rate variability (HRV). HRV is considered to be a standard and reliable measurement of the
continuous interaction between sympathetic and parasympathetic influences on heart rate (HR), which provides information about autonomic regulatory ability (Appelhans & Luecken, 2006). Studies on HRV changes throughout development show that there is a progressive maturation of the autonomic nervous system after birth, with a gradual increase in parasympathetic relative to sympathetic mediation in the first six to ten years of life, followed by a gradual decrease
(Silvetti, Drago, & Ragonese, 2001). During the first ten years of life, mean HR decreases and tends to be lower in males than females, while HRV indices increase and tend to be higher in males than females. It is thought that this decrease of HR and increase in HRV is related to an increase in parasympathetic modulation of the sinus node. After age ten, there continues to be a decrease in HR and an increase in HRV with age (Kazuma, Otsuka, Wakamatsu, Shirase, & Matsuoka, 2002).
Respiratory sinus arrhythmia (RSA). While HRV is influenced by both the
sensitive index of the functional impact of the vagal break, or vagal tone (Porges, 2007). In general, RSA withdrawal refers to the withdrawal of the vagal break, which allows for a more controlled and adaptive response to stress. Therefore, higher RSA withdrawal is associated with better vagal tone and overall healthier stress response.
Trait Anxiety and Stress Regulation
The primary interest of the current study is the relationship between trait anxiety and stress regulation, and how executive functioning may moderate this relationship differently in adolescents with and without ADHD. Studies that examine anxiety and stress regulation have shown that youth with high anxiety demonstrate differences in their physiological responses to stressful experiences when compared to their non-anxious counterparts, including hormonal responses (i.e. cortisol release) and cardiac output (i.e. heart rate) (Weems et al., 2005). In general, reduced RSA and excessive RSA reactivity (i.e. withdrawal) to stress has been
associated with poor emotion regulation and psychopathology, including anxiety (Beauchaine, 2015).
Theoretically, anxiety is thought to be characterized by a deviation from normal autonomic activity in response to stress, such that high anxiety is associated with more intense physiological responses to mildly threatening stimuli (i.e. hyperarousal) (Weems et al., 2005). In examining RSA levels in children with anxiety symptoms, Viana and colleagues (2017) found that the highest levels of anxiety disorder symptoms were present among children with lower baseline and lower stress-induced RSA levels (i.e. poor vagal control). In a study with adults, Watkins et al. (1998) also found that high trait anxiety was associated with significantly reduced vagal control of the heart, as indicated by a reduction in RSA.
Though there is a paucity of research on how trait anxiety impacts an adolescent’s ability to regulate stress, several studies have shown that there is a link between stress exposure and negative psychological outcomes (Wolff et al., 2012). Heightened SNS reactivity, specifically, has been found to be associated with the development of stress-related psychopathology and medical illness (Wolff et al., 2012). In children, SNS reactivity has adverse effects on a number of outcomes, including increased anxiety (Wolff et al., 2012; Bakker, Tijssen, van der Meer, Koelman, & Boer, 2009). Experiencing increased stress during adolescence has also been associated with greater incidences of anxiety and depressive disorders in adulthood (Romeo, 2010).
Executive Functioning, ADHD, and Stress Regulation
to stress. Conversely, lower resting HRV has been found to be associated with underactivity in prefrontal subcortical structures implicated in self-regulation. Higher resting RSA, HRV, and vagal tone are all associated with better emotional self-regulation, as are changes in these
biomarkers that reflect active regulation of emotional arousal (Bridgett, Burt, & Deater-Deckard, 2015). ADHD has been shown to be associated with autonomic nervous system dysfunction, including impaired cardiac control in response to physical or emotional stress (Tonhajzerová et al., 2014). Studies have specified that ADHD is correlated with low resting RSA, blunted RSA withdrawal, and generally decreased vagal tone (Rukmani et al., 2016).
Trait Anxiety, Executive Functioning, and Stress Regulation: Rationale for Current Study
CHAPTER 3: METHODS
Statement of Purpose for the Current Study
The purpose of the present study was to explore the relationships between trait anxiety, executive functioning processes, and stress regulation in adolescents with ADHD. Specifically, this study aimed to build on the current literature by examining the three primary executive functioning processes (working memory, inhibitory control, and cognitive flexibility) and how they each may moderate the relationship between trait anxiety and stress regulation. This
research can help inform interventions that target the development of executive functioning skills as a means of minimizing the negative effects of anxiety and stress for adolescents with ADHD.
Research Questions
This study examined the following research questions and hypotheses:
1. Is level of trait anxiety significantly associated with a change in RSA (RSA withdrawal)? Hypothesis 1: Trait anxiety will be negatively associated with stress regulation, such that higher trait anxiety will be associated with a decreased change in RSA (RSA withdrawal). 2. To what extent does executive functioning (working memory, inhibitory control, and cognitive
flexibility) moderate the relationship between trait anxiety and change in RSA?
Hypothesis 2: All three EF variables will moderate the relationship, with cognitive flexibility and inhibitory control each having a stronger effect than working memory.
Methods
Participants
The current study used data from the Cognition and Neuroimaging in Teens (CogNiT) Study (UNC IRB #13-3857) currently being conducted by the Neurocognition and Imaging Research Lab at the University of North Carolina at Chapel Hill (UNC NIRL). Recruitment for the larger CogNiT study targeted two groups: (1) a control group consisting of males and females ages 9-16 years who have no previous psychiatric diagnoses and (2) a “medium to high risk” group consisting of males and females ages 9-16 years with ADHD, anxiety, and other behavioral/conduct disorders, as well as children and adolescents with first-degree relatives (a parent or sibling) with a psychotic disorder. Participants were excluded if they had a DSM-IV psychotic or mood disorder, autism spectrum disorder, substance abuse disorder, were pregnant, were taking any medication that directly alter cardiovascular function, had a medical illness, including colds, for one week prior to study evaluations, or has magnetic metal in their body (MRI safety risk). The current study analyzed data collected from approximately 40 participants, which included typical controls (N=22) and medium-to-high risk participants with a previous diagnosis of ADHD (N=18). Control participants were recruited from schools and the
community via flyers, and the ADHD group was recruited from local pediatric health and mental health clinics. A phone screen was conducted with parents to determine whether their child may be eligible for this study. If the child met all of the phone screen criteria, a baseline clinical assessment appointment was scheduled to confirm eligibility in the study. All participants are to be evaluated at baseline, 12-months, and 24-months timepoints.
(SD=2.45). Of the twenty-two adolescents in the control group, 68% identified as Caucasian (N=15), 18% were African American (N=4), and 14% were interracial (N=3). The ADHD group consisted of eighteen adolescents, 67% male (N=12) and 33% female (N=6), with an average age of 13.99 years (SD=2.05 years) and an average grade level of 8.53 (SD=2.11). The ADHD group was 89% Caucasian (N=16) and 11% Interracial (N=2). Of the ADHD group, 22% (N=4) were identified as receiving special education services, while 5% (N=1) of the control group received special education. None of the control participants were taking psychiatric medication at the time of the study, while 61% of the ADHD group (N=11) were taking medication to treat ADHD.
Table 3
Descriptive Statistics for Demographics and Study Variables
Demographics and Study Variables Control
(N=22)
ADHD (N=18)
M SD M SD
Age (Years) 13.41 ± 2.34 13.99 ± 2.05
Grade 7.73 ± 2.45 8.53 ± 2.11
Sex
Male (N=9) 41% (N=12) 67%
Female (N=13) 59% (N=6) 33%
Race*
Caucasian (N=15) 68% (N=16) 89%
African American (N=4) 18% (N=0) 0%
Interracial (N=3) 14% (N=2) 11%
Special Education* (N=1) 5% (N=4) 22%
Medication* (N=0) 0% (N=11) 61%
M SD M SD
Full Scale IQ 112.73 ± 13.99 113.22 ± 9.28
Cognitive Flexibility
CWIT Inhibition/Switching Scaled Score 10.23 ± 2.74 9.38 ±2.97
CWIT Total Self-Corrected Errors 2.59 ± 2.13 1.78 ±1.52
CWIT Total Uncorrected Errors 1.27 ± 1.39 0.94 ±1.76
Inhibitory Control
Tower Test Achievement Scaled Score 10.76 ± 2.09 10.22 ±1.63 Working Memory
Digit Span Scaled Score 11.05 ± 3.26 9.28 ± 2.44
Trait Anxiety 30.82 ± 5.16 31.78 ± 6.49
*Significant at p£0.05
Research Design
quantitative approach was used to conduct a cross-sectional secondary analysis of data from the larger multimodal imaging study (CogNiT) in order to explore the relationships between trait anxiety and stress regulation, as well as the moderating effects of executive functioning
processes (working memory, inhibitory control, cognitive flexibility). The independent variable was trait anxiety, the dependent variable was stress regulation, and the moderator variables were each component of executive functioning, which were analyzed individually.
Procedure
As part of the CoGNiT study, participants first completed baseline clinical assessments to confirm eligibility in the study. Blood samples were obtained during the baseline visit in order to examine novel genetic markers of brain development and stress regulation. Urine toxicity
screenings were also conducted prior to neuroimaging to rule out substance use. Neurocognitive tests occurred once eligibility was confirmed through clinical assessments. Participants then returned for baseline EEG and MRI sessions. Therefore, the baseline timepoint for this study consisted of up to a total of 4 separate appointments. The 12-month and 24-month follow-up timepoints will each include up to three separate visits, including neurocognitive testing, a clinical assessment, and an EEG session.
The data used for the purposes of the current study were collected over two consecutive visits to the UNC NIRL, generally occurring about one week apart during 2017-2018. During the first 3-hour visit, participants underwent a comprehensive clinical interview and were
challenging computerized mental arithmetic problems in the presence of negative social
evaluative ‘feedback.’ The block design version of the MIST was administered to all participants in the scanner during fMRI data collection. Participants were read a script while in the scanner prior to beginning the task. This script sets up the paradigm by informing the participants they will be presented with experimental blocks of math problems that will be recorded, scored, and compared to other participants, as well as non-recorded, non-rated control blocks. In actuality, the math problems and responses are not recorded or evaluated. Arithmetic difficulty is titrated based on individual performance and computerized task feedback is adjusted so that a participant can never score above 50% or exceed the perceived performance of others. Negative feedback is given by the experimenter after the first and second run with increasingly negative content. The feedback following the first run informs the participant that the experimenter is watching and that their performance is below that of other participants during the experimental condition. Feedback after the second run reemphasizes their comparatively poor performance and stresses the importance of the participant performing at a minimum level for their data to count. This induces both performance and social evaluative stress. After the participants completed the entire MRI protocol and exited the scanner, they were debriefed about the MIST paradigm. During debriefing, participants were reassured that their performance was not judged or compared to others, and they were given the opportunity to ask questions and process their experience.
The specific timeline for the MRI was as follows: simulator screening and practice to acclimate participants to MRI scanner (20 minutes); instructions and set up (10 minutes);
exposure (5 minutes); and diffusion tensor imaging (DTI; 6 minutes). Salivary cortisol and alpha amylase were collected prior to instruction/set up, between working memory baseline and MIST, after working memory task given post-MIST/stress exposure, and after DTI, however; this data was not examined in the current study. Electrocardiogram (EKG) for heart rate variability collection was measured from resting state baseline through the end of the MIST task and again from MIST task (post-MIST feedback) through resting state after stress exposure.
Measures
In addition to demographic data, the following measures were used to assess each variable: Table 4
Variables and Measures
Variable Measure Numerical Score Type of Data
Stress Regulation Respiratory Sinus Arrhythmia (RSA) Average RSA
Change in RSA Continuous
Trait Anxiety Spielberger’s State-Trait Anxiety Inventory for Children (STAI-C); Trait Anxiety Scale (A-Trait)
Total Score 20-80 Continuous
Inhibitory Control Delis-Kaplan Executive Function System
(D-KEFS) Tower Test Total Achievement Scaled Score
Continuous
Cognitive Flexibility
Delis-Kaplan Executive Function System (D-KEFS)
Color-Word Interference Test Condition 4: Inhibition/Switching Scaled Score
Continuous
Working Memory Wechsler Abbreviated Scale of Intelligence (WASI)
Digit Span Total Scaled Score
Continuous
Covariates
Group Demographic Data Control (0)
ADHD (1) Dichotomous
Age Demographic Data Ages 9-16 years Continuous
Sex Demographic Data Male (0)
Female (1) Dichotomous
Grade Level Demographic Data Grade Level 3-11 Continuous
Special Education Demographic Data No (0)
Yes (1) Dichotomous
Medication Demographic Data No (0)
Trait anxiety. Prior to the fMRI task during the second visit, participants completed the
Spielberger’s State-Trait Anxiety Inventory for Children, which consists of two 20-item scales that measure state and trait anxiety in children between the ages of 8 and 14 years (STAIC; Spielberger, Edwards, Montuori, & Lushene, 1973). The Trait Anxiety scale of the STAIC has been shown to have high internal consistency, with a reliability coefficient of α=.91, and as being highly correlated with other measures of childhood anxiety, such as the Revised Children’s Manifest Anxiety Scale (RCMAS; r=0.88) (Morosini, Magliano, Brambilla, Ugolini, & Pioli, 2000). The Trait Anxiety scale was used to provide a measure of trait anxiety. This scale is a self-report measure that contains 20 items requiring the participant to rate how often they experience certain anxiety-related symptoms on a 3-point scale (1=hardly ever, 2=sometimes, 3=often). The ratings for all items are then summed to calculate a total Trait Anxiety score between 20 and 60, with a higher value indicating higher trait anxiety. Examples of items include: “I worry about making mistakes,” “I worry about things that may happen,” or “I have trouble making up my mind.”
Working memory. As part of the neurocognitive test battery, participants completed the
Inhibitory control. Participants completed the Tower Test from the Delis-Kaplan
Executive Function System (D-KEFS; Delis, Kaplan, & Kramer, 2001) as part of a larger neurocognitive test battery administered for the CogNit study. The D-KEFS Tower Test is a modified version of other commonly used tower tests (Tower of London and Tower of Hanoi), and was designed to measure planning and problem solving, as well as rule learning, inhibitory control, and maintenance of instructional sets (Shunk, Davis, & Dean, 2006). Internal
consistency coefficients for the D-KEFS Tower Test range from .43 to .84 by age group and test-retest reliability for the Total Achievement Score was moderate (r=.40) (Larochette, Benn, & Harrison, 2009). Adequate convergent and discriminant validity for the D-KEFS Tower Test have also been shown (Larochette, Benn, & Harrison, 2009).
The test includes five differently-sized disks and a board with three pegs. The examiner places the disks in a predetermined arrangement on the pegs and the participant is asked to move the disks to reproduce an “ending position” shown in a stimulus book. There are 9 items that increase in complexity, with the minimum number of moves ranging from 1 to 26. The
participant is required to complete each item in the least amount of moves possible in the shortest amount of time while following two rules: (1) the participant cannot move more than one disk at a time and (2) the participant cannot place a larger disk on top of a smaller disk. The Total Achievement Scaled Score from the Tower Test was used to measure inhibitory control.
Cognitive flexibility. Participants also completed the Color-Word Interference Test
between the ages of 8 and 89 years old (Shunk, Davis, & Dean, 2006). The CWIT was modified from the classic Stroop task and was designed to measure inhibition (inhibitory control) and switching (cognitive flexibility). The CWIT consists of four conditions: Color Naming
(Condition 1), Word Reading (Condition 2), Inhibition (Condition 3), and Inhibition/Switching Condition 4) (Lippa & Davis, 2010).
For the Color Naming condition, participants view a page containing several rows of red, green, and blue squares, which they are instructed to name as quickly as they can without making mistakes. For the Word Reading condition, participants are presented with a page with the words “red,” “green,” and “blue” printed in black ink, which they are asked to read aloud as quickly as they can without making mistakes. For the Inhibition condition, participants view a page with the words “red,” “green,” and “blue” printed incongruently in red, green, or blue ink. Participants are required to name the color of the ink in which the word is printed as quickly as they can without making mistakes. For the Inhibition/Switching condition, the participant is presented with a page that contains the words “red,” “green,” and “blue” printed in red, green, or blue ink, half of which are enclosed within boxes. For words that are not inside boxes, the participant is asked to name the color of the ink in which the word is printed. For words that appear inside a box, the participant is asked to read the word aloud (and not the name of the ink color). The participant is required to name the words or the ink colors as quickly as he/she can without making mistakes.
Stress regulation. Autonomic nervous system (ANS) activity was measured before,
during, and after the stress exposure condition (fMRI MIST task). A Biopac pulseometer was used to collect heart rate (HR) data during the fMRI. This data was processed using
Acknowledge software during the scan, then converted into EKG data using the CardioEdit program and manually edited. Data was then analyzed using Cardiobatch software, which produces metrics including average HR and average RSA. Average RSA was age adjusted and calculated at each timepoint to plot average RSA values at baseline (Resting State 1; RS1), at three timepoints during the stress task (MIST1, MIST2, and MIST3), and at recovery (Resting State 2; RS2). Change in RSA from baseline was calculated to determine extent of vagal withdrawal by subtracting RS1 average RSA from MIST3 average RSA.
Analytic Procedures
Univariate descriptive statistics for each variable and demographics, as well as a bivariate correlation matrix are analyzed. The following analytic approaches were used:
Research Question 1: Is level of trait anxiety significantly associated with a change in stress
regulation?
To examine RQ1, a bivariate correlation was presented to show if trait anxiety is significantly associated with average RSA at each timepoint as well as Change in RSA. See Figure 1, where c is the direct effect of trait anxiety on stress regulation.
Research Question 2: To what extent does executive functioning (working memory,
inhibitory control, and cognitive flexibility) moderate the relationship between trait anxiety
and stress regulation?
Due to the relatively small sample size and the availability of longitudinal data (multiple RSA timepoints), a multilevel modeling (MLM) analytic approach was utilized to answer RQ2. Multilevel modeling (MLM), also referred to as hierarchical linear modeling (HLM), is indicated when observations at one level of analysis are “nested” within another level of analysis, such that the observations at one level of analysis are interdependent (Nezlek, 2012). Repeated measures from a longitudinal study where multiple observations are “nested” within individuals is considered to be a nested, hierarchical data structure appropriate for MLM (Peugh, 2010). In order to conduct a multi-level model analysis, several steps are involved.
Step 1. Data Preparation. To prepare data for multilevel modeling, multivariate data
Table 5
Calculation for Change in RSA Timepoint after
Baseline
Change in RSA
1 MIST1 MIST1 – RS1
2 MIST2 MIST2 – RS1
3 MIST3 MIST3 – RS1
4 RS2 RS2 – RS1
Step 2. Model Specification. In the current study, a two-level data structure was used,
with Level-1 representing the multiple timepoints at which average RSA was obtained after baseline (MIST1, MIST2, MIST3, and RS2) and Level-2 representing individual characteristics (demographic variables, trait anxiety, and executive functioning performance). Level 1 has 160 observations (four RSA timepoints after baseline multiplied by 40 participants), while Level 2 has 40 observations (each variable has one observation per participant). The basic equations used for the two-level model are presented below:
Level-1 Model: [Change in RSA]ti = β0i + eti
Where:
t = time index i = participant index
β0i = estimated average Change in RSA for each participant over the four timepoints
eti = within-individual random error (difference between observed Change in RSA
Where:
γ00 = the grand mean of the 40 average Change in RSA scores
γ01,γ02,γ03…[Sex, Age, IQ, …]i = individual-level fixed effects
U0i = difference between the i’th average Change in RSA score and the grand
mean
Specific models are then fitted by adding in variables of interest. In the current study, executive functioning measures and the interaction between trait anxiety and the executive functioning measures were added to the basic model in a step-wise manner in order to assess for individual and moderation effects.
Step 3. Calculating the Intraclass Correlation Coefficient. In multilevel modeling, an
intraclass correlation coefficient (ICC) is calculated prior to fitting specific models in order to assess the extent of within-individual variances of the outcome variable (Kwok et al., 2008). Using an unconditional means model, the ICC was calculated using the equation below:
ICC = τ00 / (τ00+σ2)
Where:
τ00 = between-individual variances
σ2 = within-individual variances
Step 4. Determining covariance structure. A diagonal covariance structure, which is
the default variance components structure, was chosen for each model. The default structure was kept due to issues of non-convergence when other covariance structures were fitted to each model (e.g. autoregression [AR1], compound symmetry, unstructured, etc.), indicating that these covariance structures are not appropriate for the current analyses.
Step 5. Fixed vs. Random Effects. Models were run with both fixed and random
intercepts and significance was not changed by including a random intercept. As such, for model simplicity and interpretability, patient-level random intercepts were omitted and fixed intercepts were used for each model. All independent variables were treated as fixed-effects due to their time-invariant nature, meaning they are relatively stable and do not change with time.
Step 6. Analysis. Several multilevel models were fitted by adding the variables (trait
anxiety and executive functioning performance) separately in order to answer each component of the research question. Interaction terms (trait anxiety*working memory, trait anxiety*inhibitory control, and trait anxiety*cognitive flexibility) were also added to the models to analyze
moderation effects. Models were analyzed individually for significant predictors of the outcome variable, Change in RSA. Models for each variable and interaction of interest were compared using the Bayesian Information Criterion (BIC) generated from each model. Generally, the model with the lowest BIC indicates a better fit, with differences less than 2 indicating no substantial difference and differences larger than 10 indicating a substantial difference between two models (Kwok et al., 2008).
Figure 2. Moderator Model for RQ2 (Cognitive Flexibility)
Figure 3. Moderator Model for RQ2 (Inhibitory Control)
Figure 4. Moderator Model for RQ2 (Working Memory)
Research Question 3: How do these relationships differ in adolescents with ADHD compared
to typical controls?
CHAPTER 4: RESULTS
The purpose of this study was to explore the relationships between trait anxiety,
executive functioning, and stress regulation in adolescents with and without ADHD. To address the research questions, data was analyzed using IBM SPSS Statistics Version 25. Prior to running the models to examine each research question, the data set was prepared by screening the overall CoGNiT study sample to determine which participants: 1) had available data for each of the variables used, and 2) belonged to the control group or had a diagnosis of ADHD.
Participants who did not have complete data for each variable at the time of this paper were excluded. Categorical variables were dummy coded into dichotomous variables for use in the analytic models. Descriptive statistics are presented in Table 3 and in Table 6 below. Preliminary analyses were conducted to determine if there were any violations of the assumptions of
normality, linearity, multicollinearity, and homogeneity of variance, with no significant issues identified.
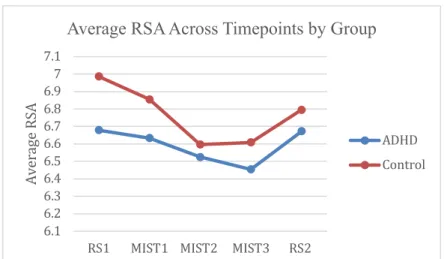
Average RSA
Table 6 indicates the average RSA at each timepoint (before, during, and after the stress task), as well as the average Change in RSA (RSA withdrawal), for each group. Here, change in RSA was calculated by subtracting the average RSA for RS1 from the average RSA for MIST3, which serves as the indicator of change in RSA from baseline (RS1) to the most stressful point of the MIST (MIST3). Independent samples t-tests and one-way between-groups analyses of
timepoint. However, Levene’s Test for the Equality of Variances revealed that there is a statistically significant difference in the variances of the control and ADHD groups for Change in RSA (F=12.901, df=38, p=0.001).
Table 6
Average RSA at Each Timepoint by Group
Stress Regulation Control (N=22) ADHD (N=18)
Timepoint M SD M SD
Resting State 1 (Pre-Stress) RSA 6.99 ± 1.41 6.68 ± 1.25
MIST1 RSA 6.85 ± 1.22 6.63 ± 1.06
MIST2 RSA 6.59 ± 1.43 6.52 ± 1.09
MIST3 RSA 6.61 ± 1.37 6.45 ± 0.97
Resting State 2 (Post-Stress) RSA 6.80 ± 1.34 6.67 ± 1.32
Change in RSA (MIST3-RS1)* -0.38 ± 1.45 -0.22 ± 0.52
*Significant at p£0.001
Change in RSA (RSA Withdrawal)
Stress regulation for both groups was also examined by plotting the average RSA for each timepoint before, during, and after the stress task, which is represented in Figure 6. This figure illustrates the average stress response for each group throughout a stressful experience. The control group had higher baseline RSA (M=6.99, SD=1.41) than the ADHD group (M=6.68, SD=1.25), which is consistent with previous literature. The ADHD group shows more blunted RSA withdrawal between timepoints than the control group, which is also consistent with results from previous studies (Tonhajzerová et al., 2014). Larger variability between baseline RSA and MIST3 RSA for the control group is expected, given that this is an indicator of healthier vagal tone and a more appropriate stress response (Bridgett et al., 2015). The less varied response from the ADHD group is also expected, which indicates that the vagal break is not being withdrawn as well and the stress response is not as well-regulated.
Figure 6. Plot of Average RSA Across Timepoints by Group
Research Question 1: Is level of trait anxiety significantly associated with stress regulation?
To answer RQ1, bivariate correlations were used to assess the direction and strength of the relationship between trait anxiety and stress regulation (RSA). First, Pearson
product-moment correlation coefficients (r) were generated with the entire sample in order to explore the
6.1 6.2 6.3 6.4 6.5 6.6 6.7 6.8 6.9 7 7.1
RS1 MIST1 MIST2 MIST3 RS2
Av er ag e RS A
Average RSA Across Timepoints by Group
between trait anxiety and average RSA during RS2 (r=.328, N=40, p=.039) for the combined sample, but not for other timepoints or overall change in RSA. This indicates that, for the
combined sample, trait anxiety is associated with recovery from stress, but not withdrawal of the vagal brake during the stress task.
Table 7
Bivariate Correlation Matrix for Trait Anxiety and RSA for Combined Sample
Trait
Anxiety Average RS1 RSA MIST1 Average RSA MIST2 Average RSA MIST3 Average RSA RS2 Average RSA Change in RSA
Trait Anxiety 1 .267 .287 .247 .258 .328* -.043
RS1 Average RSA 1 .785** .653** .615** .910** -.535**
MIST1 Average RSA 1 .869** .782** .841** -.100
MIST2 Average RSA 1 .941** .723** .228
MIST3 Average RSA 1 .687** .337*
RS2 Average RSA 1 -.351*
Change in RSA 1
*Correlation is significant at the 0.05 level (2-tailed) **Correlation is significant at the 0.01 level (2-tailed)
Next, the relationship between trait anxiety and stress regulation was explored by group (control and ADHD). For the control group, there was a statistically significant positive
Table 8
Bivariate Correlation Matrix for Trait Anxiety and RSA for Control Group
Trait
Anxiety Average RS1 RSA MIST1 Average RSA MIST2 Average RSA MIST3 Average RSA RS2 Average RSA Change in RSA
Trait Anxiety 1 .418 .517* .451* .445* .481* .014
RS1 Average RSA 1 .741** .529* .462* .905** -.539**
MIST1 Average RSA 1 .842** .752** .798** -.011
MIST2 Average RSA 1 .942** .614** .377
MIST3 Average RSA 1 .571** .498*
RS2 Average RSA 1 -.343
Change in RSA 1
*Correlation is significant at the 0.05 level (2-tailed) **Correlation is significant at the 0.01 level (2-tailed)
For the ADHD group, trait anxiety was not significantly associated with average RSA at any timepoint or with overall change in RSA (see Table 9).
Table 9
Bivariate Correlation Matrix for Trait Anxiety and RSA for ADHD Group
Trait
Anxiety Average RS1 RSA MIST1 Average RSA MIST2 Average RSA MIST3 Average RSA RS2 Average RSA Change in RSA
Trait Anxiety 1 .136 .060 .010 .040 .191 -.253
RS1 Average RSA 1 .850** .890** .922** .923** -.684**
MIST1 Average RSA 1 .928** .851** .908** -.454
MIST2 Average RSA 1 .943** .917** -.377
MIST3 Average RSA 1 .913** -.348
RS2 Average RSA 1 -.514*
Change in RSA 1
Research Question 2: To what extent does executive functioning (working memory,
inhibitory control, and cognitive flexibility) moderate the relationship between trait anxiety
and stress regulation?
To answer RQ2, several multilevel models were fitted in a step-wise manner in order to examine the individual effects of each executive functioning variable (working memory, inhibitory control, and cognitive flexibility) on change in RSA. Interaction terms for each executive functioning variable and trait anxiety were also modeled in order to assess for significant moderation effects.
Model 1: Demographic Variables
The first multilevel model served as a baseline model to examine the relationship of each covariate of interest and the outcome measure to determine potentially significant demographic predictors. The covariates included in the baseline model were age, sex, race, IQ, and trait anxiety (Level 2). The outcome measure used was longitudinal change in RSA for each
Table 10
Fixed Effects Model for Demographic Variables
Model 1. Estimated Fixed Effects for Demographic Predictors of Change in RSA
Parameter Estimate SE df t P
95% Confidence Interval Lower Upper Intercept -1.984386 1.090188 103.318 -1.820 .072 -4.146436 .177665
Sex .304624* .142522 103.318 2.137 .035 .021976 .587273
Age .005208 .002871 103.318 1.814 .073 -.000486 .010902
IQ .004558 .006669 103.318 .684 .496 -.008667 .017783
Group -.151710 .179018 103.318 -.847 .399 -.506738 .203317 Medication .213108 .198428 103.318 1.074 .285 -.180412 .606628 Race (AA) -.037710 .296253 103.318 -.127 .899 -.625236 .549817 Race (Caucasian) .071775 .202624 103.318 .354 .724 -.330067 .473617 Trait Anxiety .005662 .011712 103.318 .483 .630 -.017564 .028889 Note: Akaike’s Information Criterion (AIC) = 443.319; Schwarz’s Bayesian Criterion (BIC) = 455.388
Model 2: Cognitive Flexibility