in the population sciences published by the Max Planck Institute for Demographic Research Konrad-Zuse Str. 1, D-18057 Rostock · GERMANY www.demographic-research.org
DEMOGRAPHIC RESEARCH
VOLUME 8, ARTICLE 7, PAGES 215-244
PUBLISHED 18 April 2003
www.demographic-research.org/Volumes/Vol8/7/
DOI: 10.4054/DemRes.2003.8.7
Research Article
Oldest-Old Mortality in China
Zeng Yi
James W. Vaupel
1 Introduction 216
2 Data resources 216
3 The quality of age reports for very old Han Chinese 217
4 Age trajectory of Han Chinese mortality at oldest-old ages
219
5 Convergence of Han Chinese mortality with Japanese and Swedish mortality
226
6 Life tables for the Han Chinese oldest-old with a comparison to Sweden and Japan
230
7 Conclusions 232
8 Acknowledgements 233
Notes 234
References 238
Research Article
Oldest-Old Mortality in China
Zeng Yi 1
James W. Vaupel 2
Abstract
We find that the Kannisto model, a two-parameter logistic formula, fits Han Chinese death rates at oldest-old ages better than the Gompertz and four other models. Chinese death rates appear to be roughly similar to Swedish and Japanese rates after age 97 for both males and females. Because reports of age seem to be serviceably reliable up to age 100 and perhaps age 105 in China, we think that this convergence may be mainly due to mortality selection in the heterogeneous Chinese population. We show that in China, as in developed countries, the rate of increase in mortality with age decelerates at very old ages.
1
. Zeng Yi, Research Professor, Center for Demographic Studies and the Department of Sociology of Duke
University; Professor, Peking University; Distinguished Research Scholar, Max Planck Institute for Demographic Research. E-mail: [email protected].
1. Introduction
Mounting evidence from developed countries indicates that at advanced ages death rates rise more slowly than predicted by an exponential Gompertz curve (e.g. Vaupel et al. 1998; Kannisto, Lauritsen, Thatcher, and Vaupel, 1994; Thatcher, Kannisto, Vaupel, 1998; Human Mortality Database 2002). What does the trajectory of mortality at advanced ages in a developing country look like? What are the similarities and differences compared with developed countries? Previous studies have not answered such questions because of data limitations.
China offers an unparalleled opportunity for studies in a developing country of the mortality of the very old, for two key reasons. First, the Chinese population is huge, totalling about 1.3 billion. Despite past high mortality, there are large numbers of the oldest-old today. The population of China is ageing rapidly (e.g. Banister, 1990; Ogarwa, 1988; Poston and Duan, 2000). In particular, the number of octogenarians, nonagenarians and centenarians is growing at an extraordinarily rapid rate (Zeng and Vaupel 1989; Zeng and George 2000). Second, age reporting among very old Han Chinese appears to be acceptably reliable, as discussed below. This is important because misreporting of age bedevils demographic analyses of the very old in most developing countries as well as in the United States and some other developed countries (Coale and Kisker 1986; Preston et al. 1996; Elo and Preston 1994; Preston et al. 1998; Kannisto 1990).
Based on serviceably reliable data on Han Chinese mortality derived from the 1990 census, this article analyzes the Han Chinese mortality trajectory at advanced ages and discusses the convergence of Han Chinese death rates with Japanese and Swedish rates after age 97. We also present the first Chinese life table for advanced ages, with a comparison to Japanese and Swedish life tables.
2. Data Resources
and Li concluded that Chinese death rates escape severe distortion if the data from Xinjiang are omitted (Coale and Li, 1991: 298-300).
The data we were able to use from the 1990 census include information about the ethnicity of those who had died in the previous year. Furthermore, data are available by single year of age up to the highest ages reported. Therefore, we were able to study mortality past age 100 and we were able to focus on the Han Chinese population (Note 1).
The population data from this census are by single year of age and refer to people alive on July 1, 1990. The 1990 Chinese census asked each household whether any household member had died in 1989 or in the first half of 1990. Information on the basic demographic characteristics, including ethnicity, of the deceased was collected. Previous studies have shown that the enumeration of deaths is more complete for the six-month period immediately prior to the census than for the preceding year (see, for example, Coale 1993). Adopting the approach suggested by Coale (1993), we estimated the age-specific number of deaths in the whole year of 1990 by doubling the death counts in the first half of 1990.
The data for the populations of people 80 years old and older in Sweden and Japan are taken from the Kannisto-Thatcher Oldest-Old Mortality Database, which is available at www.demogr.mpg.de.
3. The Quality of Age Reports for Very Old Han Chinese
The population age distribution and sex ratios at advanced ages for Han Chinese appear reasonable, as compared with those of Sweden and Japan (Wang et al. 1998: 131, Table 2). Coale and Li (1991) proposed an index (Note 2) for measuring the degree of digit preference at ages divisible by five or ten for older people. Wang et al. (1998) computed this index for the Han Chinese as well as for the populations of Sweden, Japan, France, Italy, and Germany from age 85 to 105, from age 95 to 105, and from age 100 to 105. Sweden is considered to be the country with the most reliable demographic data in the world, so it is reassuring that indices for the Han Chinese match the Swedish indices about as closely as the indices for the other populations (Wang et al. 1998: 133, Table 3).
found that almost all of the Whipple indices we calculated using the Han Chinese data deviated by less than 5% from the standard (Note 3).
The above analysis shows the lack of severe age heaping for the Han Chinese elderly population. The absence of significant digit preference at ages divisible by five or ten, however, is not necessarily proof of data accuracy since other kinds of errors in age misreporting may also distort the data quality. One way of addressing this issue is to examine the reported population at very old ages relative to the total elderly population. As shown by Coale and Kisker (1986), the proportion of those age 95 or over among people age 70 or over in 23 countries with accurate data was always less than six per thousand. This proportion in 28 countries with poor data ranged from one percent to 10 percent (Coale and Kisker 1986). The proportions of those male and female Han Chinese aged 95 or over among those aged 70 or over in 1990 is 0.76 per thousand and 2.18 per thousand respectively, which are almost exactly the same as the values for Sweden in the period 1985-1994. The male and female proportions of those aged 100 years old or over among those aged 75 or over for the Han Chinese in 1990 were 0.128 and 0.388 per thousand. The corresponding proportions for the Swedish population in 1985-1994 were 0.127 and 0.386 per thousand. The close correspondence of these values for Han Chinese and Swedes is undoubtedly a coincidence because the measure is determined by a complicated interplay of the number of births in cohorts that are now very old and the survivorship of these cohorts. Nonetheless, the low values of the measure for the Han Chinese suggests that age may be reported fairly reliably, even at very old ages.
Coale and Kisker (1986: 389-390) plotted the ratio of e70 (life expectation at age
70) against l70/l5 (conditional survival probability from age 5 to age 70) for the female
populations in countries or regions with good data (Note 4). They found a close relationship between e70 and l70/l5 among countries or regions with good data; they
captured the relationship by a third-degree polynomial curve fitted by least squares (Coale and Kisker 1986: 389, Figure 1). Plots of e70 against l70/l5 for the female
populations in countries with poor data (Note 5) all lie far above this curve (Coale and Kisker 1986: 390, Figure 2). We computed the ratio of e70 to l70/l5 for the Han Chinese
female population in 1990. The Han Chinese ratio is almost exactly on Coale and Kisker’s curve.
the Western calendar by census enumerators using a standard coding form (Coale and Li 1991: 294).
Reports, however, of ages of 106 and above seem to us to be too questionable to be useable. Even if only a tiny proportion of younger persons report their age as 106 or more, serious distortions can occur (Wang et al. 1998). Furthermore, population sizes are so small at these extreme ages that the estimated death rates fluctuate widely. Therefore, we limit our analysis to ages 105 and younger in this article, and we are cautious about the possibility that age misreporting may affect estimated values beyond age 97 or so. We present 95% confidence intervals for estimated age-specific death rates to show how much small population size affects the estimates.
4. Age Trajectory of Han Chinese Mortality at Oldest-old Ages
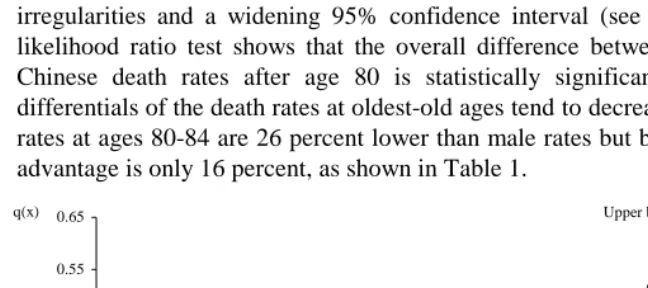
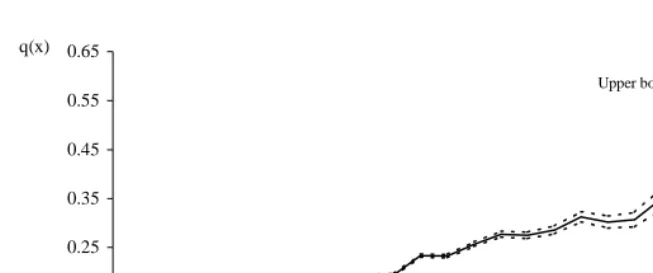
Male central death rates rise from 0.14 at age 80 to about 0.45 at age 96 and then start to fluctuate substantially. Female central death rates increase from 0.10 at age 80 to about 0.42 at age 100; they tend to moderately increase up to age 105 (see Tables 3a and 3b). After age 96, Han Chinese age-specific mortality probabilities show sizeable irregularities and a widening 95% confidence interval (see Figures 1a and 1b). The likelihood ratio test shows that the overall difference between male and female Han Chinese death rates after age 80 is statistically significant (Note 7). The gender differentials of the death rates at oldest-old ages tend to decrease with age: female death rates at ages 80-84 are 26 percent lower than male rates but by age 100-105 the female advantage is only 16 percent, as shown in Table 1.
Figure 1a: Single Age-specific Probability of Death and 95% Confidence Interval,
Han Chinese, 1990, Males
0.05 0.15 0.25 0.35 0.45 0.55 0.65
80 85 90 95 100 105 Age
q(x)
Lower bound of CI
Figure 1b: Single Age-specific Probability of Death and 95% Confidence Interval, Han Chinese, 1990, Females
Table 1.: Five-year age specific death rates at oldest-old ages for Han Chinese,
1990
Age Male Female (female-male)/male
80-84 0.1571 (0.1566-0.1576) 0.1165 (0.1161-0.1168) -25.8%
85-89 0.2232 (0.2221-0.2243) 0.1727 (0.1720-0.1733) -22.6%
90-94 0.3151 (0.3120-0.3183) 0.2541 (0.2524-0.2559) -19.4%
95-99 0.4146 (0.4051-0.4241) 0.3396 (0.3349-0.3443) -18.1%
100-105 0.5290 (0.4945-0.5646) 0.4459 (0.4268-0.4592) -15.7%
Note: Figures in parentheses are 95% Confidence Interval.
Using maximum likelihood estimation procedures as implemented in JMP Software (SAS Institute 2002), we fit Gompertz, Weibull, Heligman & Pollard, Quadratic, Logistic, and Kannisto mortality models to observed single-year age-specific numbers of death counts and persons alive for the Han Chinese (Note 8). Detailed description and discussion of these models, which are summarized in Appendix Table A-1, can be found in Thatcher, Kannisto and Vaupel (1998). We fitted the six models to the observed data at ages 80 through 96. The age 96 was chosen as the upper limit because there are only small fluctuations in the observed rates up to this age for both males and females, but considerable fluctuations exist after age 96, as shown in Figures 1a and 1b.
0.05 0.15 0.25 0.35 0.45 0.55 0.65
80 85 90 95 100 105 Age
q(x)
Furthermore, we wanted to be cautious in using age-specific data pertaining to advanced ages greater than 96. The estimated parameters of the models fit to the Chinese oldest-old mortality data at ages 80-96 are given in Appendix Table A-1. These parameters were used to calculate predicted values of q(x) from age 80 to 105, assuming that the models continue to hold after age 96.
The predicted values of q(x) at ages 80-105 are compared with the observed ones in Figures 2a and 2b (and listed in Appendix Tables A-2 and A-3). The predicted values of q(x) at ages 97-105 are entirely based on the observed data at ages 80-96 and thus independent of the observed values with which they are being compared. Thatcher et al. (1998) followed a similar procedure of fitting models to data at “younger” ages and extrapolating the fits to the oldest ages. One of the main purposes of our model fitting is to test whether the parameter estimates of a model based on the good data at ages 80-96 can be used to reasonably predict the observed rates after age 96.
On the scales used in depicting the model fits to the data at ages 80-96, the six models are practically indistinguishable up to age 96 and all remarkably close to the observed data. The various models then start to diverge, as shown in Figure 2a and 2b. After age 96, the highest predictions of mortality are given by Gompertz model. The lowest predictions are provided by the Kannisto model, which is a simplified two-parameter logistic model. The other four models are in-between. The predictions of the Kannisto model tend to be closest to the empirical observations at most ages above 96 for both males and females and these predictions are generally within the 95% confidence bounds on the data. The model tends, however, to yield predictions that are above the observed death rates at the highest ages.
Figure 2a: Observed q(x) and the model fittings to the data at ages 80-96, and the extrapolated q(x) from age 97 to age 105 based on the model prediction, Han Chinese, 1990, Males
0.05 0.15 0.25 0.35 0.45 0.55 0.65
80 85 90 95 100 105
Age
q(x)
Observed
G=Gompertz
W=Weibull
HP =Heligman & Pollard
L=Logistic
K=Kannisto
Q=Quadratic
Lower bound of CI
Upper bound of CI
G
W HP
Q L
K
Upper bound of CI
Figure 2b: Observed q(x) and the model fittings to the data at ages 80-96, and the extrapolated q(x) from age 97 to age 105 based on the model prediction, Han Chinese, 1990, Females
There is certainly some age misreporting and death underreporting among the oldest-old in China but it is not clear how much. Mortality selection undoubtedly affects the trajectory of mortality at advanced ages, but whether such selection would pull death rates below the projected values of the Kannisto model in China (but not for the 13 developed countries studied by Thatcher et al. (1998)) is questionable. We conjecture that the Kannisto model may provide a rough mid-to-upper bound to the trajectory of Chinese mortality after age 96 and that the empirical data may provide an approximate and rather erratic mid-to-lower bound. Whenever appropriate in the rest of this article, we present and discuss both trajectories.
0.05 0.15 0.25 0.35 0.45 0.55 0.65
80 85 90 95 100 105
Age
q(x) Observed
G=Gompertz
W=Weibull
HP =Heligman & Pollard
L=Logistic
K=Kannisto
Q=Quadratic
Lower bound of CI
Upper bound of CI
G
W HP Q L K Upper bound of CI
We also fitted Gompertz, Weibull, Heligman & Pollard, Quadratic, Logistic, and Kannisto mortality models to observed age-specific numbers of death counts and persons alive from age 80 to 105 for the Han Chinese, following maximum likelihood estimation procedures. The male and female curves of the Kannisto model fit to data at ages 80-105 are almost identical to those fit to data at ages 80-96. Compared with the other five models, the fits of the Kannisto model based on either data at ages 80-105 or data at ages 80-96 tend to be closer to the observed values at advanced ages. These additional model-fitting efforts (see Figures 3a and 3b) further support our earlier argument that the Kannisto model may provide a rough mid-to-upper bound to the trajectory of Chinese mortality after age 96.
Figure 3a: Observed q(x) and the model fittings to the data at ages 80-105
Han Chinese, 1990, Males 0.05
0.15 0.25 0.35 0.45 0.55 0.65
80 85 90 95 100 105
Age
q(x) Observed G=Gompertz W=Weibull
HP =Heligman & Pollard L=Logistic
K=Kannisto Q=Quadratic Lower bound of CI Upper bound of CI
G
W HP
Q L K
Upper bound of CI
Figure 3b: Observed q(x) and the model fittings to the data at ages 80-105 Han Chinese, 1990, Females
In any case, it seems clear from Figures 2a, 2b, 3a, and 3b that a Gompertz curve fails to capture the trajectory of Chinese mortality at the highest ages. Unless there is very severe age misreporting or underreporting of deaths, which seems unlikely, death rates rise more slowly than predicted by an exponential Gompertz curve fit to the data at ages 80-96 and ages 80-105. In contrast, the Kannisto, Logistic, and Quadratic models (especially the Kannisto model) fit the data much better than the exponential Gompertz model. These results indicate that mortality deceleration appears to occur in the developing country of China as well as in developed countries.
0.05 0.15 0.25 0.35 0.45 0.55 0.65
80 85 90 95 100 105
Age
q(x) Observed
G=Gompertz
W=Weibull
HP =Heligman & Pollard
L=Logistic
K=Kannisto
Q=Quadratic
Lower bound of CI
Upper bound of CI
G
W HP
Q L K Upper bound of CI
5.
Convergence of Han Chinese Mortality with Japanese and
Swedish Mortality
In Figures 4a and 4b we plot age-specific probabilities of death for Han Chinese, Swedish and Japanese males and females from age 80 to 105. For the Han Chinese the empirical data is plotted as well as the projected values of the Kannisto model. The likelihood ratio test shows that the overall difference between the magnitudes of Chinese vs. Japanese and Swedish mortality at ages 80 and over is statistically significant (Note 9). The general age patterns of the mortality are, however, roughly similar, with some evidence of convergence of the Han Chinese probabilities toward the Swedish and Japanese ones at the oldest ages. Note that the Han Chinese mortality trajectories shown in Figures 4a and 4b are based on data for one year, 1990, only. The Japanese and Swedish curves shown in the same figures are based on data covering 10 years, since too many random fluctuations (due to small population sizes) would be present if they were based on the data for a single year. This fact concretely demonstrates the advantage of using data for China, with its huge population, to study mortality at advanced ages.
Figure 4a: Comparison of death probabilities, observed Han Chinese 1990,
Kannsito model Fitted Han Chinese 1990, Japanese 1981-1990, and Swedish 1985-1994, males
0 .0 5 0 .1 5 0 .2 5 0 .3 5 0 .4 5 0 .5 5 0 .6 5
8 0 8 5 9 0 9 5 1 0 0 1 0 5
A g e q (x) Ja n p a n , 1 9 8 1
-1 9 9 0
Sw e d e n , 1 9 8 5 -1 9 9 4
C h in a , 1 9 9 0
Figure 4b: Comparison of death probabilities, observed Han Chinese 1990, Kannisto model fitted Han Chinese 1990, Japanese 1981-1990, and Swedish 1985-1994, females
For both males and females, Han Chinese death probabilities are higher than the corresponding Japanese and Swedish ones before age 97. The empirical data after this age suggest a possible crossover; the Kannisto model suggests rough convergence. How can one explain this convergence or modest crossover after age 97? Some age misreporting and death underreporting could account for the pattern. On the other hand, the convergence or crossover could be real and could reflect the impact of mortality selection in heterogeneous populations. In this regard, a brief discussion of black-white mortality crossover in the United States is informative.
A crossover of the age trajectories of black vs. white death rates in the U.S. at ages over 75 has been observed in both cross-sectional and cohort studies. The death rates of black Americans were substantially lower than the white rates after the crossover, especially at the oldest-old ages over 85 (see, e.g. Kitagawa and Hauser 1973; Nam and Okay 1977; Thornton and Nam 1972). Black Americans were subject to more adverse health conditions during childhood and adulthood, as compared to white Americans. Some scholars, therefore, believe that the more vulnerable members of a cohort die at high rates, leaving behind an exceptionally hardy group of survivors at older ages. The crossover has provided empirical underpinnings for a “survival of the fittest” mechanism operating on old-age mortality (Manton, Stallard, and Vaupel 1981;
0 .0 5 0 .1 5 0 .2 5 0 .3 5 0 .4 5 0 .5 5 0 .6 5
8 0 8 5 9 0 9 5 1 0 0 1 0 5 A ge q ( x) J a n p a n , 1 9 8 1
-1 9 9 0
Sw e d e n , 1 9 8 5 -1 9 9 4
C h in a , 1 9 9 0
McCord and Feeman 1990; Otten et al. 1990; Zopf 1992). Other scholars suggest, however, that cohorts subject to severe health conditions in early life also experience elevated mortality in later life (Elo and Preston 1992; Mosley and Gray 1993). Coale and Kisker (1986) use indirect evidence to suggest that most instances of mortality crossovers simply reflect inaccurate data at older ages.
The age at which the black death rates start to fall below white levels, the crossover age, has been increasing over time: from age 75 or so to 88 or more in various studies over the past a few decades. The increase in the crossover age is likely due to the improvement in the quality of black (and white) mortality data (Markides and Black 1996; Corti et al. 1999; Lynch, Brown and Harmsen 2000). Preston and his colleagues recently carried out a rigorous investigation on the quality of age reporting by blacks and whites at old ages. They linked a sample of death certificates of persons aged 65+ in 1985 to records for the same individuals in the U.S. censuses of 1900, 1910, and 1920 and to records of the Social Security Administration. When corrected ages at death are used to estimate age-specific death rates, the death rates of blacks above age 85 increase substantially (Preston et al., 1996). Nonetheless, a crossover appears to exist—at around age 95 for males and in the age range of 90-94 for females, suggesting that black Americans may indeed enjoy lower mortality than whites do at extreme ages (Hill, Preston, and Rosenwaike 2000:194, Note 10).
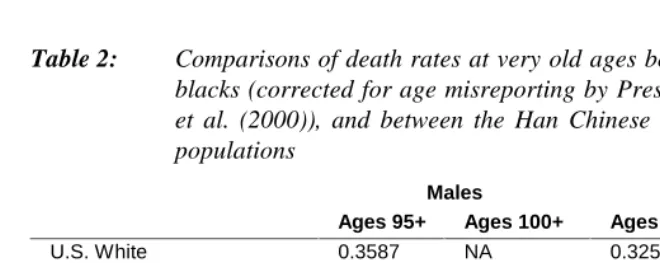
Han Chinese mortality curves converge toward or slightly crossover those of their Swedish and Japanese counterparts at an even higher age. Furthermore, the extent of the crossover is less than for blacks vs. whites in the United States. The level of black mortality at ages 95+, corrected for age misreporting by Preston and his colleagues, is 10.0 percent lower for males and 10.7 percent lower for females than the corresponding white rates. (Hill et al. 2000:194; see also Table 2 in this article). In contrast, the level of Han Chinese mortality at age 95 and above is 8 or 9 percent higher for males and 2 to 4 percent higher for females compared with Japanese or Swedish levels. Furthermore, the average death rate at ages 100-105 is also higher for Han Chinese males than for Japanese or Swedish males and the average death rates at these ages for Han Chinese females is only 4 or 5 percent lower, as shown in Table 2.
per million in Sweden and 25 per million in Japan. Deprivation early in life can result in debilitation of survivors as well as death of the frail, but such debilitation increases mortality among the debilitated as a cohort ages, resulting in mortality selection. Even though current living conditions and medical care are poor, Chinese death rates around age 100 may be similar to Swedish and Japanese levels because the Chinese who endured to age 100 may tend to be more robust with respect to various genetic and non-genetic characteristics (Note 11). This may produce mortality convergence or slight crossover after age 97 of Han Chinese vs. Swedish or Japanese age-trajectories of mortality. It is, however, also possible that for a small proportion of elderly Han Chinese, age of the living or age at death might not be accurately reported. Furthermore, in any comparison of death rates at advanced ages, analysts must bear in the mind the rapidly widening 95% confidence bands that surround the observed estimates. Given these data limitations, it would be injudicious to draw any conclusions from the data except that mortality appears to decelerate in China as well as in Sweden and Japan and that death rates around age 100 appear to be roughly similar in China, Sweden and Japan.
Table 2: Comparisons of death rates at very old ages between the U.S. whites vs.
blacks (corrected for age misreporting by Preston et al. (1996) and Hill et al. (2000)), and between the Han Chinese vs Japanese and Swedish populations
Males Females
Ages 95+ Ages 100+ Ages 95+ Ages 100+
U.S. White 0.3587 NA 0.3257 NA
U.S. Black 0.3232 NA 0.2908 NA
Black vs. White -10.0% NA -10.7% NA
Han Chinese 0.4274 0.5376 0.3546 0.4464 Japanese 0.3891 0.5181 0.3472 0.4651
Swedish 0.3906 0.5025 0.3413 0.4717
Chinese vs. Japanese +9.8% +3.8% +2.1% -4.0% Chinese vs. Swedish +9.4% +7.0% +3.9% -5.4%
6.
Life Tables for the Han Chinese Oldest-old with a
Comparison to Sweden and Japan
Table 3a: Life table measurements at oldest old ages for Han Chinese 1990,
Japanese 1981-1990, and Swedes 1985-1994, Males
Age Han Chinese Japanese Swedish
N(x) D(x) M(x) q(x) l(x) e(x) l(x) e(x) l(x) e(x)
80 537494 74158 0.1380 0.1291 (0.1282, 0.1300) 1.0000 5.29 1.0000 6.68 1.0000 6.85
81 437320 63976 0.1463 0.1363 (0.1353, 0.1373) 0.8709 4.99 0.9139 6.26 0.9176 6.42
82 353525 55940 0.1582 0.1466 (0.1455, 0.1477) 0.7522 4.70 0.8266 5.87 0.8335 6.02
83 282440 52700 0.1866 0.1707 (0.1694, 0.1720) 0.6419 4.43 0.7396 5.51 0.7494 5.63
84 235098 43168 0.1836 0.1682 (0.1668, 0.1696) 0.5323 4.23 0.6544 5.16 0.6666 5.27
85 181174 36548 0.2017 0.1832 (0.1815, 0.1849) 0.4428 3.99 0.5720 4.83 0.5856 4.93
86 137214 29740 0.2167 0.1955 (0.1935, 0.1975) 0.3617 3.77 0.4929 4.53 0.5082 4.61
87 104567 23876 0.2283 0.2049 (0.2026, 0.2072) 0.2910 3.57 0.4189 4.25 0.4343 4.31
88 77393 19110 0.2469 0.2198 (0.2170, 0.2226) 0.2314 3.36 0.3506 3.98 0.3654 4.03
89 54869 14630 0.2666 0.2353 (0.2320, 0.2386) 0.1805 3.16 0.2886 3.73 0.3018 3.77
90 33786 9310 0.2756 0.2422 (0.2379, 0.2465) 0.1380 2.98 0.2330 3.50 0.2453 3.52
91 19778 6402 0.3237 0.2786 (0.2728, 0.2844) 0.1046 2.77 0.1846 3.30 0.1949 3.30
92 14076 4671 0.3319 0.2846 (0.2777, 0.2915) 0.0755 2.65 0.1438 3.10 0.1512 3.11
93 9288 3420 0.3682 0.3110 (0.3023, 0.3197) 0.0540 2.51 0.1094 2.92 0.1158 2.91
94 5992 2327 0.3884 0.3252 (0.3143, 0.3361) 0.0372 2.42 0.0819 2.74 0.0864 2.73
95 4011 1679 0.4186 0.3461 (0.3327, 0.3595) 0.0251 2.34 0.0599 2.57 0.0629 2.56
96 2583 1155 0.4471 0.3654 (0.3486, 0.3822) 0.0164 2.31 0.0426 2.42 0.0447 2.40
97 1701 680 0.3999 0.3332 (0.3127, 0.3537) 0.0104 2.36 0.0296 2.28 0.0310 2.24
98 1209 426 0.3521 0.2994 (0.2756, 0.3232) 0.0069 2.29 0.0200 2.16 0.0204 2.15
99 799 332 0.4149 0.3436 (0.3137, 0.3735) 0.0049 2.05 0.0132 2.03 0.0133 2.03
100 329 210 0.6363 0.4827 (0.4357, 0.5297) 0.0032 1.86 0.0084 1.93 0.0082 1.99
101 200 96 0.4808 0.3876 (0.3269, 0.4483) 0.0017 2.13 0.0052 1.82 0.0050 1.94
102 122 51 0.4214 0.3481 (0.2710, 0.4252) 0.0010 2.15 0.0031 1.78 0.0030 1.89
103 67 34 0.5128 0.4082 (0.3026, 0.5138) 0.0007 2.04 0.0019 1.64 0.0018 1.79
104 60 21 0.3542 0.3009 (0.1933, 0.4085) 0.0004 2.10 0.0010 1.64 0.0011 1.67
105 33 17 0.5211 0.4134 (0.2629, 0.5639) 0.0003 1.78 0.0006 1.57 0.0006 1.67
Table 3b: Life table measurements at oldest old ages for Han Chinese 1990, Japanese 1981-1990, and Swedes 1985-1994, Females
Age Han Chinese Japanese Swedish
N(x) D(x) m(x) q(x) l(x) e(x) l(x) e(x) l(x) e(x)
80 845425 84458 0.0999 0.0951 (0.0945, 0.0957) 1.0000 6.51 0.9454 8.29 1.0000 8.63
81 723076 77334 0.1070 0.1015 (0.1008, 0.1022) 0.9049 6.15 0.8866 7.74 0.9486 8.07
82 610891 71706 0.1174 0.1109 (0.1101, 0.1117) 0.8131 5.78 0.8241 7.22 0.8940 7.53
83 517081 70634 0.1366 0.1279 (0.1270, 0.1288) 0.7229 5.44 0.7587 6.73 0.8358 7.02
84 458746 63406 0.1382 0.1293 (0.1284, 0.1302) 0.6304 5.17 0.6911 6.26 0.7750 6.53
85 373009 56034 0.1502 0.1397 (0.1386, 0.1408) 0.5489 4.86 0.6219 5.83 0.7108 6.08
86 299409 50516 0.1687 0.1556 (0.1544, 0.1568) 0.4722 4.57 0.5524 5.42 0.6449 5.65
87 235086 40422 0.1719 0.1583 (0.1569, 0.1597) 0.3988 4.32 0.4838 5.04 0.5781 5.25
88 182539 35610 0.1951 0.1777 (0.1760, 0.1794) 0.3356 4.04 0.4170 4.69 0.5114 4.86
89 137683 29406 0.2136 0.1930 (0.1910, 0.1950) 0.2760 3.80 0.3533 4.36 0.4450 4.51
90 92002 19814 0.2154 0.1944 (0.1920, 0.1968) 0.2227 3.59 0.2944 4.06 0.3809 4.19
91 56065 14827 0.2645 0.2336 (0.2303, 0.2369) 0.1794 3.34 0.2401 3.78 0.3204 3.89
92 42688 11244 0.2634 0.2327 (0.2289, 0.2365) 0.1375 3.20 0.1921 3.52 0.2636 3.62
93 29603 8721 0.2946 0.2568 (0.2522, 0.2614) 0.1055 3.02 0.1501 3.28 0.2122 3.37
94 20591 6631 0.3221 0.2774 (0.2717, 0.2831) 0.0784 2.90 0.1142 3.06 0.1674 3.14
95 14490 4623 0.3191 0.2752 (0.2684, 0.2820) 0.0567 2.82 0.0850 2.88 0.1289 2.93
96 9757 3258 0.3339 0.2861 )0.2778, 0.2944) 0.0411 2.70 0.0619 2.70 0.0965 2.74
97 6518 2418 0.3710 0.3130 (0.3027, 0.3233) 0.0293 2.58 0.0438 2.53 0.0701 2.59
98 4692 1669 0.3557 0.3020 (0.2899, 0.3141) 0.0201 2.52 0.0299 2.38 0.0501 2.42
99 3149 1143 0.3631 0.3073 (0.2925, 0.3221) 0.0141 2.40 0.0201 2.27 0.0349 2.26
100 1517 643 0.4237 0.3497 (0.3279, 0.3715) 0.0097 2.24 0.0132 2.15 0.0234 2.12
101 906 396 0.4370 0.3586 (0.3303, 0.3869) 0.0063 2.17 0.0083 2.03 0.0149 2.05
102 592 266 0.4494 0.3670 (0.3319, 0.4021) 0.0041 2.10 0.0051 1.95 0.0093 2.00
103 350 184 0.5261 0.4165 (0.3705, 0.4625) 0.0026 2.04 0.0030 1.88 0.0056 1.96
104 247 111 0.4500 0.3673 (0.3129, 0.4217) 0.0015 2.13 0.0018 1.88 0.0035 1.84
105 169 86 0.5083 0.4053 (0.3392, 0.4714) 0.0009 2.08 0.0010 1.86 0.0021 1.78
Tables 3a and 3b present the population at risk (N(x)), number of deaths (D(x)), central death rates, probability of death (q(x)) and their confidence interval, probability of surviving from age 80 to age x (l(x)), and remaining life expectancy (e(x)) from age 80 to 105. These are the first life tables for the Chinese oldest-old population. The l(x) and e(x) for Swedish and Japanese populations are also presented in Tables 3a and 3b for comparative purposes. On average, Han Chinese males aged 80, 90, and 100 could expect to survive 5.3, 3.0, and 1.9 more years, respectively, if the observed age-specific death rates in 1990 applied to the rest of their life span. The corresponding figures are 6.5, 3.6, and 2.2 years for females (Note 12).
Han Chinese male and female life expectancies at age 80 in 1990 are 22-25 percent lower than those of their Japanese and Swedish counterparts. At age 95, the male and female Han Chinese life expectancies are only about 4% and 7% lower respectively than the Swedish and Japanese ones. At age 100 and above, Han Chinese life expectancies are a slightly higher than that in Sweden and Japan. This is consistent with the convergence or slight crossover after age 97 discussed above.
The observed female Han Chinese life expectancies at ages 80, 90, and 100 are 23, 21, and 20 percent higher than that of male Han Chinese. Using estimates based on the Kannisto model, the estimated female Chinese life expectancies at ages 80, 90, and 100 are 23, 21, and 17 percent higher than those of the males. The female Swedish life expectancies at ages 80, 90, and 100 are 26, 19, and 7 percent higher than the male Swedish life expectancies, and the corresponding figures for the Japanese oldest-old are 24, 16, and 11 percent. That is, there is a convergence of remaining male vs. female life expectancy in Sweden and Japan but not in China: in China, the female advantage persists. Based on data from the 1998 healthy longevity survey, Zeng, Liu and George (2002) found that very old Chinese females suffer from substantially disadvantageous status compared with males with respect to education, marital status, living arrangement, retirement pensions, overall income, and medical services, as well as physical and mental health. Gender differentials in socio-economic status and access to medical services are much smaller in Sweden and Japan than in China. The poor relative status of very old females vs. males in China may imply that there is less mortality selection among frailer males than frailer females. This might account for the lack of convergence in the male and females mortality trajectories. This is speculative, however, and further research is needed on this question.
7. Conclusions
Chinese death rates at ages 80-96. We extrapolated the models to predict the rates up to age 105, and compared them with the observed ones. We found that a simplified, two-parameter logistic model, the Kannisto model, performed better than the other models. This is consistent with a study based on European and Japanese data (Thatcher, Kannisto and Vaupel 1998). A Gompertz curve fails to capture the trajectory of Chinese mortality at high ages. Chinese death rates rise considerably more slowly after age 97 than predicted by a Gompertz curve fit to the data at ages 80-96 or 80-105. Our estimates confirm that the pace of increase in death rates decelerates at advanced ages not only in the developed world, but also in China, a developing country.
While male and female Han Chinese death rates at older ages are generally higher than Swedish and Japanese rates, the curves converge or slightly crossover after age 97. Based on studies of the crossover of U.S. black vs. white death rates and based on analyses of the validity of age reporting among the Han Chinese, we believe that the convergence or slight crossover of the Chinese mortality rates with Japanese and Swedish ones after age 97 is due mainly to the effects of mortality selection in heterogeneous populations. It is also possible, however, that small errors in age or death reporting among the Han Chinese may partially contribute to the mortality convergence or slight crossover.
Life tables for the oldest-old Han Chinese show a persistent female advantage in remaining life expectancy. In contrast, in Sweden and Japan the gap between the remaining life expectancies of males vs. females tends to diminish with increasing age. It seems possible, if at first glance paradoxical, that the relatively disadvantaged condition of women vs. men at all ages in China contributes to more mortality selection and thus the persistent female life-expectancy advantage. In any case, further study of living conditions of males vs. females in China seems warranted.
8. Acknowledgements
Notes
1. There are 56 officially recognised ethnic groups in China. Some minority groups
are well integrated with the Han Chinese and have shared Han culture for hundreds or thousands years; the accuracy of their age reports is similar to that of the Han Chinese. However, the ethnic-specific sub-sample sizes are too small to allow us to distinguish the minority groups whose oldest old accurately reported their ages from those who did not. We, therefore, exclusively use Han Chinese data to estimate the mortality trajectory at oldest old ages. The Han accounted for about 92 percent of the total population in 1990.
2. The index is defined as a mean of the ratios of the number at each age to a
two-stage moving average (the five-term average of a five-term average).
3. The Whipple’s Index for evaluating the general degree of age heaping in a
population of all ages is usually calculated as:
The Whipple’s Index =
(sum of number at ages 25,30,...,55,60)*100*5 Total number between ages 23 and 62
The value of the Whipple’s Index in a population with perfect age reporting as well as no any large changes in fertility, mortality and migration for a long time would be 100. The United Nations recommended a standard for measuring the age heaping as follows:
Whipple’s Index quality of data deviation from perfect
<105 Very accurate <5%
105-110 Relatively accurate 5-9.99%
110-125 OK 10-24.9%
125-175 Bad 25-74.99%
>175 Very bad >=75%
Whipple’s Index for the oldest old survivors or deaths of age x and over as follows:
The Whipple’s Index for the oldest old =
(s u m o f n u m b e r a t a g e s 6 5 ,7 0 ,...,9 0 ,9 5 )* 1 0 0 * 5 T o t a l n u m b e r b e tw e e n a g e s 6 3 a n d 9 7
Wang et al. (1998) evaluated Han Chinese centenarians’ age reporting by comparing the Whipple Index with ages 93 and 107 as the limit of the age band to the Swedish counterparts. They found that the Whipple indices for the Han Chinese centenarians deviated by less than 5% from the Swedish standard.
4. Countries or regions with good data include Sweden, Austria, Belgium,
Czechoslovakia, Denmark, England, Finland, France, Germany, Hungary, Ireland, Italy, Japan, Luxembourg, Netherlands, Norway, New Zealand, Scotland, Switzerland and Taiwan.
5. Countries with poor data include Bolivia, Costa Rica, El Salvador, Guatemala,
Honduras, Malaysia, Mexico, Panama, Peru, Philippines, Sri Lanka and Thailand.
6. The precise date of birth is significant in deciding important life events such as
marriage matchmaking, date of marriage, date to start building a house, date of travelling, etc., according to the Han Chinese cultural tradition.
7. The results of likelihood ratio test on the gender differentials of Han Chinese
mortality at oldest old ages are as follows:
Log of Maximum Likelihood
Male and female separately (B) Male: -7898766.3; Female: - 7494039.6
Male and female combined (A) -15463396
The statistics: -2*log(LA/LB) 1411802
X21,95 = 0.004
Therefore, the H0 hypothesis of no differences between males and females is
8. The maximum likelihood estimation procedures used in this paper are the same as the ones used by Thatcher, Kannisto, and Vaupel (1998: 36) for fitting various mortality models to the observed data at oldest old ages in 13 developed countries. The Chinese data used to fit the models are: N(x), the number of persons who reached age x; and D(x), the number of persons who died before reaching age x+1 among those who reached age x. Let
µ
( )
x
denote the force of mortality at exactage x and let
1
( )
( )
1
x x t dtq x
e
µ+
−
∫
= −
denote the probability that a person whosurvives at age x will die before reaching age x+1. Assuming for each parametric
model
θ α
( , )
x
that to a sufficient approximation 12
( )
t
(
x
, )
µ
=
θ
+
α
for all tbetween ages x and x+1, we have estimated the parameters
α
by maximizingL
,the logarithm of the likelihood function:
, ))} x ( q 1 ln( )) x ( D ) x ( N ( ) x ( q ln ) x ( D { L x
∑
+ − −= with
{
1}
2
( ) 1 exp ( , )
q x = − −
θ
x+α
.The convergence criterion used in all procedures of various model fittings is set to
0.0000001 with
α
= 0.0001 (SAS Institute 2002).9. The results of the likelihood ratio test on difference between the Han Chinese and
Japanese/Swedish death rates at oldest old ages are as follows:
Log of Maximum Likelihood
Han Chinese
Japanese Swedish Han Chinese & Japanese
Han Chinese & Swedish
Male -7898766.3 -6098723 -1335918 -13922471 9246201 Female -7494039.6 -6108900 -1347457 -13695912 8886068
Statistics
Han Chinese & Japanese
Han Chinese & Swedish
Male 150036 23034
Females 185946 44572
X2
1,95 = 0.004
Therefore, the H0 hypothesis of no differences between male and female Han
10. Hill et al. (2000: 1994) also noted that this is not fully conclusive, however, because the corrected black rates are based on a small number of deaths at ages 90+ and on the questionable accuracy of the census data.
11. It is also interesting to note that the Japanese male and female oldest old death rates are either slightly higher than or almost identical to the Swedish ones before age 96 and 99, respectively. But the Japanese and Swedish male and female death rates slightly crossover at ages 96 and99. The Japanese male and female death rates are lower than the Swedish ones at ages 97-100 and 100-102; both fluctuate a lot after age 100 and 102, respectively. The number of centenarians in Japan (about 25 per million in 1990) was much smaller than that in Sweden (about 60 per million in 1990). Centenarians in Japan are more selected than their Swedish counterparts. The stronger selection of Japanese oldest-old may explain why male and female Japanese and Swedish mortality rates slightly crossover at ages 96 and 99.
References
Banister, J. (1990). ‘Implications of aging of China's population’, in Zeng Yi, Zhang Chunyuan, and Peng Shongjian (eds.), Changing Family Structure and
Population Aging in China: A Comparative Approach. Beijing: Peking
University Press, published in English language. Also in Dedley, L., Jr. Poston, and D. Yaukey (eds.), The population of modern China. New York: Plenum Press.
Coale, A. (1993). ‘Estimation of the Chinese mortality rates based on the 1990 census data.’ Manuscript.
Coale, A., and Shaomin Li. (1991). ‘The effect of age misreporting in China on the calculation of mortality rates at very high ages.’ Demography, 28(2): 293-301.
Coale, A., and E. E. Kisker. (1986). ‘Mortality Crossovers: Reality or Bad Data?’
Population Studies, 40: 389-401.
Corti, M.C., J.M. Guralnik, L. Ferucci, G. Izmirlian, S.G. Leville, M. Pahor, H.J. Cohen, C. Pieper, and R.J. Havlik. (1999). ‘Evidence for a Black-White Crossover in All-Cause and Coronary Heart Disease Mortality in and Older Population: The North Carolina EPESE.’ American Journal of Public Health, 89:308-314.
Elo, I.T., and S.H. Preston. (1994). ‘Estimating African-American Mortality from Inaccurate Data’. Demography, 31(3): 427-458.
Elo, I., and S. Preston. (1992). ‘The Effect of Early Life Conditions on Adult Mortality: A Review’. Population Index , 58: 186-212.
Hill, M.E., S.H. Preston, and I. Rosenwaike. (2000). ‘Age Reporting among White Americans Aged 85+: Results of a Record Linkage Study’. Demography, 37: 175-186.
Human Mortality Database (2002). Online at www.humanmortality.de .
Jeune, B., and V. Kannisto. (1997). 'Emergence of Centenarians and
Super-centenarians’, in J.-M. Robine et al. (Eds.), Longevity: To the Limits and
Beyond,. Berlin, Heidelgerg, New York: Springer -Verlag.PP.77-89.
Jeune, B., and J.W. Vaupel. (1995). Exceptional longevity: from prehistory to the
Kannisto, V., J. Lauritsen, A.R. Thatcher, and J.W. Vaupel. (1994). ‘Reductions in Mortality at Advanced Ages: Several Decades of Evidence from 27 Countries’,
Population and Develoment Review, 20: 793-870.
Kannisto, V. (1990). Mortality of the elderly in late 19th and early 20th century
Finland, Helsinki: Tilastokeskus, 49.
Kitagawa, I.M., and P.M. Hauser. (1973). Differential Mortality in the U.S.: A Study in
Socioeconomic Epidemiology. Cambridge, MA: Harvard University Press.
Lynch, Scott M., J. Scott Brown, and Katherine G. Harmsen. (2000). "Black-White Differences in Mortality Deceleration and Compression and the Mortality Crossover Reconsidered." Paper presented at the annual meeting of the Population Association of America, Los Angeles, CA, March 2000.
Manton, K.G., E. Stallard, and J.W. Vaupel. (1981). ‘Methods for Comparing the Mortality Experience of Heterogeneous Population’, Demography, 18: 389-410.
Markides, K.S., and S.A. Black. (1996). ‘Race, Ethnicity, and Aging: The Impact of Inequality’, in R.H. Binstock and L.K. George (eds.), Handbook of Aging in the
Social Sciences (4th ed.). San Diego, CA: San Diego Academic Press, 153-170.
McCord, C., and H.P. Freeman. (1990). ‘Excess Mortality in Harlem’, New England
Journal of Medicine, 322: 173-77.
Mosley, W.H., and R. Gray. (1993). ‘Childhood Precursors of Adult Morbidity and Mortality in Developing Countries: Implications for Health Programs’, in J. Gribble and S. Preston (Eds.), The Epidemiological Transition: Policy and
Planning Implications for Developing Countries. Washington, DC: National
Academy Press, 69-100.
Nam, C.B., and K.A. Okay. (1977). Factors Contributing to the Mortality Crossover
Pattern. Mexico City: XVIII General Conference of the International Union for
the Scientific Study of Population.
Newell, C.(1988). Methods and Models in Demography. New York: The Guilford Press.
Ogawa, N. (1988). ‘Aging in China: Demographic Alternatives’, Asian-Pacific Population Journal , 3(3): 21-64.
Poston, D.L., and C. C. Duan. (2000). ‘The Current and Projected Distribution of the Elderly and Eldercare in the People’s Republic of China.’, Journal of Family Issues, 21: 714-732.
Preston, S.H., I.T. Elo, A. Foster, and H. Fu. (1998). ‘Reconstruction the Size of the African American Population by Age and Sex, 1930-1990’, Demography, 35(1): 1-21.
Preston, S.H., I.T. Elo, I. Rosenwaike, and M. Hill. (1996). ‘African-American Mortality at Older Ages: Results of a Mathching Study’, Demography, 33:193-209.
SAS institute (2002), JMP the Statistical Discovery Software. http://www.jmpdiscovery.com.
Thatcher, A.R., V. Kannisto, and J.W. Vaupel. (1998). The Force of Mortality at Ages 80 to 120. Odense: Odense University Press. Online at http://www.demogr.mpg.de/Papers/Books/Monograph5/ForMort.htm.
Thornton, R.G. and C.B. Nam. (1972). ‘The Lower Mortality Rates of Nonwhites at the Old Ages: An Enigma in Demographic Analysis’, Research Reports in Social Science, 11: 1-8.
Vaupel, J.W., J.R. Carey, K. Christensen, T.E. Johnson, A.I. Yashin, N.V. Holm, I.A. Iachine, V. Kannisto, A.A. Khazaeli, P. Liedo, V.D.Longo, Zeng Yi, K.G. Manton, and J.W. Curtsinger. (1998). ‘Biodemographic Trajectories of Longevity’, Science, 280: 855-60.
Voland, E. and C. Engel. (1986). ‘Ist das Postmenopausale Sterbealter Variable einer Fitness-maximierenden reproduktionsstrategie?’ Anthropologischer Anzeiger, 44(1): 10-34.
Wang Zhenglian, Zeng Yi, B. Jeune, and J.W. Vaupel. (1998). ‘Age Validation of Han Chinese Centenarians’, GENUS - An International Journal of Demography, Vol. LIV: 123-141.
Zeng Yi, J.W. Vaupel, Xiao Zhenyu, Zhang Chunyuan and Liu Yuzhi. (2001). ‘The Healthy Longevity Survey and the Active Life Expectancy of the Oldest-old in China’, Population: An English Selection, 13(1): 95-116.
Zeng Yi, Liu Yuzhi, and Linda George. 2002. ‘Gender Differentials of Oldest-old in China”. In press: Research on Aging.
Zeng Yi, and J.W. Vaupel. (1989). ‘Impact of Urbanization and Delayed Childbearing on Population Growth and Aging in China’, Population and Development
Review, 15(3): 425-445.
Appendix
Table A-1: Estimates of the parameters and Log Likelihood of goodness of the
fittings to the single-year age-specific probabilities of death at ages 80-96
Models Function Log Likelihood
Males Logistic ) 1 e ( 10 * 29 . 8 1 e 10 * 048 . 2 10 * 25 . 9 ) x ( x 082 . 0 5 x 082 . 0 4 4 − + + = − −− µ 1194628.1 Kannisto ) 1 e ( 10 * 19 . 8 1 e 10 * 19 . 8 ) x ( x 094 . 0 5 x 094 . 0 5 − + = −− µ 1194638.3 Quadratic µ(x)=exp(−10.32+0.13x−0.00032x2)
1194626.3 Gompertz 4 0.074x
e 10 * 54 . 3 ) x ( = − µ 1194631.3
Weibull µ(x)=1.027*10−13x6.36
1194626.0 Heligman
& Pollard 4 0.082 082 . 0 4 e 10 * 039 . 2 1 e 10 * 039 . 2 ) x ( q − − + = 1194627.7 Females Logistic ) 1 e ( 10 * 038 . 4 1 e 10 * 64 . 5 10 * 13 . 6 ) x ( x 094 . 0 5 x 094 . 0 5 4 − + + = − −− µ 1898353.8 Kannisto ) 1 e ( 10 * 88 . 3 1 e 10 * 88 . 3 ) x
( 5 0.099x
x 099 . 0 5 − + = −− µ 1898364.0 Quadratic µ(x)=exp(−12.53+0.17x−0.00049x2)
1898352.0
Gompertz 0.082x
e 10 * 37 . 1 ) x
( = −4
µ 1898357.0
Weibull µ(x)=3.24*10−15x7.077
1898351.7 Heligman
& Pollard 5 0.089 089 . 0 5 e 10 * 402 . 8 1 e 10 * 402 . 8 ) x ( q − − + = 1898353.4
Table A-2: Comparisons between the observed and fitted values of the single-year age-specific probabilities of death at ages 80-96 and extrapolated from age 97 to age 105, Males
Age Observed Logistic Kannisto Quadratic Gompertz Weibull
Heligman & Pollard
80 0.1291 0.1292 0.1284 0.1290 0.1296 0.1288 0.1316
81 0.1363 0.1387 0.1384 0.1387 0.1389 0.1386 0.1413
82 0.1466 0.1488 0.1490 0.1489 0.1488 0.1489 0.1516
83 0.1707 0.1595 0.1601 0.1596 0.1593 0.1598 0.1626
84 0.1682 0.1708 0.1717 0.1710 0.1704 0.1712 0.1741
85 0.1832 0.1828 0.1839 0.1830 0.1823 0.1832 0.1863
86 0.1955 0.1955 0.1966 0.1956 0.1948 0.1958 0.1992
87 0.2049 0.2088 0.2097 0.2088 0.2082 0.2090 0.2127
88 0.2198 0.2227 0.2233 0.2227 0.2223 0.2228 0.2269
89 0.2353 0.2373 0.2373 0.2372 0.2372 0.2372 0.2417
90 0.2422 0.2526 0.2516 0.2524 0.2529 0.2522 0.2572
91 0.2786 0.2686 0.2662 0.2682 0.2695 0.2677 0.2733
92 0.2846 0.2851 0.2811 0.2847 0.2870 0.2839 0.2900
93 0.3110 0.3023 0.2961 0.3017 0.3053 0.3006 0.3073
94 0.3252 0.3200 0.3113 0.3194 0.3245 0.3179 0.3251
95 0.3461 0.3383 0.3264 0.3377 0.3447 0.3358 0.3435
96 0.3654 0.3571 0.3415 0.3565 0.3656 0.3542 0.3624
97 0.3332 0.3763 0.3565 0.3759 0.3875 0.3730 0.3817
98 0.2994 0.3958 0.3713 0.3958 0.4102 0.3924 0.4014
99 0.3436 0.4157 0.3859 0.4161 0.4337 0.4121 0.4214
100 0.4827 0.4358 0.4002 0.4369 0.4580 0.4323 0.4416
101 0.3876 0.4561 0.4141 0.4580 0.4829 0.4528 0.4621
102 0.3481 0.4765 0.4276 0.4795 0.5085 0.4736 0.4827
103 0.4082 0.4968 0.4406 0.5012 0.5347 0.4947 0.5033
104 0.3009 0.5171 0.4532 0.5231 0.5613 0.5160 0.5240
Table A-3: Comparisons between the observed and fitted values of the single-year age-specific probabilities of death at ages 80-96 and extrapolated from age 97 to age 105, Females
Age Observed Logistic Kannisto Quadratic Gompertz Weibull
Heligman & Pollard
80 0.0951 0.0950 0.0946 0.0949 0.0958 0.0949 0.0953
81 0.1015 0.1031 0.1029 0.1031 0.1036 0.1031 0.1033
82 0.1109 0.1118 0.1118 0.1119 0.1119 0.1119 0.1118
83 0.1279 0.1211 0.1213 0.1212 0.1208 0.1212 0.1210
84 0.1293 0.1311 0.1314 0.1312 0.1305 0.1312 0.1308
85 0.1397 0.1416 0.1421 0.1417 0.1408 0.1417 0.1413
86 0.1556 0.1529 0.1534 0.1529 0.1518 0.1529 0.1525
87 0.1583 0.1648 0.1653 0.1648 0.1637 0.1647 0.1644
88 0.1777 0.1774 0.1778 0.1773 0.1764 0.1772 0.1770
89 0.1930 0.1906 0.1908 0.1904 0.1899 0.1904 0.1903
90 0.1944 0.2045 0.2045 0.2043 0.2043 0.2042 0.2045
91 0.2336 0.2191 0.2186 0.2188 0.2197 0.2188 0.2194
92 0.2327 0.2343 0.2331 0.2340 0.2361 0.2341 0.2350
93 0.2568 0.2500 0.2481 0.2499 0.2534 0.2501 0.2514
94 0.2774 0.2663 0.2634 0.2664 0.2718 0.2668 0.2686
95 0.2752 0.2831 0.2790 0.2836 0.2913 0.2841 0.2864
96 0.2861 0.3003 0.2947 0.3014 0.3118 0.3022 0.3050
97 0.3130 0.3179 0.3106 0.3198 0.3335 0.3210 0.3242
98 0.3020 0.3358 0.3265 0.3387 0.3562 0.3404 0.3441
99 0.3073 0.3539 0.3424 0.3582 0.3799 0.3604 0.3645
100 0.3497 0.3721 0.3581 0.3781 0.4047 0.3810 0.3854
101 0.3586 0.3904 0.3737 0.3985 0.4305 0.4022 0.4067
102 0.3670 0.4086 0.3889 0.4193 0.4573 0.4239 0.4284
103 0.4165 0.4267 0.4038 0.4404 0.4849 0.4461 0.4503
104 0.3673 0.4445 0.4183 0.4617 0.5132 0.4686 0.4725