R E S E A R C H
Open Access
An equivalent circuit model for onset and
offset exercise response
Yi Zhang
1,2*, Azzam Haddad
2, Steven W Su
2, Branko G Celler
3, Aaron J Coutts
4, Rob Duffield
4,
Cheyne E Donges
5and Hung T Nguyen
2*Correspondence: [email protected] 1The Faculty of Aeronautics and Astronautics, University of Electronic Science and Technology of China, 611731 Chengdu, China 2The Faculty of Engineering and IT, University of Technology, Sydney, Australia
Full list of author information is available at the end of the article
Abstract
Background: The switching exercise (e.g., Interval Training) has been a commonly used exercise protocol nowadays for the enhancement of exerciser’s cardiovascular fitness. The current difficulty for simulating human onset and offset exercise responses regarding the switching exercise is to ensure the continuity of the outputs during onset-offset switching, as well as to accommodate the exercise intensities at both onset and offset of exercise.
Methods: Twenty-one untrained healthy subjects performed treadmill trials following both single switching exercise (e.g., single-cycle square wave protocol) and repetitive switching exercise (e.g., interval training protocol). During exercise, heart rate (HR) and oxygen uptake (VO2) were monitored and recorded by a portable gas analyzer (K4b2, Cosmed). An equivalent single-supply switching resistance-capacitor (RC) circuit model was proposed to accommodate the observed variations of the onset and offset dynamics. The single-cycle square wave protocol was utilized to investigate the respective dynamics at onset and offset of exercise with the aerobic zone of approximate 70% - 77% of HRmax, and verify the adaption feature for the
accommodation of different exercise strengths. The design of the interval training protocol was to verify the transient properties during onset-offset switching. A verification method including Root-mean-square-error (RMSE) and correlation coefficient, was introduced for comparisons between the measured data and model outputs.
Results: The experimental results from single-cycle square wave exercises clearly confirm that the onset and offset characteristics for both HR and VO2are distinctly different. Based on the experimental data for both single and repetitive square wave exercise protocols, the proposed model was then presented to simulate the onset and offset exercise responses, which were well correlated indicating good agreement with observations.
Conclusions: Compared with existing works, this model can accommodate the different exercise strengths at both onset and offset of exercise, while also depicting human onset and offset exercise responses, and guarantee the continuity of outputs during onset-offset switching. A unique adaption feature by allowing the time constant (Continued on next page)
(Continued from previous page)
and steady state gain to re-shift back to their original states, more closely mimics the different exercise strengths during normal daily exercise activities.
Keywords: Heart rate, Oxygen uptake, Mathematical modeling, Cardiovascular system, Single-cycle square wave, Interval training
Background
One of the greatest public health challenges confronting many industrialised countries is the obesity epidemic. Low-to-moderate intensity exercise, suitable for every fitness level, remains one of the healthiest and risk averse methods for reducing body fat [1]. Heart rate (HR) and oxygen uptake (VO2) are commonly applied to assess metabolic demands
[2-7]. To develop an effective exercise protocol to improve human cardiovascular fitness, this study first explores the dynamic responses of HR and VO2by using a portable gas
analyzer (K4b2, Cosmed) during treadmill experiments. Twenty-one untrained healthy subjects performed treadmill exercise following the predefined single-cycle square wave and interval training protocols. The single-cycle square wave protocol was utilized to investigate the respective dynamics at onset and offset of exercise with a certain submax-imal exercise capacity (an approximate range of 70% - 77% of HRmax, or 56% - 65% of VO2max[8]). Additionally, an interval training protocol [9] is generally inclusive of three different periods: warm-up, exercise (three-cycle of high intensity period and recovery period), and cool-down. The design of the interval training protocol regarding this study was to verify the transient properties during onset-offset switching.
Previous literatures [10-12] have studied human cardiorespiratory responses at onset and offset of exercise, and found the different dynamic characteristics (i.e., time constants and steady state gains) at onset and offset of exercise. We further explored dynamics in the particular aerobic zone (approximate 70% - 77% of HRmax, or 56% - 65% of VO2max [8]), which has well confirmed the observation reported in literatures [13]. Past works also focused on building a model for estimates of HR and/or VO2responses to exercise. See
[14-21] for examples. These models utilized only a single non-switching model for either onset or offset exercises. The traces of onset and/or offset dynamics would have been accurately described but the transient properties during onset-offset switching are almost overlooked. Switching models produce much better results than single non-switching models. The switching resistance-capacitor (RC) circuit introduced by [13] used a dual-supply threshold-based solution to simulate HR and VO2responses towards the interval
training protocol. Despite a better performance being observed (vs. the non-switching models), particularly for transient behaviors during switching, there are still some limita-tions since dynamical characteristics (i.e., time constant and steady state gain) of model are not allowed to re-shift back to their original states, especially at the offset of exercise. In this paper we propose an innovative single-supply switching RC circuit model. This will depict and analyze HR and VO2dynamics to exercise, consisting of only one power
The list of nomenclature information is included in Table 1. The remainder of the paper is organized as follows. Section ‘Experiment’ introduces experimental equipment, exercise procedures and protocols. Section ‘Data analysis’ shows the data analysis for parameter identification of the proposed model. Section ‘The proposed modeling and verification methods’ describes the proposed single-supply switching RC circuit model and its verification methods. Section ‘Results’ provides the parameter configuration, verifications, and discussions. Finally, Section ‘Conclusion’ concludes this study.
Experiment
In order to investigate HR and VO2 responses with a certain submaximal exercise
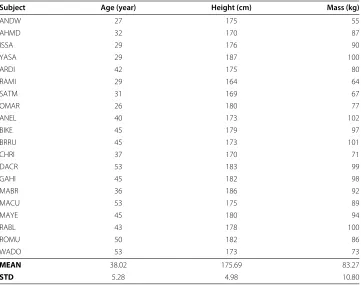
capacity [8], twenty-one male healthy untrained subjects participated in the single-cycle square wave and interval training exercises. The UTS Human Research Ethics Commit-tee (UTS HREC 2009000227) approved this study and an informed consent was obtained from all participants before commencement of data collection. The physical character-istics of the participants joined the single-cycle square wave exercise are presented in Table 2.
Prior nutritional intake, physical activity and environment conditions were standard-ized for all participants. The participants consumed a standardstandard-ized light meal at least two hours before the experiment and were not to engage in any exercises for one day prior to each experiment [22,23]. The temperature and humidity of the laboratory were set at 20 - 25°C and 50% relative humidity, respectively.
The step responses of HR and VO2at onset and offset of exercise were measured
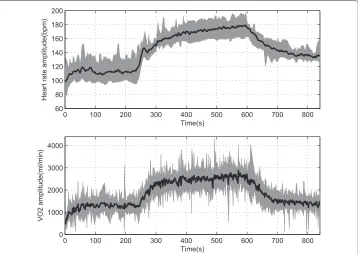
fol-lowing the predefined two protocols: the single-cycle square wave and interval training protocols. Figure 1 shows the exercise intensities and durations of these exercise proto-cols. The single-cycle square wave protocol (see Figure 1a) was repetitively performed by twenty subjects for minimizing effects of the intra subject variability. The inter subject variability (e.g., the fast response of vagal withdrawal, sudden increase of body temper-ature, nervousness at the start of exercise) was as well considered through the initiating warm-up, asking subjects to gently walk on the treadmill with 5 km/h before the onset of the experiment. Figure 2 shows a typical experiment result of the ensemble averages
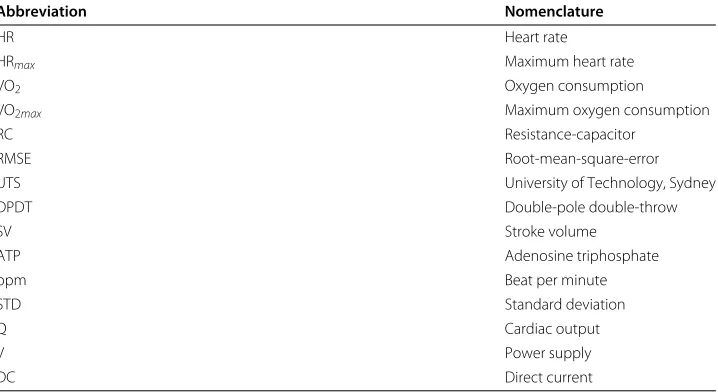
Table 1 The list of abbreviations and terms
Abbreviation Nomenclature
HR Heart rate
HRmax Maximum heart rate
VO2 Oxygen consumption
VO2max Maximum oxygen consumption
RC Resistance-capacitor
RMSE Root-mean-square-error
UTS University of Technology, Sydney
DPDT Double-pole double-throw
SV Stroke volume
ATP Adenosine triphosphate
bpm Beat per minute
STD Standard deviation
Q Cardiac output
V Power supply
Table 2 Subject physical characteristics
Subject Age (year) Height (cm) Mass (kg)
ANDW 27 175 55
AHMD 32 170 87
ISSA 29 176 90
YASA 29 187 100
ARDI 42 175 80
RAMI 29 164 64
SATM 31 169 67
OMAR 26 180 77
ANEL 40 173 102
BIKE 45 179 97
BRRU 45 173 101
CHRI 37 170 71
DACR 53 183 99
GAHI 45 182 98
MABR 36 186 92
MACU 53 175 89
MAYE 45 180 94
RABL 43 178 100
ROMU 50 182 86
WADO 53 173 73
MEAN 38.02 175.69 83.27
STD 5.28 4.98 10.80
STD: Standard Deviation.
of HR and VO2responses following such protocol across twenty subjects. To explore the
transient behaviors during onset and offset of exercise, a new male subject AZAM (Age= 30 year, Height=185 cm, and Mass=84 kg) was invited to run on the treadmill following the interval training protocol, proposed in Figure 1b.
In order to investigate cardiorespiratory responses to the moderate exercise inten-sity level, the aerobic zone of approximate 70% - 77% of HRmax (or 56% - 65% of VO2max) was targeted for exercisers following both exercise protocols [8], since the rela-tionship between HR and VO2 in this zone is nearly linear [24]. To determine HRmax
0 100 200 300 400 500 600 700 800 60
80 100 120 140 160 180 200
Time(s)
Heart rate amplitude(bpm)
0 100 200 300 400 500 600 700 800 0
1000 2000 3000 4000
Time(s)
VO2 amplitude(ml/min)
Figure 2 The HR and VO2experimental data for twenty subjects following the predefined
single-cycle square wave protocol.Thick black lines indicate the average response of HR and VO2and the gray surface indicates plus and minus deviations over forty trials of twenty subjects.
for any individual subject, the equation employed for this study was developed by Inbar [25]:
HRmax=205.8−0.685∗(Age). (1)
All physiological measurements in this study were collected by a Cosmed portable gas analyzer (K4b2, Cosmed, Rome, Italy). The Cosmed system includes a compatible HR monitor which consists of one transmitter in the elastic belt and one receiver. The two parts are assembled as close as possible for capturing the most effective communication signals. K4b2gas analyzer and its compatible products are chosen because they have been reported to be valid, accurate and reliable [26-28]. To avoid random errors and improve the accuracy of the recorded data, each exercise was repeated twice by subjects and the obtained data filtered, interpolated, and averaged.
Data analysis
It has been widely known that the step responses of HR and VO2can be approximated as
a first-order process [29],TsK+1, whereKis the steady state gain andTis the time constant. On the basis of the experimental data of the single-cycle square wave protocol Matlab System Identification Toolbox was used to establish the first-order process for both HR and VO2responses over all trials. The coefficients (KandT) for each trial are identified,
and the mean and standard deviation (STD) of twenty subjects at onset and offset of exercise are illustrated in Table 3. Those results indicate that the steady state gain (K) at offset of exercise is obviously smaller than that at onset of exercise for both HR and VO2.
Table 3 The mean and STD results ofTandKof the experiment results for the HR and VO2
responses at onset and offset of exercise
Coefficients HR VO2
Mean STD Mean STD
Ton(sec) 60.60 17.52 54.97 10.78
Kon 13.35 2.26 356.43 60.12
Toff(sec) 88.99 39.08 65.90 13.43
Koff 10.15 1.87 340.30 57.93
Ton,Toff,KonandKoffrepresent time constant (T) and steady state gain (K) at onset and offset of exercise respectively.
The proposed modeling and verification methods
The single-supply switching RC circuit model
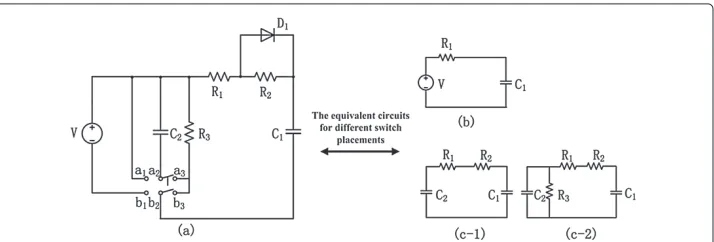
Figure 3a shows the overview of the proposed single-supply switching RC circuit model, which is inclusive of one DC power supply (V), one diode, one double-pole double-throw (DPDT) switch, two capacitors (C1andC2), and three resistors (R1,R2andR3). Figures 3b
and c-1/c-2 are the subcircuits of the proposed model linked by the DPDT switch rep-resenting cardiorespiratory behaviors at onset and offset, respectively. The voltage ofC1
with respect to exercise time represents the amplitude of HR and/or VO2dynamics
dur-ing moderate exercise and its subsequent recoveries, since in moderate exercise both HR and VO2have similar behaviors [13,24]. The functionality of D1is to configure the
resistance amplitude of the onset and offset circuits, which will short R2off during the
activation of the onset circuit. The process of modeling both HR and VO2dynamics at
onset and offset of exercise and long-term recovery is as follows.
At first, the onset behaviors are simulated by switching DPDT to polesa1andb1, (see
Figure 3b). The function of the dioxideD1is to short theR2out. In this period, the DC
power supply V charges the capacitorC1, from baseline up toV1 that approximately
equals the DC power supplyV. Figure 4 shows the dynamic variations of capacitorsC1
andC2in the proposed model during exercise and recovery. The voltage ofC1is expressed
as:
Vc1(t)=V
1−e− t R1C1
(t0≤t≤t1), (2)
where the steady state value of Vc1(t)is known asV.
During the offset period fromt1tot2(see Figure 4), both circuits c-1 and c-2 would
be applicable for the analysis of this period. However, if assumeR3is sufficiently big, the
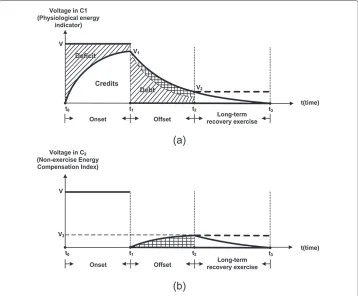
Figure 4 Voltage variations of capacitorsC1andC2of the proposed model at onset, offset and
long-term recovery exercise.(a). the voltage variation of C1;(b). the voltage variation of C2.
current passing throughR3would be negligible, meaning that both circuits (c-1 and c-2)
with such assumption forR3are approximately equivalent. The offset processes forC1
andC2can be described as:
Vc1(t)= C1
C1+C2
V1+
C2V1
C1+C2
e− (C1+C2)t C1C2(R1+R2) (t
1≤t≤t2), (3)
Vc2(t)= C1
C1+C2
V1−
C1V1
C1+C2
e− (C1+C2)t C1C2(R1+R2) (t
1≤t≤t2), (4)
during which the capacitor C1 is discharging and its voltage follows an exponential
decay down toV2 at time t2, while the capacitor C2 is charging resulting in an
expo-nential growth of its voltage from 0 at timet1to V3at timet2. It is also required that
V2≈V3≈ CC11+VC12 at the end time of offset portion,t2.
The particular offset dynamics ofC1was intended to mimic a repetitive switching
train-ing behavior (e.g., interval traintrain-ing [30]). At this stage, the steady state level ofC1would
shift from a high level (e.g.,V1) to a low level (e.g.,V2) comparing to the initiating level at
stored in capacitorsC1andC2through the resistanceR3. Figure 4 shows this long-term
recovery process where theC1andC2voltages fall down to the baseline at timet3.
Based on equations (2)-(4), the normalized time constants and steady state gains for both onset and offset processes could be derived as follows:
⎧ ⎪ ⎪ ⎪ ⎪ ⎪ ⎪ ⎨ ⎪ ⎪ ⎪ ⎪ ⎪ ⎪ ⎩ ˜
Kon= KKonon =1,
Ton=R1C1,
˜
Koff = KKoffon = C1C+2C2,
Toff =(R1+R2)CC11+CC22,
(5)
where Kon, Ton,Koff, and Toff represent the steady state gains and the time constants of onset and offset respectively. New defined parameters K˜on and K˜off are applied to normalize steady state gains.
IfKon,Koff,Ton, andToff are given and assumeR2is a pre-defined free parameter, the
values of capacitors and resistor (C1,C2, andR1) then could be easily configured by:
⎧ ⎪ ⎪ ⎪ ⎪ ⎪ ⎨ ⎪ ⎪ ⎪ ⎪ ⎪ ⎩
C1=
Toff−TonK˜off R2K˜off ,
C2= Toff−Ton ˜
Koff R2(1− ˜Koff) ,
R1= TonR2 ˜
Koff Toff−TonK˜off
.
(6)
Quantitative description for the concept of ‘oxygen debt’
The physiological interpretation for the dynamics of HR/VO2responses at onset and
off-set of exercise may be associated with the term ‘oxygen debt’, as first coined by A. V. Hill and others [31]. According to the term ‘oxygen debt’ [31], the body’s carbohydrate stores are linked to energy ‘credits’. If these stored credits are expended during onset of exercise, then a ‘debt’ is occurred. The greater energy ‘deficit’, or use of available stored energy cred-its, the larger energy ‘debt’ occurs [10]. The ongoing oxygen uptake after onset of exercise is then thought to represent the metabolic cost of repaying this debt. This concept used financial-accounting terms to qualify exercise metabolism; in fact, it is still popularized to the day.
Currently, the precise biochemical explanation for offset of exercise is not possible because the specific chemical dynamics are still unclear [10]. A. V. Hill [31] first hypothe-sized that all energies generated during the offset period (the line shadowed area plus the cross line shadowed area betweent1andt2in Figure 4(a)) are thought to represent the
metabolic cost of repaying energy ‘debt’. However, this study proves that the amount of energy ‘debt’ is much larger than that of energy ‘deficit’, which means energy ‘debt’ is only a part of energies generated during the offset period. Instead, glycogenesis and all other processes related for the recovery of the body to its pre-exercise conditions also are taking place in the offset period.
The experimental observation (see section ‘Experiment’) has shown that the time con-stant at offset of exercise is larger than that at onset of exercise, meaning that the line shadowed area plus the cross line shadowed area in the offset period (see Figure 4(a)) is greater than the area of energy ‘deficit’ in the onset period. If the two line shadowed areas (the areas of energy ‘deficit’ and ‘debt’ in Figure 4(a)) could equal each other (the debt equals to the deficit), a question is raised: what does the extra area (the cross line shadowed area in Figure 4(a)) represents? According to the mass-energy equivalence rela-tion (E = MC2), any change in the energy of an object causes a change in the mass of that object. Thus, the extra cross line shadowed area perhaps implies there must exist an energy storage process, which converts the energy into ‘molecules’, and further causes a change in the body’s mass. As the specific chemical dynamics are still unclear [10], it might be safely concluded that any physiological process that contributes to the recovery of the body to its pre-exercise conditions may result in the appearance of such extra area, e.g., glycogenesis (a process of glycogen synthesis). For this reason, it is probably that the proposed elementC2is going to store this kind of energy, like the liver stores glycogen.
Overall, the model outputs indicate that the cross line shadowed area in Figure 4(b) is presumably equal to the one with the same mark in Figure 4(a).
Model verification
In order to verify the proposed modeling work, two independent and widely used metrics were used for comparative purposes. Root-mean-square-error (RMSE), as described in Equation (7), was calculated to provide a measure of the average error between the two waveforms.
RMSE=
n i=1
(x1,i−x2,i)2
n , (7)
wherex1,iandx2,iare theith sample from measured data and model output respectively andnis the number of samples. Correlation coefficient, as described in Equation (8), was used to provide a measure of the similarity in the shape of the model outputs versus the averaged experiment results.
μ= P1P2 |P1||P2|×
100%, (8)
whereP1andP2are the measured and estimated data in terms of HR and VO2response
Results
Parameter configuration
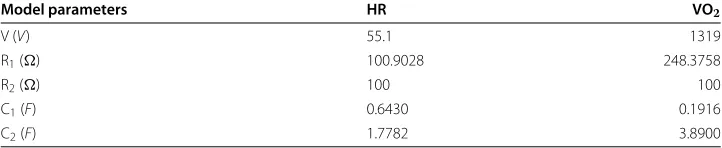
Based on the dynamic characteristics of observed HR and VO2and normalization process
shown in Table 3 and Equations (5) - (6) respectively, the tuned circuit model parameters for the proposed single-supply switching RC circuit model were demonstrated in Table 4. The tuned averaged models for both HR and VO2then were employed to simulate those
dynamic variations following both single-cycle square wave and interval training pro-tocols. The simulation was performed by the Matlab/Simulink module, and the timing of DPDT switching between exercise intensities strictly follows the reference protocols shown in Figure 1.
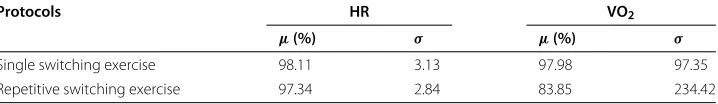
Comparison for single-cycle square wave protocol
Figure 5 was an example to show the model accuracy towards the single-cycle square wave protocol. The proposed model was first tuned by settings of parameters based on Table 4, then run in Matlab/simulink following proposed duty cycles of the predefined single-cycle square wave protocol. The mean and variance of the distributions can be found in Table 5. The RMSE of HR and VO2across the general average measurements of all subjects for the
proposed model was 3.13bpmand 97.35ml/minrespectively. The correlation coefficient between the actual measurements and model estimations was 98.11% and 97.98%. It can be seen in Figure 5 that the proposed model significantly performed the estimation of HR and VO2dynamics for an averaged general-population set following single switching
exercise protocols.
Comparison for interval training protocol
The subject AZAM was invited to perform the predefined interval training regarding the model verification for the repetitive switching exercise. Experimental results for both HR and VO2dynamics are shown in red curves of Figure 6. Of the three-cycle interval
train-ing exercise, model parameters were determined by ustrain-ing the first cycle measurement and those tuned circuit models for onset and offset exercises were accurately switched follow-ing the predefined protocol durations illustrated in Figure 1b. The dashed blue curves in Figure 6 indicate the model outputs of proposed interval training exercise for both HR and VO2dynamics of subject AZAM.
When comparing the model accuracy versus the observations from the specific-subject data following the repetitive switching exercise, based on correlation coefficients shown in Table 5, the model outputs can generally describe the dynamics of HR and VO2with a
high similarity (97.34% and 83.85%, respectively). When the RMSE for HR and VO2was
examined, it was evident that the model output for HR again were fairly accurate but that
Table 4 Parameter determination of the proposed single-supply switching RC circuit model for both averaged HR and VO2dynamics at onset and offset of exercise for twenty subjects
Model parameters HR VO2
V (V) 55.1 1319
R1() 100.9028 248.3758
R2() 100 100
C1(F) 0.6430 0.1916
Figure 5 The model outputs vs. the averaged experimental data of HR and VO2dynamics at onset
and offset of exercise.The bold lines indicate the baseline of steady state level and closely reflect metabolic rates at warm-up. The red curves indicate HR and VO2averaged data from experimental observations over twenty subjects. The dashed blue curves indicate the model outputs based on the determined parameters.
for VO2had errors with 234.42. This was primarily due to the presence of random errors,
which caused more variability of the repetitive exercise in the specific-subject data versus the averaged general-population data.
Discussion
This model was tested through those exercise protocols with few iterations of onset and offset periods, but even with more iterations, it enables estimates of the dynamic response of HR and VO2. The employed switching mechanism could well unify the difference
at onset and offset of exercise, as well as satisfy the requirement of the continuity of model outputs during switching. This feature results in an accurately quantitative anal-ysis for human exercise responses, and can further apply to regulating and improving cardiorespiratory fitness.
Currently, Azzam et al. developed a dual-supply threshold-based solution to simulate HR and VO2responses towards the interval training protocols, which employs dual power
supplies to set a threshold value for each onset and offset scenario [13]. Figure 7 shows the RC circuit introduced by Azzam et al. Although this model can well describe the switching properties during onset and offset of exercise, there are still some limitations since dynamical characteristics (i.e., time constant and steady state gain) of model are not allowed to re-shift back to their original states due to the effect ofVoff. It is probably inefficient when applying it to a single switching exercise, as it requires the metabolic rate can adaptively vary fromV1down to zero (see Figure 4). Compared with the one shown
Table 5 Statistics of correlations between actual data and model outputs
Protocols HR VO2
μ(%) σ μ(%) σ
Single switching exercise 98.11 3.13 97.98 97.35
Repetitive switching exercise 97.34 2.84 83.85 234.42
Figure 6 The model outputs vs. the experimental data of HR and VO2dynamics for subject AZAM
under the predefined interval training protocol.
in Figure 7, the proposed model provided sound results for both single and repetitive switching exercises.
Further investigation would be made to explore the subject-specific model across a pop-ulation of individuals, although it has been found the proposed model can work on the averaged experimental observations with acceptable correlations.
Moreover, to regulate the proposed switching model the implementation of bump-less switching between two or more higher dimensional systems based on multi-realization theory will also be discussed in the next step [32,33].
Conclusion
In this work a novel single-supply switching RC circuit model is presented to accom-modate the variations of onset and offset dynamics following both single-cycle square wave and interval training protocols. Twenty-one healthy untrained subjects were invited to participant the treadmill exercises. The portable gas analyzer K4b2was used to mea-sure breath-by-breath VO2and beat-by-beat HR values. It has been concluded that the
observed results can be reliably described by the proposed model. Unlike some other existing modeling works, it provided accurate analyses for the different responses of onset and offset exercises, guaranteed the continuity of model outputs during onset-offset
switching, and is capable of accommodating exercise strengths. The validity of the pro-posed model is confirmed by comparing the simulated model outputs with the averaged experimental observations. In the next step, a subject-specific model will be investigated and a general framework for the implementation of bump-less switching between two or more higher dimensional systems based on multi-realization theory [32,33] then will be developed for the issue of human exercise regulation.
Competing interests
The authors declare that they have no competing interests.
Authors’ contributions
YZ found the single-supply switching RC circuit model, and interpreted this model in physiological terms, provided a quantitative analysis for the concept of ’oxygen debt’, carried out the simulations, and drafted and revised the paper; AH performed the experiments; SWS supervised the overall project and checked the paper quality through the whole paper submission and revision processes; BGC supervised the project; AC, RD, and CD supported the experiment part related to interval training and exercise physiology; HTN supervised the project and revised the paper. All authors read and approved the final manuscript.
Acknowledgements
This work is supported by the Specialized Research Fund for the Doctoral Program of Higher Education, China (grant #20130185110023). The authors are thankful for the supports from the Centre for Health Technologies (the University of Technology, Sydney, Australia), the school of human movement studies (the Charles Sturt University, Australia), CSIRO ICT Centre, Sydney, Australia, and the Faculty of Aeronautics and Astronautics (the University of Electronic Science and Technology of China, Chengdu, China).
Author details
1The Faculty of Aeronautics and Astronautics, University of Electronic Science and Technology of China, 611731
Chengdu, China.2The Faculty of Engineering and IT, University of Technology, Sydney, Australia.3CSIRO ICT Centre, Sydney, Australia.4The Faculty of Health, University of Technology, Sydney, Australia.5School of Human Movement Studies, Charles Sturt University, Bathurst, Australia.
Received: 1 August 2014 Accepted: 5 October 2014 Published: 18 October 2014
References
1. Stewart S, Tikellis G, Carrington M, Walker K, O’Dea K:Australia’s Future Fat Bomb: A Report on the Long-term Consequences of Australia’s Expanding Waistline on Cardiovascular Disease. Australia: Preventive Cardiology at the Baker Heart Research Institute; 2008.
2. Astrand PO, Cuddy TE, Saltin B, Stenberg J:Cardiac output during submaximal and maximal work.J Appl Physiol 1964,9:268–274.
3. Castiglioni P, Parati G, Civijian A, Quintin L, Rienzo MD:Local scale exponents of blood pressure and heart rate variability by detrended fluctuation analysis: Effects of posture, exercise, and aging.IEEE Trans Biomed Eng 2009,56:675–684.
4. Freedman ME, Snider GL, Brostoff P, Kimelblot S, Katz LN:Effects of training on response of cardiac output to muscular exercise in athletes.J Appl Physiol1955,8:37–47.
5. Ishijima M, Togawa T:Chronodiagnostic acquisition of recovery speed of heart rate under bathing stress. Physiol Meas1999,20:369–375.
6. Paradiso M, Pietrosanti S, Scalzi S, Tomei P, Verrelli CM:Experimental heart rate regulation in cycle-ergometer exercises.IEEE Trans Biomed Eng2013,60:135–139.
7. Su SW, Celler BG, Savkin A, Nguyen HT, Cheng TM, Guo Y, Wang L:Transient and steady state estimation of human oxygen uptake based on noninvasive portable sensor measurements.Med Biol Eng Comput2009,
47:1111–1117.
8. American College of SportsMedicine:ACSM’s Guidelines for exercise testing and prescription (8th ed.)New York: Lippincott, Williams and Wilkins; 2010.
9. Duffeld R, Edge J, Bishop D:Effects of high-intensity interval training on the VO2response during severe exercise.J Sci Med Sport2006,9:249–255.
10. McArdle WD, Katch F, Katch VL:Exercise Physiology: Energy, Nutrition, and Human Performance. Philadelphia: Lea & Febiger; 1981.
11. Su SW, Chen W, Liu D, Fang Y, Kuang W, Yu W, Guo T, Celler B, Nguyen H:Dynamic modelling of heart rate response under different exercise intensity.Open Med Inform J2010,4:81–85.
12. Zhang Y, Su SW, Haddad A, Celler B, Nguyen HT:Onset and offset exercise response model in electronic terms.
InProceedings of the 9th IASTED International Conference on Biomedical Engineering: 15-17 February 2012. Edited by Hellmich C. Innsbruck. Austria: ACTA Press; 2012:122–128.
13. Haddad A, Zhang Y, Su SW, Branko C, Nguyen HT:Modelling and regulating of cardio-respiratory response for the enhancement of interval training.Biomed Eng OnLine2014,13:1–14.
15. Cheng TM, Savkin AV, Celler BG, Su SW, Wang L:Nonlinear modelling and control of human heart rate response during exercise with various work load intensities.IEEE Trans Biomed Eng2008,55:2499–2508.
16. Hajek M, Potucek J, Brodan V:Mathematical model of heart rate regulation during exercise.Automatica 1980,
16:191–195.
17. Meste O, Khaddoumi B, Blain G, Bermon S:Time-varying analysis methods and models for the respiratory and cardiac system coupling in graded exercise.IEEE Trans Biomed Eng2005,52:1921–1930.
18. Wang L, Su SW, Celler BG, Chan GSH, Cheng TM, Savkin AV:Assessing the human cardiovascular response to moderate exercise: feature extraction by support vector regression.Physiol Meas2009,30:227–244. 19. Fukuba Y, Hara K, Kimura Y, Takahashi A, Ward SA, Whipp BJ:Estimating the parameters of aerobic function
during exercise using an exponentially increasing work rate protocol.Med Biol Eng Comput2000,38:433–437. 20. Li X, Bai J:Computer simulation of the baroregulation in response to moderate dynamic exercise.Med Biol
Eng Comput2000,39:480–487.
21. Magosso E, Ursino M:Cardiovascular response to dynamic aerobic exercise: a mathematic model.Med Biol Eng Comput2002,40:660–674.
22. Bradfield RB:A technique for determination of usual daily energy expenditure in the field.Am J Clin Nutr1971,
24:1148–1154.
23. Crory MAM, Mole PA, Nommsen-Rivers LA, Dewey KG:Between-day and within-day variability in the relation between heart rate and oxygen consumption: effect on the estimation of energy expenditure by heart-rate monitoring.Am J Clin Nutr1997,66:18–25.
24. Bouchard DR, Trudeau F:Reliability of the assessment of the oxygen/heart rate relationship during a workday.Appl Ergon2007,38:491–497.
25. Inbar O, Oten A, Scheinowitz M, Rotstein A, Dlin R, Casaburi R:Normal cardiopulmonary responses during incremental exercise in 20-70-yr-old men.Med Sci Sport Exerc1994,26:538–546.
26. Achten J, Jeukendrup AE:Heart rate monitoring applications and limitations.Sports Med2003,33:517–538. 27. Duffield R, Dawson B, Pinnington HC, Wong P:Accuracy and reliability of a cosmed k4b2portable gas analysis
system.J Sci Med Sport2004,7:11–22.
28. Pinnington HC, Wong P, Tay J, Green D, Dawson B:The level of accuracy and agreement in measures of feo2, feco2, ve, between the cosmed k4b2portable, respiratory gas analysis system and a metabolic cart.J Sci Med Sport2001,4:324–335.
29. Su SW, Wang L, Celler BG, Savkin AV, Guo Y:Identification and control for heart rate regulation during treadmill exercise.IEEE Trans Biomed Eng2007,54:1238–1246.
30. Heyward VH:Advanced Fitness Assessment and Exercise Prescription - 5th Ed. Human Kinetics. USA: Human Kinetics; 2006. 31. Hill AV:Muscular exercise, lactic acid and the supply and utilization of oxygen.Proc R Soc Lond (Biol)1924,
96:438–475.
32. Anderson BDO, Su SW, Brinsmead TS:Multi-realization of linear multi-variable systems.IEEE Trans Circuits Sys II 2005,52:442–446.
33. Su SW, Anderson BDO, Brinsmead TS:The minimal multi-realization of linear multi-variable systems.IEEE Trans Automatic Control2006,54:690–695.
doi:10.1186/1475-925X-13-145
Cite this article as:Zhanget al.:An equivalent circuit model for onset and offset exercise response.BioMedical Engineering OnLine201413:145.
Submit your next manuscript to BioMed Central and take full advantage of:
• Convenient online submission
• Thorough peer review
• No space constraints or color figure charges
• Immediate publication on acceptance
• Inclusion in PubMed, CAS, Scopus and Google Scholar
• Research which is freely available for redistribution