WA
GE DEVELOPMENTS AND PRICE CHANGES IN LITHUANIA.
IS IT POSSIBLE TO IMPROVE THE QUALITY OF LIFE?
Dalia Karlaitė
Vilniaus kolegija/University of Applied Sciences, Lithuania
Abstract
Purpose – to explore the paces of wage developments and price changes in Lithuania. Design/methodology/approach – analysis and synthesis of scientific literature, analysis and comparison of statistical data.
Originality/Value – the wage developments, expenditure of households by consumption purpose and price changes in Lithuania are disclosed and the paces are compared with other EU countries.
Findings – according to the statistical data, the pace of price changes is slower comparing with wage developments in Lithuania. Unfortunately, the society reacts more sensitive to price changes than wage developments.
Practical implications – it is necessary for society to realise that not only the prices of products and services are changing significantly, but the wages develops too. To convert the today's prices into litas does no longer make sense.
Keywords: quality of life, wage developments, consumption, price changes. Research type: general review
Introduction
The concept of ‘quality of life’ for a long time has been associated with the person's mental or physical well-being. Nowadays the quality of life and human development are becoming more and more evident. There are discussed such aspects as an adequate quality of life, ensuring personal dignity and freedom of choice, equal rights and opportunities, and so on. Material welfare and money are becoming one of the main factors of quality of life.
Quality of life, as like as a standard of living, well-being or welfare (and sometimes linked with life satisfaction or even happy life) is a concept which describes a good life. It is important for each person to have a job position and earn income in order to meet their needs and perceive the quality of life as adequate. So the purpose of this article is to explore the paces of wage developments and price changes in Lithuania.
Theoretical aspects of improving the quality of life
Clarke (2003)explains, that a standard of living is a narrow economic measure of welfare, which is based on material goods and consumption levels. Mitra (2006) reminds that the standard of living is traditionally measured by the ‘ability to buy a basket of commodities’; also measured in terms of utility, where utility is meant as pleasure and happiness, or as a tool for valuation and choice.
To evaluate the well-being (also called as a subjective quality of life) are used subjective indicators: happiness, satisfaction with life and others. To evaluate the economic welfare are used the objective indicators, mostly presented in monetary units, such as income or consumption. (Krutulienė, 2012). Moreover, individuals mostly link their personal quality of life with income and possibilities to satisfy their not only basic needs.
The quality of life is a multi-dimensional term that includes material and non-material, objective and subjective, individual and collective components of welfare, emphasizing ‘better’ instead of ‘more’ (Krutulienė, 2012). It is quite logical that if a person feels that his or her objective quality of life is improving, he or she will perceive that a subjective quality of life also improves.
Both objective and subjective measurements and various indicators are used to assess the quality of life. According to the limited volume of this article, in the next section will be examined only objective indicators (such as wage developments, consumption expenditures and price changes) of quality of life in Lithuania in the period 2003 - 2016.
Wage developments and price changes in Lithuania
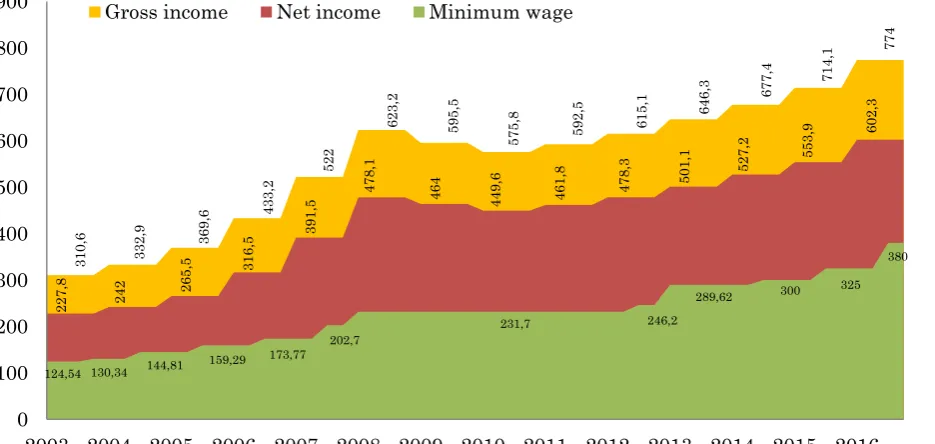
The earnings is a key factor in personal consumption, as first of all we need to get some money to have a possibility to spend them. Graph bellow shows the variations of average (median) monthly gross and net income and minimum wage set by the government in Lithuania in 2003 – 2016.
Source: Eurostat, 2017b
Figure 1. Average (median) monthly gross and net income and comparison with set minimum wage in Lithuania, Eur/month
31
0,6 332,9 36
9,6 43
3,2
522
62
3,2
59
5,5
57
5,8 592,5 615,1 64
6,3 677,4 71
4,1 774
22
7,8 242 26
5,5 31
6,5
39
1,5
47
8,1
464 449,6 461,8 47
8,3 501,1 52
7,2 553,9
60
2,3
124,54 130,34 144,81 159,29
173,77 202,7
231,7 246,2
289,62 300 325
380
0 100 200 300 400 500 600 700 800 900
2003 2004 2005 2006 2007 2008 2009 2010 2011 2012 2013 2014 2015 2016
Income of employees were increasing till 2008 (by around one fifth each year from 2004 till 2008), but is clearly seen that in the period of 2008 – 2010 the income were decreasing because of the financial crisis (the only calming fact is that the pace of the decrease was not so rapid, but it should not be forgotten that a quite significant part of citizens lost their job positions during this period). The economy of the country started to recover from 2011, but the growth rates observed before the crisis is not yet reached.
The minimum wage set by the government was increased several times in the period of 2003 – 2016. The following changes are noticeable:
During the period of 2003 – 2007 the minimum wage was increased 5 times - averagely by 14,5 Eur each time (Resolutions: No 937 of 18 July 2003; No 316 of 24 March 2004; No 361 of 4 April 2005; No 298 of 27 March 2006 and No 543 of 6 June 2007 of the Government of the Republic of Lithuania);
In the beginning of 2008 it was increased by 29 Eur and was equal to 231,7 Eur/month in the period of financial crisis (remained until July of 2012) (Resolution No 1368 of 17 December 2007);
From august 2012 the minimum wage was increased by 14,5 eur, but only for 5 month (Resolution No 718 of 20 June 2012);
In the beginning 2013 the minimum wage was re-raised by 57,9 Eur (Resolution No 1543 of 19 December 2012);
In 2014 the increase was only by 10,4 Eur (for a minimum salary of 300 Eur/month) (Resolution No 972 of 24 September 2014);
From 1 July 2015 the minimum wage was increased by 25 Eur (Resolution No 615 of 17 June 2015);
In 2016 the minimum wage was increased twice: the first one again by 25 Eur (Resolutions No 1240 of 2 December 2015) and the second one by 30 Eur; it is equal 380 Eur/month and valid till today (Resolution No 644 of 22 June 2016).
Therefore, the person who earns the gross monthly income equal to 380 Eur actually receives 335,30 Eur (calculated on the condition that the person has no children and no disability, and also does not accumulate 2% of the salary for the II pillar pension) (According to salary calculator online1).
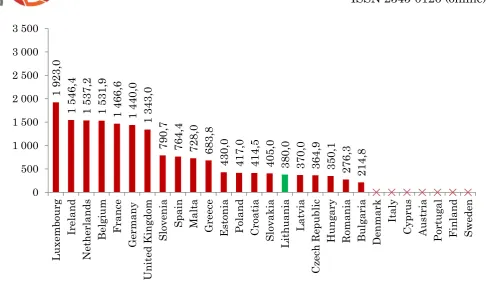
Despite the recent increases of the minimum wage in recent years, Lithuania is still the outsider on the EU-28 list (see figure 2). The fact that in other EU countries the minimum monthly wages exceed the Lithuanian one from a couple to five times is a considerable dissatisfaction among citizens. Discussions to increase the minimum wage is undesirable for business representatives, especially for SMEs, as mostly the minimum wage is paid for the unqualified workforce.
* There are no approved minimum wages in seven EU countries. Source: Eurostat, 2017c
Figure 2. Minimum wages in EU-28 in the end of 2016, Eur/month
However, it should be noted that the figures in the graph above are gross ones (i.e., before deduction of taxes, such as income tax and social security contribution). And, e.g., the income tax in EU-28 countries varies from 10% (10% in Bulgaria, 15% in Lithuania, Hungary and the Czech Republic, 16% in Romania) to 57,1% (50% in Austria and Slovenia, 50,2% in France, 51,6% in Finland, 52% in the Netherlands, 53,7% in Belgium, 55,8% in Denmark, 57,1% in Sweden), the EU-28 average is 39% (European Union, 2016), moreover the different methodologies are applied (e.g. progressive income tax rates are applied in Austria, Belgium, Croatia, Cyprus, Finland, Germany, Greece, Ireland, Italy, Luxemburg, Poland, Slovakia, Slovenia, Spain, Sweden, United Kingdom) (European Union, 2017). There are discussions to apply progressive income tax in Lithuania too.
About one fifth of employees receive the minimum wage in Lithuania. Approximately half of them receive a minimum wage working full time (the another part of them are non-full-time employees). Getting just the minimum wage and no other informal income means that livelihood is not easy, so the size of the minimum wage is particularly important for the most vulnerable sections of the population (Finansistas.net, 2017). Minimum wage plays a crucial role in reducing the depth of poverty and social exclusion. However, the minimum wage does not provide people with a dignified standard of living, and many countries are still lagging behind this target (Socmodelis.lt, n.d.).
For comparison, the median (recognised as ‘middle’ one) wages in the EU-28 countries are shown in the graph below (see figure 3).
Source: Eurostat, 2017b
Figure 3. Median income in EU-28 in 2015, Eur/month
Comparing median income and minimum wages in EU-28, we could clearly see that, for example, the established minimum wage is lower in Latvia than in Lithuania, but the median monthly wage exceeds the Lithuanian one, while Croatia has set a higher minimum wage but the median wage is slightly lower than in Lithuania. Summarising, in most EU countries median wage is higher than minimum wage starting from couple of hundreds till more than thousand euros.
The level of income of a person or a household affects not only person's physical health (the higher income is linking with healthier nutrition, better housing or better quality health services), this also affects the mental health of a person, which provokes to evaluate the social level of individuals or households according to their income (Saniukaitė, 2015).
It is abnormal that the income of working people is not enough for the dignity of their families to live. Women and children are still predominantly affected by the poverty, because of unemployment, temporary and low-paid jobs, wage disparities and lower social and old-age pensions. Elderly people are also at greater risk of poverty. One of the main and most effective tools of combating the poverty in the country is the guarantee of minimum income in order to help these people get out of poverty and enable them to live under decent conditions.
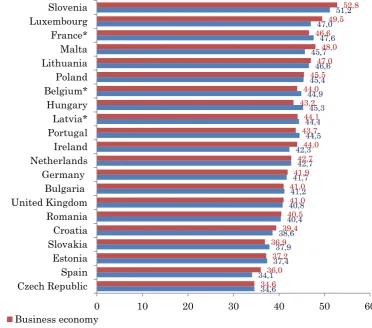
No less eloquent indicator is monthly minimum wage as a proportion of average monthly earnings (%) (see figure 4) as it shows the minimum wage level and purchasing power in comparison to the average income earned by the resident (which can not be shown by the nominal numbers of the minimum wage) (Rakauskienė at al, 2015). 2 92 8 2 31 3 2 17 4 1 94 8 1 89 5 1 76 1 1 76 5 1 70 5 1 74 8 1 75 1 1 68 7 1 31 8 1 29 0 1 13 5 1 10 4 1 11 1 1 01 2
688 637 623 600 563
465 421 461 446 377 270 188 0 500 1 000 1 500 2 000 2 500 3 000 3 500 Lu xem bourg D
enmark Sw
* - the latest available data in 2014 Source: Eurostat, 2017d
Figure 4. Monthly minimum wage as a proportion of the mean value of average monthly income in 2015, %
According to this statistical data we could state that in Lithuania the minimum wage is not so small (Lithuania is in the fifth place) and in such countries as Germany or Netherlands the minimum wage is relatively lower than in Lithuania.
From October 1, 1990 till August 1, 2008 the Law No I-618 (on Individual Income guarantees) of 27 September 1990 of the Republic of Lithuania has established the principles for supporting the income of the population, taking into account the minimum standard of living and dynamics of prices. There were stated, that “minimum standard of living (MSL) is the monthly amount of family income per person and guaranteeing a minimal and socially acceptable level of satisfaction to the needs of all members, which corresponds to the body's dietary needs in accordance with physiological standards, as well as the minimum needs of clothing, footwear, furniture, household, sanitary and hygiene items, and apartment, communal, domestic, transport, communications, cultural and educational services” (Law No I-618 of 27 September 1990). In August 1, 2008 the minimum standard of living (MSL) was replaced by basic social benefit (BSB) - it is an indicator for defining and calculating social security benefits and other statutory values (Law No X-1710 of 15 July 2008).
34,6 34,1
37,4 37,9
38,6 40,4
40,8 41,2 41,7
42,7 42,3
44,5 44,4 45,3 44,9 45,4
46,6 45,7
47,6 47,0
51,2
34,6 36,0
37,2 36,9
39,4 40,5
41,0 41,0 41,9
42,7 44,0 43,7 44,1 43,2
44,0 45,5
47,0 48,0 46,6
49,5 52,8
0 10 20 30 40 50 60
Czech Republic Spain Estonia Slovakia Croatia Romania United Kingdom Bulgaria Germany Netherlands Ireland Portugal Latvia* Hungary Belgium* Poland Lithuania Malta France* Luxembourg Slovenia
Business economy
Although according to the previous researches, the increase of income usually changes the satisfaction with life of poor people. They believe in such a regularity: the more money they have – the more satisfaction and happiness they feel. However, when the income reaches the average level at developed countries, the further growth of income do not significantly increase the welfare of the population (Servetkienė, 2012).
Household consumption expenditure is an important ecologic and economic variable. First of all, this is one of the main indicators presenting the overall level of well-being. In addition, households' decisions on what part of their revenues is used for consumption and what part is for savings are a key factor for the progress and prosperity in the future (Ūsaitė, 2008).
The living standards of the population are clearly reflected in the distribution of consumption expenditure and one of the most important indicators in this area is the expenditure on food. According to this indicator one can judge the country's standard of living – the lower the share of expenditure on food, the higher is the living standards of the population (Lisauskaitė, 2010; Rakauskienė at al, 2015).
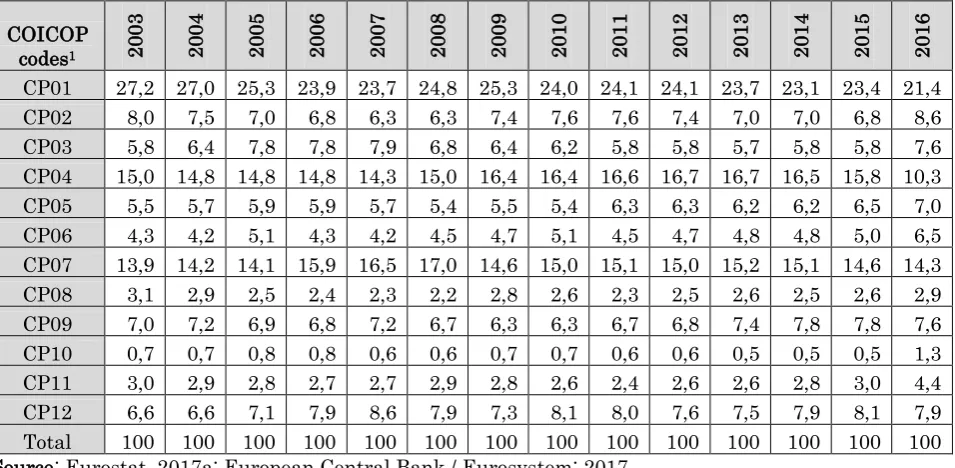
The most part of final consumption expenditure of households is on food (CP01), housing (CP04) and transport (CP07), and takes averagely 54,7 percent (look table 1).
Table 1. Final consumption expenditure of households by consumption purpose in Lithuania, %
COICOP codes1 200
3
200
4
200
5
200
6
200
7
200
8
200
9
201
0
201
1
201
2
201
3
201
4
201
5
201
6
CP01 27,2 27,0 25,3 23,9 23,7 24,8 25,3 24,0 24,1 24,1 23,7 23,1 23,4 21,4
CP02 8,0 7,5 7,0 6,8 6,3 6,3 7,4 7,6 7,6 7,4 7,0 7,0 6,8 8,6
CP03 5,8 6,4 7,8 7,8 7,9 6,8 6,4 6,2 5,8 5,8 5,7 5,8 5,8 7,6
CP04 15,0 14,8 14,8 14,8 14,3 15,0 16,4 16,4 16,6 16,7 16,7 16,5 15,8 10,3
CP05 5,5 5,7 5,9 5,9 5,7 5,4 5,5 5,4 6,3 6,3 6,2 6,2 6,5 7,0
CP06 4,3 4,2 5,1 4,3 4,2 4,5 4,7 5,1 4,5 4,7 4,8 4,8 5,0 6,5
CP07 13,9 14,2 14,1 15,9 16,5 17,0 14,6 15,0 15,1 15,0 15,2 15,1 14,6 14,3
CP08 3,1 2,9 2,5 2,4 2,3 2,2 2,8 2,6 2,3 2,5 2,6 2,5 2,6 2,9
CP09 7,0 7,2 6,9 6,8 7,2 6,7 6,3 6,3 6,7 6,8 7,4 7,8 7,8 7,6
CP10 0,7 0,7 0,8 0,8 0,6 0,6 0,7 0,7 0,6 0,6 0,5 0,5 0,5 1,3
CP11 3,0 2,9 2,8 2,7 2,7 2,9 2,8 2,6 2,4 2,6 2,6 2,8 3,0 4,4
CP12 6,6 6,6 7,1 7,9 8,6 7,9 7,3 8,1 8,0 7,6 7,5 7,9 8,1 7,9
Total 100 100 100 100 100 100 100 100 100 100 100 100 100 100
Source: Eurostat, 2017a; European Central Bank / Eurosystem; 2017
In the period under consideration, averagely 24,4% of final consumption expenditure of Lithuania's households was spent on food and non-alcoholic beverages (it is pleasing that this share gradually was decreasing from quarter in 2009 to almost
1 COICOP codes: CP01 - Food and non-alcoholic beverages; CP02 - Alcoholic beverages, tobacco and
one fifth in 2016; therefore, it can be stated that the standard of living in the country was improved as the share of expenditure on foodstuffs is decreasing; hopefully, it will be continuing in the nearest future and at a faster pace). Also, 2016 versus 2015, expenditures on housing decreased by one-third (this could be explained due to the more cost-effective new-build houses and the growing use of renewable for heating and electricity). However, 2016 versus 2015, expenditure on education increased in 2,6 times (the from 0,5% to 1,3%), expenditures spent on clothing and footwear, health, restaurants and hotels, alcoholic beverages and tobacco were increased by one third.
It is still disappointing fact, that in Lithuania households spend more than quarter of expenditures on food and non-alcoholic beverages (see figure 5) and bigger part is spent only in Romania (29,4%).
Source: Eurostat, 2017a
Figure 5. Final consumption expenditure of households by consumption purpose in Europe Union in 2015, %
But expenditures on housing, water, electricity, gas and other fuels was one of the smallest (less only Cyprus (10,1%) comparing with other EU countries.
Changes in consumer prices are the another one hot topic in Lithuania. Statistics still announce that prices are not increasing rapidly (look table 2), while people are sharing in social media and comparing the numbers in their vouchers for goods and services - it is clearly seen that nowadays the prices are higher than a year ago.
29,4 23,4 20,7 18,8 18,7 18,2 17,8 17,0 16,9 16,6 16,1 15,4 14,7 14,3 13,4 13,3 13,3 12,5 12,4 12,4 12,3 11,7 11,3 10,5 9,9 9,5 9,2 8,4
21,5 15,8 18,0 22,0 18,6 19,1
24,9 18,8 21,5 20,6 25,9 18,8 16,6 23,8 23,0 26,3
24,4 26,0 10,1 28,2
24,4 23,8 29,7 24,0 22,7
24,6 23,9 25,7
11,3 14,6 10,9 11,7 15,4 12,7 7,5 12,7 12,2 13,8 9,6
16,0 11,7 12,0
10,8 12,9 11,0 12,7
12,0 11,7
13,0 12,6 11,7
14,4 11,7 13,0
16,1 14,0
0 10 20 30 40 50 60 70 80 90 100
Romania Lithuania Estonia Latvia Bulgaria Hungary Slovakia Portugal Poland Greece Czech Republic Slovenia Cyprus Italy Spain France Belgium Sweden Malta Finland EU-28 Netherlands Denmark Germany Austria Ireland Luxembourg United Kingdom
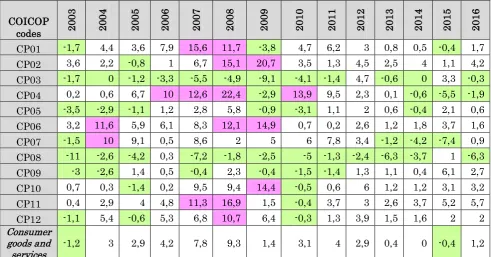
Table 2. Changes in consumer prices calculated on the basis of the consumer price index in Lithuania, % (compared to the previous period)
COICOP codes 200
3
200
4
200
5
200
6
200
7
200
8
200
9
201
0
201
1
201
2
201
3
201
4
201
5
201
6
CP01 -1,7 4,4 3,6 7,9 15,6 11,7 -3,8 4,7 6,2 3 0,8 0,5 -0,4 1,7
CP02 3,6 2,2 -0,8 1 6,7 15,1 20,7 3,5 1,3 4,5 2,5 4 1,1 4,2
CP03 -1,7 0 -1,2 -3,3 -5,5 -4,9 -9,1 -4,1 -1,4 4,7 -0,6 0 3,3 -0,3
CP04 0,2 0,6 6,7 10 12,6 22,4 -2,9 13,9 9,5 2,3 0,1 -0,6 -5,5 -1,9
CP05 -3,5 -2,9 -1,1 1,2 2,8 5,8 -0,9 -3,1 1,1 2 0,6 -0,4 2,1 0,6
CP06 3,2 11,6 5,9 6,1 8,3 12,1 14,9 0,7 0,2 2,6 1,2 1,8 3,7 1,6
CP07 -1,5 10 9,1 0,5 8,6 2 5 6 7,8 3,4 -1,2 -4,2 -7,4 0,9
CP08 -11 -2,6 -4,2 0,3 -7,2 -1,8 -2,5 -5 -1,3 -2,4 -6,3 -3,7 1 -6,3
CP09 -3 -2,6 1,4 0,5 -0,4 2,3 -0,4 -1,5 -1,4 1,3 1,1 0,4 6,1 2,7
CP10 0,7 0,3 -1,4 0,2 9,5 9,4 14,4 -0,5 0,6 6 1,2 1,2 3,1 3,2
CP11 0,4 2,9 4 4,8 11,3 16,9 1,5 -0,4 3,7 3 2,6 3,7 5,2 5,7
CP12 -1,1 5,4 -0,6 5,3 6,8 10,7 6,4 -0,3 1,3 3,9 1,5 1,6 2 2
Consumer goods and
services -1,2 3 2,9 4,2 7,8 9,3 1,4 3,1 4 2,9 0,4 0 -0,4 1,2
Explanation: green - decrease (positive aspect); pink - increase in prices by more than 10%. Source: Statistics Lithuania, 2017
Consumer price index (CPI) measures changes in the price level of market basket of consumer goods and services purchased by households. According to the statistical data, the pace of price changes is slower (increased averagely by 2,8%; the prices of food and non-alcoholic beverages increased by 3,9%) comparing with wage developments (increased averagely by 8,1%) in Lithuania. Unfortunately, the society reacts more sensitive to price changes than wage developments and they are still converting the today's prices into litas, that does no longer make sense.
Conclusions
According to the statistical data, the pace of price changes is slower comparing with wage developments in Lithuania. Unfortunately, the society reacts more sensitive to price changes than wage developments.
It is necessary for society to realise that not only the prices of products and services are changing significantly, but the wages develops too. To convert the today's prices into litas does no longer make sense.
References
Clarke, M. (2003). Is economic growth desirable? A welfare economic analysis of the Thai experience (Doctoral dissertation, Victoria University).
European Central Bank / Eurosystem (2017). Harmonised indices of consumer prices, breakdown
by purpose of consumption: 2017. Retrieved from
European Union. (2017). Income taxes abroad. Retrieved from http://europa.eu/youreurope/citizens/work/taxes/income-taxes-abroad/index_en.htm
European Union. (2016). Taxation Trends in the European Union. Retrieved from http://ec.europa.eu/taxation_customs/sites/taxation/files/resources/documents/taxation/gen_info/economi c_analysis/tax_structures/2016/econ_analysis_report_2016.pdf
Eurostat. (2017a). Final consumption expenditure of households by consumption purpose -
COICOP 3 digit - aggregates at current prices [online]. Retrieved from
http://ec.europa.eu/eurostat/en/web/products-datasets/-/NAMA_CO3_C
Eurostat. (2017b). Median equivalised disposable income, 2011 (PPS). Retrieved from http://appsso.eurostat.ec.europa.eu/nui/show.do?dataset=ilc_di03&lang=en
Eurostat. (2017c). Monthly minimum wages - bi-annual data. Retrieved
from http://appsso.eurostat.ec.europa.eu/nui/show.do?dataset=earn_mw_cur&lang=en
Eurostat. (2017d). Monthly minimum wage as a proportion of average monthly earnings (%) -
NACE Rev. 2 (from 2008 onwards). Retrieved
from http://appsso.eurostat.ec.europa.eu/nui/show.do?dataset=earn_mw_avgr2&lang=en
Finansistas.net. (2017). Minimalus atlyginimas. Retrieved
from http://www.finansistas.net/minimalus-atlyginimas.html
Krutulienė, S. (2012). Gyvenimo kokybė: sąvokos apibrėžimas ir santykis su gero gyvenimo terminais. Kultūra ir visuomenė: socialinių tyrimų žurnalas, 2012, nr. 3 (2), p. 117-130.
Law No I-618 of 27 September 1990 of the Republic of Lithuania. Retrieved from https://www.e-tar.lt/portal/lt/legalAct/TAR.983975D33B37
Law No X-1710 of 15 July 2008 of the Republic of Lithuania. Retrieved from https://www.e-tar.lt/portal/lt/legalAct/TAR.821DEBBBD657
isauskaite, V. (2010). Differentiation of income and consumption of the Lithuanian population/Lietuvos gyventoju pajamu ir vartojimo diferenciacija. Business: Theory and Practice, 11(3), 266-266.
Mitra, S. (2006). The capability approach and disability. Journal of disability policy studies, 16(4), 236-247.
Rakauskienė, O. G. et al. (2015). Gyvenimo kokybės matavimo rodiklių sistema ir vertinimo modelis : mokslo studija. Mykolo Romerio universitetas. Vilnius : Mykolo Romerio universitetas.
Resolution No 937 of 18 July 2003 of the Government of the Republic of Lithuania. Retrieved from https://www.e-tar.lt/acc/legalAct.html?documentId=TAR.36C9DBB1B294&lang=lt
Resolution No 316 of 24 March 2004 of the Government of the Republic of Lithuania. Retrieved from https://www.e-tar.lt/portal/lt/legalAct/TAR.51A3BFB3005D
Resolution No 361 of 4 April 2005 of the Government of the Republic of Lithuania. Retrieved from https://www.e-tar.lt/portal/lt/legalAct/TAR.A70EE54E0672/TAIS_273061
Resolution No 298 of 27 March 2006 of the Government of the Republic of Lithuania. Retrieved from https://www.e-tar.lt/portal/lt/legalAct/TAR.198C391E4990
Resolution No 543 of 6 June 2007 of the Government of the Republic of Lithuania. Retrieved from https://www.e-tar.lt/portal/lt/legalAct/172d7630394911e69101aaab2992cbcd
Resolution No 1368 of 17 December 2007 of the Government of the Republic of Lithuania. Retrieved from https://www.e-tar.lt/portal/lt/legalAct/TAR.815E1DB734B5
Resolution No 718 of 20 June 2012 of the Government of the Republic of Lithuania. Retrieved from https://www.e-tar.lt/portal/lt/legalAct/TAR.EA71A4C56AA9
Resolution No 1543 of 19 December 2012 of the Government of the Republic of Lithuania. Retrieved from https://www.e-tar.lt/portal/lt/legalAct/TAR.C9E3CDAA49A3
Resolution No 972 of 24 September 2014 of the Government of the Republic of Lithuania. Retrieved from https://www.e-tar.lt/portal/lt/legalAct/ff85023044af11e483c6e89f9dba57fd
Resolution No 615 of 17 June 2015 of the Government of the Republic of Lithuania. Retrieved from https://www.e-tar.lt/portal/lt/legalAct/0458f2e0166e11e58569be21ff080a8c
Resolution No 1240 of 2 December 2015 of the Government of the Republic of Lithuania. Retrieved from https://www.e-tar.lt/portal/lt/legalAct/44c9d1009a7b11e58fd1fc0b9bba68a7
Resolution No 644 of 22 June 2016 of the Government of the Republic of Lithuania. Retrieved from https://www.e-tar.lt/portal/lt/legalAct/172d7630394911e69101aaab2992cbcd
Servetkienė, V. (2013). Gyvenimo kokybės daugiadimensis vertinimas, identifikuojant kritines
sritis (Doctoral dissertation, Mykolas Romeris University).
Servetkienė, V. (2012). Gyvenimo kokybė Lietuvoje: subjektyvus situacijos vertinimas ir realybė. Ekonomika ir vadyba: aktualijos ir perspektyvos: mokslo darbai, (4), 20-35.
Socmodelis.lt. (n.d.). Priedas Nr. II-9 Minimaliu pajamu garantiju lygi ir ju adekvatuma minimaliems gyventoju vartojimo poreikiams ivertinimas. Retrieved from http://www.socmodelis.lt/wp-content/uploads/II-91.pdf
Statistics Lithuania. (2017). Vartotojų kainų pokyčiai, apskaičiuoti pagal vartotojų kainų
indeksą. Retrieved from
http://osp.stat.gov.lt/web/guest/statistiniu-rodikliu-analize?portletFormName=visualization&hash=345d76f2-4627-4c1e-b147-7bbc74469ebe
Ūsaitė, A. (2008). Namų ūkio vartojimo pokyčiai Lietuvoje 1996-2006 metais (Master thesis, Vytautas Magnus University).
This work is licensed under a Creative Commons Attribution-NonCommercial 4.0 International License.