Annals of Pure and Applied Mathematics Vol. 6, No. 2, 2014,199-206
ISSN: 2279-087X (P), 2279-0888(online) Published on 4 August 2014
www.researchmathsci.org
199
Annals of
An Effective Modification to Solve Transportation
Problems: A Cost Minimization Approach
Mollah Mesbahuddin Ahmed1, Abu Sadat Muhammad Tanvir2, Shirin Sultana3 Sultan Mahmud4 and Md. Sharif Uddin5
1
Department of Science & Humanities, Military Institute of Science and Technology (MIST), Dhaka, Bangladesh. Email: [email protected]
2
Department of Civil Engineering, Military Institute of Science and Technology (MIST) Dhaka, Bangladesh. Email: [email protected]
3
Department of Natural Science, Daffodil International University, Dhaka. Bangladesh Email: [email protected]
4
Department of Mathematics, Jahangirnagar University. Savar, Dhaka, Bangladesh Email: [email protected]
5
Department of Mathematics, Jahangirnagar University. Savar, Dhaka, Bangladesh Email: [email protected]
Received 23 July 2014; accepted 3 August 2014
Abstract. It is well-known that Linear Programming Problem (LPP) is one of the most potential mathematical tools for efficient allocation of operational resources. Many problems in real situation can be formulated as LPP. When a situation can be entirely modeled as a network, very efficient algorithms exist for the solution of the optimization problem which is many times more efficient than the solution methods of LPP. Transportation problems (TP), as is known, are a basic network problem which can be formulated as a LPP. The main objective of TP is to minimize the transportation cost of distributing a product from a number of sources (e.g. factories) to a number of destinations (e.g. ware houses). It is to be mentioned that Balanced TP and Unbalanced TP are the types of TP. If the sum of the supplies of all the sources is equal to the sum of the demands of all the destinations, the problem is termed as a balanced transportation problem. Again, if the sum of the supplies of all the sources is not equal to the sum of the demand of all the destinations, the problem is termed as unbalanced transportation problem. Here we have developed a new method of finding an Initial Basic Feasible Solution (IBFS) for both the Balanced TP and Unbalanced TP.
Keywords: LPP, TP, Transportation Cost, IBFS
AMS Mathematical Subject Classification (2010): 05C78
1. Introduction
200
finding an IBFS of TP which consider the north-west-corner cost cell at every stage of allocation. Then the Least Cost Method (LCM) [2,9] consists in allocating as much as possible in the lowest cost cell of the Transportation Table (TT) in making allocation in every stage. Vogel’s Approximation Method (VAM) [7,10,11,14] and Extremum Difference Method (EDM) [8] provides comparatively better Initial Basic Feasible Solution. The problem of minimizing transportation cost has been studied since long and is well known [7,8,11,13,14]. In this work we have added a new algorithm that provides a better IBFS, for both the balanced and unbalanced TP, than those algorithms just mentioned.
TP in general are concerned with distributing any single commodity from any group of supply centre, called sources, to any group of receiving centre, called destinations. A destination can receive its demand from one or more sources. Each source has a fixed supply of units, where the entire supply must be distributed to the destinations. Similarly, each destination has fixed demand of units, where the entire demand must be received from the sources.
2. Cost minimization TP
A cost minimization TP is formulated as
Minimize:
∑
∑
= =
= n
j
j i j i m i
x c z
1 1
subject to
∑
=
≤
n
j
i j
i a
x
1
; i=1,2,...,m
∑
=
≥
m
i
j j
i b
x 1
; j=1,2,...,n
xij≥0 for all i and j.
where
i =1, 2,……, m is the set of origins.
j =1, 2,……, n is the set of destinations.
xij = the quantity transported from the i-th origin to the j-th destination.
cij = per unit cost in transporting goods from i-th origin to the j-th
destination.
ai = the amount available at the i-th origin.
bj = the demand of the j-th destination.
Approach
201
3. Proposed method of finding IBFS
Idea of this method is developed from VAM. The proposed method can be applied to solve all types of TP. Procedure of finding an IBFS using this method is illustrated below.
Step 1 Subtract each of the elements of every row from the largest entry of that row of the Transportation Table and place them on the right-top of the corresponding elements.
Step 2 Apply the same operation on each of the elements of every column and place them on the right-bottom of the corresponding elements.
Step 3 Form a modified transportation table whose elements remain same and place the magnitude of the subtraction of right-top and right-bottom entry of Step 1 and Step 2 on the right-bottom of the corresponding elements.
Step 4 Place the row distribution indicators (RDI) and the column distribution indicators (CDI) just after and below the supply limits and demand requirements respectively within first bracket, which are the difference of the largest and nearest-to-largest right bottom entries. If there are two or more largest entries, the result is to be considered as zero.
Step 5 Identify the highest distribution indicator. Choose the lowest element along the highest distribution indicator. If there are two or more highest indicators, choose the highest indicator along which the smallest cost unit is present. If there are two or more number of smallest elements, choose any one of them arbitrarily.
Step 6 Allocate xij = min(ai, bj) on the left top of the smallest entry in the (i , j)-th
cell (TT of Step-3).
Step 7 If ai <bj, leave the i-th row and readjust bj as bj =bj −ai
/
.
If ai >bj, leave the j-th column and readjustaias ai =ai −bj
/
.
If ai =bj, leave either i-th row or j-th column but not both.
Step 8 Repeat Steps 4 to 7 until the rim requirements are satisfied.
Step 9 Calculate
∑
∑
= =
= n
j ij ij m
i
x c z
1 1
, z being the minimum transportation cost.
202
Showrooms
D1 D2 D3 Supply
F
ac
to
ri
es
F1 2 7 4 5
F2 3 3 1 8
F3 5 4 7 7
F4 1 6 2 14
Demand 7 9 18
column distribution indicator. Finally we shall allocate the demand/supply of the dummy elements by following simple arithmetic calculation.
4. Numerical illustrations
4.1. Example 1(Balanced TP): A company manufactures motor tyres and it has four
factories F1, F2, F3 and F4 whose weekly production capacities are 5, 8, 7 and 14 thousand pieces of tyres respectively. The company supplies tyres to its three showrooms located at D1, D2 and D3 whose weekly demand are 7, 9 and 18 thousand pieces respectively. The transportation cost per thousand pieces of tyre is given below in the TT:
Table 4.1.1. An example of balanced TP
We want to schedule the shifting of tyres from factories to showrooms with a minimum cost.
Since the factories demand 34 units equals the total supply 34 units, the given problem is a balanced TP.
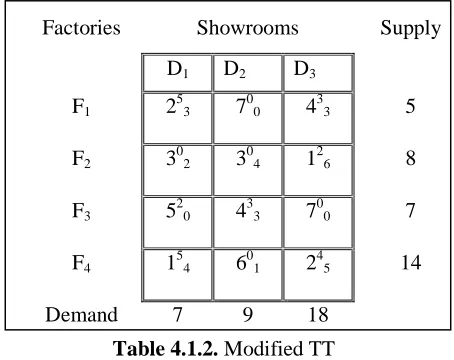
Applying the algorithm of the Proposed Method; the row differences and the column differences are shown on the right top and right bottom respectively to each of the elements.
Table 4.1.2. Modified TT
The distribution is made according to proposed algorithm is
Factories Showrooms Supply
D1 D2 D3
F1 2
5
3 7
0
0 4
3
3 5
F2 3
0
2 3
0
4 1
2
6 8
F3 5
2
0 4
3
3 7
0
0 7
F4 1
5
4 6
0
1 2
4
5 14
Approach
203
Table 4.1.3. Initial solution tableau of proposed method
Therefore, the solution for the given problem is
x11 =5, x23=8, x32 =7, x41 =2, x42 =2 and x43 =10 . and the total transportation cost is
80
20 12 2 28 8 10
10 2 2 6 2 1 7 4 8 1 5 2
=
+ + + + + =
× + × + × + × + × + × = z
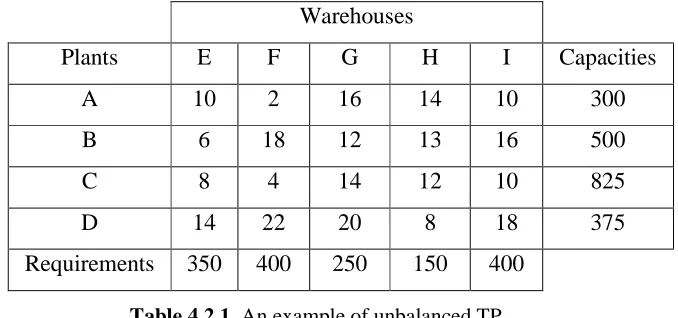
4.2. Example 2 (Unbalanced TP): A company has four plants at locations A, B, C and
D, which supply to warehouses located at E, F, G, H and I. Monthly plant capacities are 300, 500, 825 and 375 units respectively. Monthly warehouse requirements are 350, 400, 250, 150 and 400 units respectively. Unit transportation costs are given below.
Table 4.2.1. An example of unbalanced TP
Determine a distribution plan for the company in order to minimize the total transportation cost.
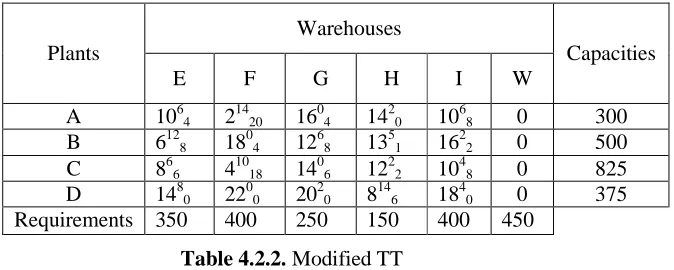
Since the warehouse requirements 1550 units is less than the total plant capacities 2000 units, the given problem is an unbalanced TP. We introduce a dummy warehouse W having all the transportation costs equal to zero to make the TP balanced.
Factories Showrooms Supply RDI
D1 D2 D3
F1 522 70 40 5 (2) (2) --
F2 32 34
8
14 8 (0) -- --
F3 52
7
40 70 7 (2) (2) (2)
F4
2
11
2
61
10
21 14 (0) (0) (0)
Demand 7 9 18
C
D
I (0) (3) (3)
(0) (1) (1)
(1) (1) (1)
Warehouses
Plants E F G H I Capacities
A 10 2 16 14 10 300
B 6 18 12 13 16 500
C 8 4 14 12 10 825
D 14 22 20 8 18 375
204
Applying the algorithm of the Proposed Method; the row differences and the column differences are shown on the right top and right bottom respectively to each of the elements excluding the dummy one.
Plants
Warehouses
Capacities
E F G H I W
A 1064 21420 1604 1420 1068 0 300 B 6128 18
0 4 12
6 8 13
5 1 16
2
2 0 500
C 866 41018 1406 1222 1048 0 825 D 1480 22
0 0 20
2 0 8
14
6 18 4
0 0 375
Requirements 350 400 250 150 400 450
Table 4.2.2. Modified TT
According to our algorithm, the initial distribution is made without doing any operation on dummy destination/supply elements is
Plants
Warehouses
C
ap
ac
it
ie
s
RDI
E F G H I W
A
102
300
26 164 142 102 0 300 (2) (2) (2) - - -
B 350
64 184
150
122 134 162 0 500 (0) (0) (2) (2) (2) -
C
80
100
48
100
146 120
400
104 0 825 (2) (2) (2) (2) (2) (2)
D
148 220 202
150
88 184 0 375 (0) (4) (2) (2) (2) (2)
Requir
ements 350 400 250 150 400 450
C
D
I
(4) (2) (2) (4) (0) -
- (2) (2) (4) (0) -
- (2) (2) - (0) -
- (4) (4) - (0) -
- - (4) - (0) -
- - (4) - (0) -
Table 4.2.3. Initial distribution for unbalanced TP
Approach
205 Plants
Warehouses
Capacities
E F G H I W
A 10 300
2 16 14 10 0 300
B 350
6 18 15012 13 16 0 500
C 8 100
4 10014 12 40010 2250 825
D 14 22 20 150
8 18 2250 375
Requirements 350 400 250 150 400 450
Table 4.2.4. Initial solution tableau of proposed method
Therefore, the solution for the given problem is
x12 =300, x21 =350, x23 =150, x32 =100 , x33 =100,
x35 =400, x36 =225, x44 =150 and x46 =225. and total transportation cost is
. 11500
0 1200 0 4000 1400
400 1800 2100 600
225 0 150 8 225 0 400 10 100 14 100 4 150 12 350 6 300 2
=
+ + + +
+ + + +
=
× + × + × + × + × + × + × + × + × = z
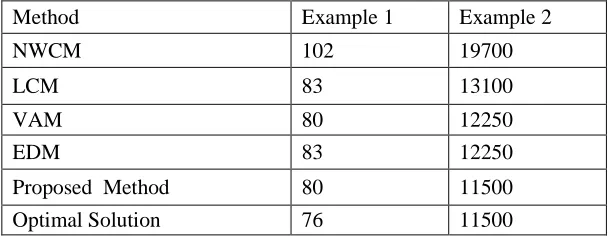
5. Comparison of Transportation Cost Obtained by Different Methods
A comparative study among the results obtained by proposed method, existing methods and optimal solution is also carried out in the table 5.1.1.
Method Example 1 Example 2
NWCM 102 19700
LCM 83 13100
VAM 80 12250
EDM 83 12250
Proposed Method 80 11500
Optimal Solution 76 11500
Table 5.1.1. Comparative study of the Results
5. Conclusion
206
and thus market becomes competitive. For this, Transportation model provides a powerful framework to meet this challenge.
The proposed method of finding an IBFS for the minimization of transportation cost is illustrated numerically. It is observed that proposed algorithm provides comparatively a better IBFS solution than those obtained by the traditional algorithms which is either optimal or near to optimal solution.
We would finally conclude that our developed algorithm provides a remarkable IBFS by ensuring minimum transportation cost which may be an attractive alternative to the traditional transportation problem solution methods.
REFERENCES
1. Abdur Rashid, An effective approach for solving transportation problems, Jahangirnagar J. Mathematics and Mathematical Sciences, 26 (2011) 101-107. 2. R.K.Aminur, Analysis and resolution of the transportation problem: an algorithmic
approach, M.Phill. Thesis, Dept. of Mathematics, Jahangirnagar University, 2012. 3. R.K.Aminur, A resolution of the transportation problem: an algorithmic approach,
Jahangirnagar University Journal of Science, 34(2) (2011) 49-62.
4. I.Amirul, R.K.Aminur, M.S.Uddin and M.A.Malek, Determination of basic feasible solution of transportation problem: a new approach, Jahangirnagar University Journal of Science, 35(1) (2012)105-112.
5. F.L.Hitchcock, The distribution of a Product from Several Sources to Numerous Localities, J. Math. Phys., (1941) 224-230.
6. G.B.Dantzig, Linear Programming and Extensions, Princeton University Press, Princeton, N.J., 1963.
7. H.H.Shore, The transportation problem and the Vogel’s approximation method, Decision Science, 1(3-4) (1970) 441-457.
8. H.S.Kasanan and K.D.Kumar, Introductory Operation Research: Theory and Applications, Springer, 2004.
9. Md. Amirul Islam, Cost and Time Minimization in Transportation and Maximization of Profit: A Linear Programming Approach, Ph.D. thesis, Dept. of Mathematics, Jahangirnagar University, 2014.
10. M.Mathirajan and B.Meenakshi, experimental analysis of some variants of Vogel’s approximation method, Asia-Pacific Journal of Operational Research, 21(4) (2004) 447-462.
11. N.Balakrishnan, Modified Vogel’s approximation method for unbalance transportation problem, Applied Mathematics Letters, 3(2) (2000) 9-11.
12. P.Pandian and G.Natarajan, A new approach for solving transportation problems with mixed constraints, Journal of Physical Sciences, 14 (2010) 53-61.
13. R.R.K.Sharma and S.Prasad, Obtaining a good primal solution to the uncapacitated Transportation Problem, European Journal of Operation Research, 144 (2003) 560-564.
14. S.Korukoglu and S.Balli, An Improved Vogel’s Approximation Method for the Transportation Problem, Association for Scientific Research, Mathematical and Computational Application, 16(2) (2011) 370-381.