Formulation of mebeverine hydrochloride MR pellets in capsules and comparative characterization against colofac MR capsules
15
0
0
Full text
(2) S.Petchimuthu, et al / Int. J. of Pharmacy and Analytical Research Vol-3(4) 2014 [348-362]. dosing and unpredictable absorption led to the concept a measurable and reproducible amount of drug to the of sustained drug delivery system4. The goal in target site over a prolonged period. Modified Release designing Sustained Delivery Systems is to reduce the (MR) delivery system provides an uniform frequency of the dosing or to increase effectiveness of concentration or amount of the drug at the absorption the drug by localization at the site of action, reducing site and thus, after absorption allows maintenance of the dose required or providing uniform drug delivery. plasma concentrations within a therapeutic range, Modified Release dosage form is a dosage form that which minimizes side effects and also reduces the release one or more drugs continuously in a frequency of administration. MR products are predetermined pattern for a fixed period of time, either formulations that release active drug compounds into systemically or to a specified target organ. Modified the body gradually and predictably over a 12-24 hr Release dosage forms provide a better control of period and that can be taken once or twice a day. plasma drug levels, less dosage frequency, less side Typically these products provide several benefits when effect, increased efficacy and constant delivery. compared with immediate release drugs, greater Irritable bowel syndrome (IBS) is a disorder effectiveness in the treatment of chronic conditions, characterized most commonly by cramping, abdominal reduced side effects, greater convenience and higher pain, bloating, constipation, and diarrhoea. IBS causes levels of patient compliance due to a simplified dosing a great deal of discomfort and distress, but it does not schedule11-14. Because of the above advantages, such permanently harm the intestines and does not lead to a systems form the major segment of the drug delivery serious disease, such as cancer. An antispasmodic is market. usually prescribed, which assists to control colon A number of techniques are used to achieve Modified muscle spasms and reduce abdominal pain.5-10. Oral Release of drugs via the oral cavity. The majority of the ingestion is traditionally preferred route of drug oral MR systems relay on dissolution, diffusion or a administration, providing a convenient method of combination of both mechanisms to generate slow effectively achieving both local and systemic effects. In release of drug to the Gastro intestinal milieu. Pellets conventional oral drug delivery systems, there is very are agglomerates of fine powders or granules of bulk little control over release of drug. The effective drugs and excipients. They consist of small, free concentration at the target site can be achieved by flowing spherical or semispherical solid units typically intermittent administration of grossly excessive doses, from about 0.5 - 1.5mm. which often results in constantly changing, Pellets may be manufactured by using different unpredictable and often sub or supra therapeutic plasma methods. The methods used for pelletization are concentrations leaving the marked side effects. An essentially the same as the granulation methods. ideal oral drug delivery system should steadily deliver Fig.1: Different methods of Pelletization. The aim of the present investigation was to formulate and evaluate MR Mebeverine HCl capsules containing coated Mebeverine HCl pellets by eudragit S-100 and. the optimized formulation is compared with the reference product “Colofac MR”.. www.ijpar.com. ~ 349~.
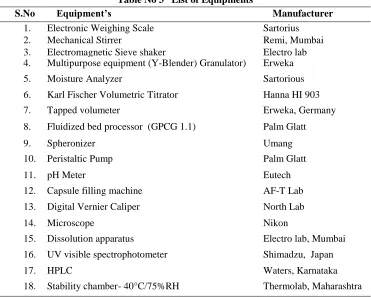
(3) S.Petchimuthu, et al / Int. J. of Pharmacy and Analytical Research Vol-3(4) 2014 [348-362]. MATERIALS AND METHODS Table2: List of Excipients Name of ingredients Grade Source Mebeverine HCl BP Shasun Pharmaceuticals Celsphere CP 305 USP/NF/EP Asahi Kasei – Japan / Signet chemical Sugar spheres USP / NF Signet Micro crystalline cellulose pH101 USP-NF FMC Biopolymer Povidone K 30 USP/BP/EP ISP corporation Hypromellose 5cps BP/EP Colorcon Eudragit NE 30 D USP/NF Evonik / Degussa Eudragit L 30 D 55 USP/NF Evonik / Degussa Eudragit S 100 Ph.Eur Evonik / Degussa Poly ethylene glycol USP/NF Vasudha Chemicals Tri ethyl citrate USP/EP Merck Limited Purified Talc BP/EP Luzenac Pharma/Signet Colloidal silicon dioxide NF/BP/Ph.Eur Cabot Sanmar Magnesium stearate EP/BP Ferro Corporation Isopropyl alcohol EP/BP/USP Qualigens Purified water USP Shasun Table No 3 List of Equipments Equipment’s Electronic Weighing Scale Mechanical Stirrer Electromagnetic Sieve shaker Multipurpose equipment (Y-Blender) Granulator). Manufacturer Sartorius Remi, Mumbai Electro lab Erweka. 5.. Moisture Analyzer. Sartorious. 6.. Karl Fischer Volumetric Titrator. Hanna HI 903. 7.. Tapped volumeter. Erweka, Germany. 8.. Fluidized bed processor (GPCG 1.1). Palm Glatt. 9.. Spheronizer. Umang. 10.. Peristaltic Pump. Palm Glatt. 11.. pH Meter. Eutech. 12.. Capsule filling machine. AF-T Lab. 13.. Digital Vernier Caliper. North Lab. 14.. Microscope. Nikon. 15.. Dissolution apparatus. Electro lab, Mumbai. 16.. UV visible spectrophotometer. Shimadzu, Japan. 17.. HPLC. Waters, Karnataka. 18.. Stability chamber- 40°C/75%RH. Thermolab, Maharashtra. S.No 1. 2. 3. 4.. Drug – Excipient compatibility study The successful formulation of a stable and effective solid dosage form depends on the careful selection of the excipients that are added. Drug: Excipient. compatibility studies will be done with the selected excipients.. www.ijpar.com. ~ 350~.
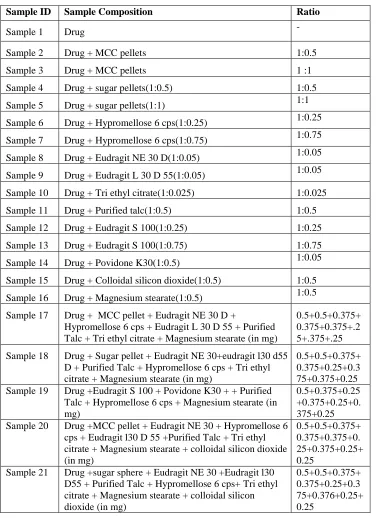
(4) S.Petchimuthu, et al / Int. J. of Pharmacy and Analytical Research Vol-3(4) 2014 [348-362]. Sample preparation Binary mixtures of the drug and excipients are prepared by placing the accurately weighed amount of the drug and excipients in polybag and mixed till homogenous mixture is achieved. Then, these mixtures are filled in. vials and closed with bromo butyl rubber stoppers & crimped with tear off clear lacquer aluminum seals. These samples are charged at 40°C/75% RH conditions. The Drug : Excipients ratio was denoted in the table 4.. Table 4 Drug Excipients ratio Sample ID. Sample Composition. Sample 1. Drug. Sample 2. Drug + MCC pellets. 1:0.5. Sample 3. Drug + MCC pellets. 1 :1. Sample 4. Drug + sugar pellets(1:0.5). Sample 5. Drug + sugar pellets(1:1). 1:0.5 1:1. Sample 6. Drug + Hypromellose 6 cps(1:0.25). Sample 7. Drug + Hypromellose 6 cps(1:0.75). Sample 8. Drug + Eudragit NE 30 D(1:0.05). Sample 9. Drug + Eudragit L 30 D 55(1:0.05). Sample 10. Drug + Tri ethyl citrate(1:0.025). 1:0.025. Sample 11. Drug + Purified talc(1:0.5). 1:0.5. Sample 12. Drug + Eudragit S 100(1:0.25). 1:0.25. Sample 13. Drug + Eudragit S 100(1:0.75). Sample 14. Drug + Povidone K30(1:0.5). 1:0.75 1:0.05. Sample 15. Drug + Colloidal silicon dioxide(1:0.5). Sample 16. Drug + Magnesium stearate(1:0.5). Sample 17. Drug + MCC pellet + Eudragit NE 30 D + Hypromellose 6 cps + Eudragit L 30 D 55 + Purified Talc + Tri ethyl citrate + Magnesium stearate (in mg). 0.5+0.5+0.375+ 0.375+0.375+.2 5+.375+.25. Sample 18. Drug + Sugar pellet + Eudragit NE 30+eudragit l30 d55 D + Purified Talc + Hypromellose 6 cps + Tri ethyl citrate + Magnesium stearate (in mg) Drug +Eudragit S 100 + Povidone K30 + + Purified Talc + Hypromellose 6 cps + Magnesium stearate (in mg) Drug +MCC pellet + Eudragit NE 30 + Hypromellose 6 cps + Eudragit l30 D 55 +Purified Talc + Tri ethyl citrate + Magnesium stearate + colloidal silicon dioxide (in mg) Drug +sugar sphere + Eudragit NE 30 +Eudragit l30 D55 + Purified Talc + Hypromellose 6 cps+ Tri ethyl citrate + Magnesium stearate + colloidal silicon dioxide (in mg). 0.5+0.5+0.375+ 0.375+0.25+0.3 75+0.375+0.25 0.5+0.375+0.25 +0.375+0.25+0. 375+0.25 0.5+0.5+0.375+ 0.375+0.375+0. 25+0.375+0.25+ 0.25 0.5+0.5+0.375+ 0.375+0.25+0.3 75+0.376+0.25+ 0.25. Sample 19. Sample 20. Sample 21. Ratio -. www.ijpar.com. ~ 351~. 1:0.25 1:0.75 1:0.05 1:0.05. 1:0.5 1:0.5.
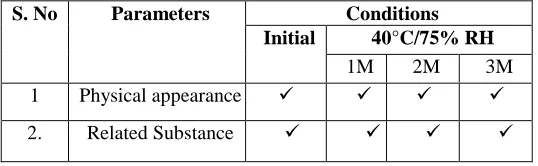
(5) S.Petchimuthu, et al / Int. J. of Pharmacy and Analytical Research Vol-3(4) 2014 [348-362]. refrigerator (2 to 8°C). In the event of out of specification results (significant change in the impurity profile), then the samples which was kept in the refrigerator were taken for analysis. Sample analysis. All vials were inspected for the appearance, color and odour and recorded. The samples removed from 40°C/75% RH were be analyzed as per the Schedule, in duplicate vials at all conditions were transferred to the Table No 4 Stability condition and interval S. No. Parameters Initial. 1. Physical appearance. 2.. Related Substance. Selection of Excipient Formulation studies of Mebeverine hydrochloride Modified Release capsules were formulated based on pre formulation data of various excipients, excipients were selected based on their DEC study results, the results compilation is shown in table no 5. PREPARATION PELLETS. OF. DRUG-LOADED. Mebeverine Hydrochloride, Micro crystalline cellulose 101, Purified Talc, Colloidal silicon dioxide was pulverized into a fine dusting powder. Binder solution was prepared by adding PVP K-30 in IPA and stirred well to get the clear solution. Umang solid drug layering machine (Spheronizer) was used for preparing drug-layered pellets (Fig: 2) Celsphere CP 305 were loaded into the Spheronizer and the rotor runs at a speed of 120 to 180 RPM, Dusting powder was sprayed from one end of the machine tangentially with and atomizing air pressure 0.2 Kg/cm3, the binding solution was sprayed from the other end as a mist droplets. The drug loaded pellets were unloaded and dried in a room temperature. The dried pellets are sized on a sifter to remove agglomerates, broken pellets and fine powder. The ASTM #16 passed pellets were ready for MR coating. Drug loading trial formula were mentioned in the tablet no 6. PREPARATION OF RELEASE PELLETS. MODIFIED. . Conditions 40°C/75% RH 1M 2M 3M . . . A laboratory scale Fluid bed processor (GPCG 1.1) with bottom spray assembly /Wurster column (Fig:3) was used for coating of pellets. MR Coating solution was prepared by adding Eudragit S-100 in to IPA containing weighed quantity of purified water (3.0%) under continuous stirring untill to form a clear dispersion, Tri Ethyl Citrate added in the clear dispersion under stirring, Purified talc (Sifted through #200 mesh) was added slowly in to the dispersuion, and the stirring was continued for 45 minutes or untill to get a clear dispersion. Drug loaded pellets were transferred into the FBP and coated with the above prepared coating solution. With the following machine parameters, Inlet Temp : 45 – 50º C Product Temp : 35 - 40 º C Atomizing air : 1.5 – 2 Kg/cm2 Operating air : 30 – 40 cfm Drive speed : 30 – 40 kg/cm2 Column length : 12 – 17 cm Spray rate : 1 - 3 gm/min/gun After complete consumption of MR coating solution, fluidization was reduced for a brief post-drying period. The dried pellets are sized on a sifter to remove agglomerates, broken pellets and fine powder and it is ready for filling in to empty Hard Gelatin Capsules (HGC) The drug layered pellets of F3 was coated with 4 different trials compositions (F4, F5, F6 & F7) with various polymers composition and the formula denoted in the table 6.. www.ijpar.com. ~ 352~.
(6) S.Petchimuthu, et al / Int. J. of Pharmacy and Analytical Research Vol-3(4) 2014 [348-362]. ENCAPSULATION OF MEBEVERINE HYDROCHLORIDE MR PELLETS IN CAPSULES Mebeverine HCl coated pellets equivalent to 200 mg from the formulation F4-F7 were taken and filled in hard gelatin capsules size 2 with Semi- Automatic capsule filling machine (Rimek formulations).. Assay of API Weigh accurately and transfer about 25 mg of Drug working standards into a 250ml volumetric flask. Add about 100ml of the diluent, sonic ate for about 2 mins to dissolve the content and dilute to volume up to mark with diluent and mix well (Conc: 100ppm). Analyze the sample under HPLC at 362 nm. The Results were mentioned in the Table 7.. CHARACTERIZATIONS Identification of API Mebeverine HCl was identified by Fourier Transform Infrared Spectroscopy FTIR method. FTIR offers quantitative and qualitative analysis for organic and inorganic samples. FTIR identifies chemical bonds in a molecule by producing an infrared absorption spectrum. The spectra produce a profile of the sample, a distinctive molecular fingerprint that can be used to screen and scan samples for many different components. FTIR is an effective analytical instrument for detecting functional groups and characterizing covalent bonding information. FTIR spectrum denoted in the Figure 4.. %ASSAY. Where, AR RP AR Std WT Std WT RP DL Std DL RP LC. = = = = = = =. Assay of COLOFAC® MR The drug content in Reference sample was determined by the 50mg of crushed MR layered pellets was weighed and transferred into a 50ml volumetric flash. Add about 50ml of methanol and solicited to dissolve the content, cool the solution to room temperature and made the volume up to the mark with 0.1N HCL and mixed. Diluted 5ml of solution to100ml with mobile phase and mixed (con: 0.05mg/ml). The absorbance of resultant solution was measured spectrophotometrically at 285nm using 0.1N hydrochloric acid as blank. The report will be discussed in result and discussion Table No: 17. = AR RP x WT Std__ x DL RP_ AR Std DL Std WT RP. x AVG Fill WT LC. Average Area of Drug peak in Reference product. Average Area of Drug peak in standard Weight of Drug in standard Weight of Drug Reference product Standard dilution Reference product dilution Label claim. The Results were mentioned in the Table 7. PARTICLE SIZE DISTRIBUTION (PSD) PSD was performed by sieve analysis method. The sieves are stacked one over the other in descending order of the mesh size. Weigh the individual empty sieve and place an accurately weighed quantity (about 40g) in the sieve top. Cover the sieve at the top with the lid provided, and place a receiver at the bottom to collect the sample after sieving. Fix and fasten the. sieves set up into the sieve shaker and set time at 10min, set the sieving speed rate at power 10 switch on the sieve shaker. After the specified time take the sieves and weigh individual sieve with sample and the sample weight was calculated. The report were discussed in Table 8 in result and discussion part.. www.ijpar.com. ~ 353~.
(7) S.Petchimuthu, et al / Int. J. of Pharmacy and Analytical Research Vol-3(4) 2014 [348-362]. WEIGHT VARIATION TEST Weigh 20 intact capsules individually, and determine the average weight. The requirements are met if each of the individual weights is within limits of 95% and 115% of average weight. If not all of the capsule fall within limits, weigh the 20 capsules individually. Weigh the emptied shells individually and calculate for each capsule the net weight of its contents by subtracting the weight of the shell from the respective gross weight. determine the difference between each individual net content: the requirements are met if (a) not more than 2 of the differences are greater than 10% of average net content and (b) in no case is the difference greater than 25%.If more than 2 but not more than 6 capsules deviate from the average between 10% and 25%, determine the net contents of an additional 40 capsules, and determine the average content of entire 60 capsules. Determine the 60 deviations from the new average: the requirements are met if (a) in not more than 6 of the 60 capsules does the difference exceed 10 % of the average net content and (b) in no case does the difference exceed 25%. The Results were mentioned in the Table 7 Lock length The lock length of capsules play a major role during blister packing, handling and during in-vitro dissolution, if the lock length is more, there will be a damage during blister packing, if the lock length is lesser than the limit, the capsules will fail in dissolution due to the adherence between pellets into the filled capsules. The length of filled capsules was found to be in the range of 17.4 to 18.2 mm, Results of lock length were denoted in table 7 Microscopic examination of optimized trial (Trial – F7) The shape of the pellets play a role during functional coating, non-spherical and sharp edged pellets will resulted with opening after functional coating leads to batch to batch variation in dissolution. The Final product was placed under microscope in a slide and examined under 45X to study the surface nature of the. pellets. The microscopic examination is denoted in the Fig. 4 DISSOLUTION STUDIES The following procedure was employed to determine the in-vitro dissolution rate for Reference Product: Dissolution studies of Reference product were carried out employing dissolution apparatus-I (basket) method at 37°C ±0.5°C. Basket rotational speed was held at 100rpm. The dissolution medium was chosen as 900ml of 6.8 phosphate buffer (official medium BP) till 24 h 10 ml samples were taken and diluted to 100ml with pH6.8 phosphate buffer. Subsequently, released amount of antispasmodic agent was determined by HPLC at 263nm. Each measurement was repeated five times for each formulation. Dissolution medium : 900 ml of 6.8 pH phosphate buffer for 24 h Temperature : 37oC 0.5oC Apparatus : Apparatus I (Basket apparatus), RPM : 100 Volume withdrawn : 10 ml The results of dissolution study are mentioned in Table 9, and graphical representation of comparative cumulative drug release is mentioned in Fig. 6 STABILITY STUDIES The final batches were packed in PVC Alu-blisters and loaded in the stability chambers at accelerated condition (40°C/75% RH) studied for 3 months The critical attributes like description of pellets, water content, Assay and dissolution of capsules were studied during stability evaluation. Stability results at accelerated conditions were given in Table 10. Dissolution profile of Optimized formulation F7 during stability study (40°C/75% RH) is recorded in the Table 11 and the Graphical representation cumulative % drug release is shown in Fig. 8. The dissolution curves of optimized batch F7 were completely overlapped with Reference product and there is no significant changes observed on the final trial formulation during stability. Hence the product is considered as stable for 2 years at room temperature (25°C/60% RH). www.ijpar.com. ~ 354~.
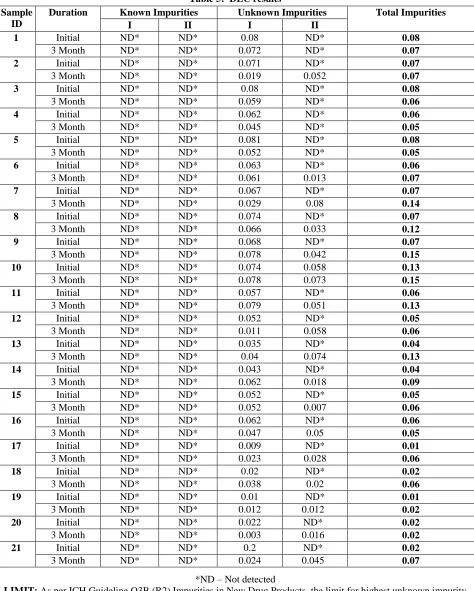
(8) S.Petchimuthu, et al / Int. J. of Pharmacy and Analytical Research Vol-3(4) 2014 [348-362]. RESULTS AND DISCUSSION Sample ID 1 2 3 4 5 6 7 8 9 10 11 12 13 14 15 16 17 18 19 20 21. Duration Initial 3 Month Initial 3 Month Initial 3 Month Initial 3 Month Initial 3 Month Initial 3 Month Initial 3 Month Initial 3 Month Initial 3 Month Initial 3 Month Initial 3 Month Initial 3 Month Initial 3 Month Initial 3 Month Initial 3 Month Initial 3 Month Initial 3 Month Initial 3 Month Initial 3 Month Initial 3 Month Initial 3 Month. Table 5: DEC results Known Impurities Unknown Impurities I II I II ND* ND* 0.08 ND* ND* ND* 0.072 ND* ND* ND* 0.071 ND* ND* ND* 0.019 0.052 ND* ND* 0.08 ND* ND* ND* 0.059 ND* ND* ND* 0.062 ND* ND* ND* 0.045 ND* ND* ND* 0.081 ND* ND* ND* 0.052 ND* ND* ND* 0.063 ND* ND* ND* 0.061 0.013 ND* ND* 0.067 ND* ND* ND* 0.029 0.08 ND* ND* 0.074 ND* ND* ND* 0.066 0.033 ND* ND* 0.068 ND* ND* ND* 0.078 0.042 ND* ND* 0.074 0.058 ND* ND* 0.078 0.073 ND* ND* 0.057 ND* ND* ND* 0.079 0.051 ND* ND* 0.052 ND* ND* ND* 0.011 0.058 ND* ND* 0.035 ND* ND* ND* 0.04 0.074 ND* ND* 0.043 ND* ND* ND* 0.062 0.018 ND* ND* 0.052 ND* ND* ND* 0.052 0.007 ND* ND* 0.062 ND* ND* ND* 0.047 0.05 ND* ND* 0.009 ND* ND* ND* 0.023 0.028 ND* ND* 0.02 ND* ND* ND* 0.038 0.02 ND* ND* 0.01 ND* ND* ND* 0.012 0.012 ND* ND* 0.022 ND* ND* ND* 0.003 0.016 ND* ND* 0.2 ND* ND* ND* 0.024 0.045. Total Impurities 0.08 0.07 0.07 0.07 0.08 0.06 0.06 0.05 0.08 0.05 0.06 0.07 0.07 0.14 0.07 0.12 0.07 0.15 0.13 0.15 0.06 0.13 0.05 0.06 0.04 0.13 0.04 0.09 0.05 0.06 0.06 0.05 0.01 0.06 0.02 0.06 0.01 0.02 0.02 0.02 0.02 0.07. *ND – Not detected LIMIT: As per ICH Guideline Q3B (R2) Impurities in New Drug Products, the limit for highest unknown impurity is NMT 0.2%. www.ijpar.com. ~ 355~.
(9) S.Petchimuthu, et al / Int. J. of Pharmacy and Analytical Research Vol-3(4) 2014 [348-362]. Fig. 2 Preparation of Drug layer. Fig. 3: Preparation of MR layer Pellets. Figure 5. Microscopic examination of pellets. Trial F5 – Poor coating. Trial F7 – Elegant coating.. Table No. 6: formulation trials Drug layering and Modified release coating: S. No. Ingredients. Percentage quantity T1 T2 T3. F4. F5. F6. F7. DRUG LAYERING OF CORE PELLETS 1 MCC Pellets 8.16. 7.91. 7.91. -. -. -. -. 2. Mebeverine HCl. 81.63. 79.13. 78.02. -. -. -. -. 3. Micro crystalline cellulose 101. 8.16. 7.91. 8.59. -. -. -. -. 4. Hypromellose 6 cps. 0.82. 3.86. -. -. -. -. -. 5. Povidone K-30. -. -. 4.19. -. -. -. -. 6. Purified Talc. 0.82. 0.79. 0.86. -. -. -. -. 7. Colloidal silicon dioxide. 0.41. 0.40. 0.43. -. -. -. -. 8. Isopropyl alcohol. Q.S. Q.S. Q.S. -. -. -. -. 9. Purified water. Q.S. Q.S. Q.S. -. -. -. -. TOTAL. 100.00. 100.00. 100.00. -. -. -. -. www.ijpar.com. ~ 356~.
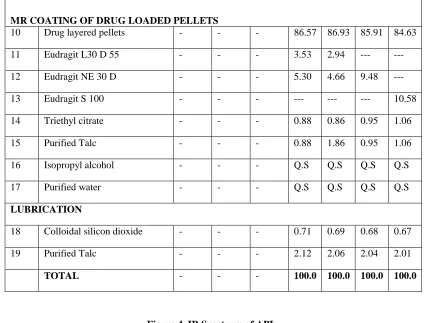
(10) S.Petchimuthu, et al / Int. J. of Pharmacy and Analytical Research Vol-3(4) 2014 [348-362]. MR COATING OF DRUG LOADED PELLETS 10 Drug layered pellets -. -. 86.57. 86.93. 85.91. 84.63. 11. Eudragit L30 D 55. -. -. -. 3.53. 2.94. ---. ---. 12. Eudragit NE 30 D. -. -. -. 5.30. 4.66. 9.48. ---. 13. Eudragit S 100. -. -. -. ---. ---. ---. 10.58. 14. Triethyl citrate. -. -. -. 0.88. 0.86. 0.95. 1.06. 15. Purified Talc. -. -. -. 0.88. 1.86. 0.95. 1.06. 16. Isopropyl alcohol. -. -. -. Q.S. Q.S. Q.S. Q.S. 17. Purified water. -. -. -. Q.S. Q.S. Q.S. Q.S. LUBRICATION 18. Colloidal silicon dioxide. -. -. -. 0.71. 0.69. 0.68. 0.67. 19. Purified Talc. -. -. -. 2.12. 2.06. 2.04. 2.01. TOTAL. -. -. -. 100.0. 100.0. 100.0. 100.0. Figure 4. IR Spectrum of API. www.ijpar.com. ~ 357~.
(11) S.Petchimuthu, et al / Int. J. of Pharmacy and Analytical Research Vol-3(4) 2014 [348-362]. Table 7. Characteristics of “Colofac MR” and Trial batch from F4 to F7 S.No. PARAMETERS. “Colofac MR”. F4. F5. F6. F7. 0.612. 0.588. 0.597. 0.596. 0.596. 1.. Bulk density (g/ml). Specification Limits NA. 2.. Tapped density (g/ml). NA. 0.652. 0.635. 0.635. 0.643. 0.643. 3.. NA. 6.13. 7.353. 5.970. 7.353. 7.353. 4.. Compressibility index (%) Hausner’s Ratio. NA. 1.07. 1.079. 1.063. 1.079. 1.079. 5.. Lock length. 17.80mm ± 0.40. 18.12mm. 17.95. 17.98. 17.99. 17.96. 6.. Moisture content. NMT 5.0. 1.80 %. 1.56%. 1.67%. 1.58%. 1.54%. 7.. Weight variation. NMT 5.0%. 1.12 %. 1.82%. 1.65%. 1.35%. 1.16%. 6.56 ±2.0 (6.429 - 6.691 g. ± 2.0 %. 6.489g. 6.514g. 6.618g. 6.586g. 253mg. 250 ± 3.0%. 255mg. 248mg. 255mg. 251mg. ± 5.0 %. -1% and +2%. Complies. Complies. Complies. Complies. NLT 95 & NMT 105. 99.99 %. 103. 101. 103. 102. 8.. Actual Group Weight/Mass of 20 filled capsules 9. Actual fill Weight/Mass 10.. Uniformity of Weight/Mass of filled capsules 11. Assay by HPLC. All the product parameters found satisfactory and well within the specification limit. Table 8 : Particle size distribution S.No. Sieve No. Cumulative% Retained “Colofac MR”. F1. F2. F3. F4. 1. #14. 2.09. -. -. -. -. 2. #16. 22.18. 5.86. 0.02. 0.02. 1.22. 3. #18. 49.37. 61.44. 7.2. 72. 91.38. 4. # 20. 68.2. 84.12. 93.41. 91.61. 99.29. 5. #25. -. 93.45. 96.8. 95.2. 100. 6. # 30. 89.96. 96.38. 99.94. 98.34. 100. 7. # 40. 99.58. 100. 100. 100. 100. 8. Pan. 100. 100. 100. 100. 100. The reference product is manufactured by Extrusion spheronization method, hence the pellets formed is larger and abnormal, Current Wurster coating was. produced a uniform and consistent pellets which was proven by the above PSD method.. www.ijpar.com. ~ 358~.
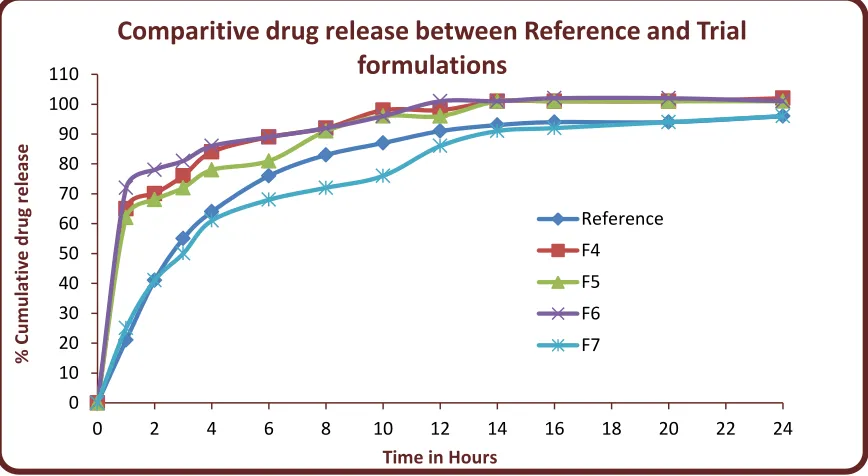
(12) S.Petchimuthu, et al / Int. J. of Pharmacy and Analytical Research Vol-3(4) 2014 [348-362]. Table No: 9 in-vitro dissolution study of formulations F4 to F7 S. No. TIME (Hours). “Colofac MR”. F4. F5. F6. F7. 1. 0. 0. 0. 0. 0. 0. 2. 1. 21. 65. 62. 72. 25. 3. 2. 41. 70. 68. 78. 41. 4. 3. 55. 76. 72. 81. 50. 5. 4. 64. 84. 78. 86. 61. 6. 6. 76. 89. 81. 89. 68. 7. 8. 83. 92. 91. 92. 72. 8. 10. 87. 98. 96. 96. 76. 9. 12. 91. 98. 96. 101. 86. 10. 14. 93. 101. 101. 101. 91. 11. 16. 94. 101. 101. 102. 92. 12. 20. 94. 101. 101. 102. 94. 13. 24. 96. 102. 101. 101. 96. Dissimilarity factor F1. 34.43. 28.34. 39.11. 9.84. Similarity factor F2. 31.09. 33.94. 27.68. 57.13. Fig 6: Comparative dissolution profile of formulations F4-F7 against reference (“Colofac MR”).. Comparitive drug release between Reference and Trial formulations. % Cumulative drug release. 110 100 90 80 70 60 50 40. Reference. 30 20 10. F6. F4 F5 F7. 0. 0. 2. 4. 6. 8. 10 12 14 Time in Hours. 16. 18. 20. 22. 24. The dissolution curves of optimized batch F9 were completely overlapped with “Colofac MR”.. www.ijpar.com. ~ 359~.
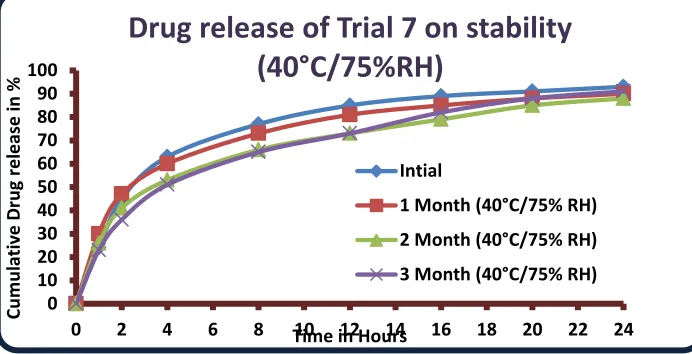
(13) S.Petchimuthu, et al / Int. J. of Pharmacy and Analytical Research Vol-3(4) 2014 [348-362]. S. No 1 2. 3. 4.. Table 10: Stability study of optimized formulation: Specification limit Initial 1 Month. Test parameter Description Assay by HPLC %w/w Water by KF (% w/w). Complies. Complies. 2 Months Complies. 100.8. 101.3. 100.5. 100.7%. NMT 7.0 1.50 Related substances: Specification limit Initial. 1.54. 1.96. 1.52. White to off white Spherical free flowing pellets NLT 90.0 and NMT 110.0. Name of the impurity. 1 Month. Known impurity I Known impurity II unknown impurity Total impurities. NMT 0.20 NMT 0.20 NMT 0.20 NMT 1.5. 0.02 0.01 0.09 0.17. 0.02 0.01 0.09 0.17. 3 Months Complies. 40°C/75% RH 2 3 Months Months 0.01 0.02 0.01 0.01 0.08 0.08 0.18 0.18. Table 11: Dissolution study of capsules on stability: The final batches were packed in PVC Alu-blisters & (40°C/75% RH) up to 3 months and at stress loaded in the stability chambers at accelerated condition Initial. 40°C/75% RH 2nd month. 1st month Mi n 21 43 61 75 83 88 89 90. Ma x 27 46 64 79 87 91 94 97. Av g 24 45 63 77 85 89 91 93. RS D 8.4 3.1 1.7 1.8 1.8 1.7 2.1 2.7. Mi Ma Av n x g 27 33 30 43 50 47 57 64 60 69 77 73 77 85 81 81 89 85 84 90 88 86 92 90. RS D 7.9 6.6 5.0 4.5 3.9 3.7 2.6 2.9. Mi n 24 39 50 62 70 76 83 87. Ma x 29 45 58 71 78 83 87 91. Av g 26 41 53 66 73 79 85 88. 3rd month. RS D 6.7 4.8 5.7 4.5 3.7 3.2 1.8 1.7. Mi n 21 32 48 62 70 78 84 88. Fig 8: Drug release on stability. Cumulative Drug release in %. Dissolution by HPLC (%w/w). Test TIME Nam POINT e Hour s 1 2 4 8 12 16 20 24. Drug release of Trial 7 on stability (40°C/75%RH). 100 90 80 70 60 50 40 30 20 10 0. Intial 1 Month (40°C/75% RH) 2 Month (40°C/75% RH) 3 Month (40°C/75% RH) 0. 2. 4. 6. 8. 10 in 12Hours 14 Time. www.ijpar.com. ~ 360~. 16. 18. 20. 22. 24. M a 25 41 56 70 78 86 92 96. Av g 23 36 51 65 73 82 88 91. RS D 5.8 8.8 5.3 4.1 3.8 3.5 3.1 3.4.
(14) S.Petchimuthu, et al / Int. J. of Pharmacy and Analytical Research Vol-3(4) 2014 [348-362]. SUMMARY AND CONCLUSION . . . . The Dissertation work entitled, “Formulation of Mebeverine Hydrochloride MR Pellets in Capsules and comparative characterization against COLOFAC® MR Capsules” was carried out for the optimization of the formulation to meet the quality standards with regard to API, excipients, manufacturing process and finished product. Drug-excipient compatibility studies were carried out for 3 months Accelerated condition and the results showed that there was no physical and chemical change in the API. This indicated that, the drug was compatible with the formulation components. Hence MCC 101, Povidone K30, Purified Talc, Colloidal silicon dioxide, Eudragit S 100, L100 D55, NE 30 D was selected as inactive excipients for the lab scale development. The Prototype formulations were developed (F1 to F7), and the F7 formulation was optimized, the critical product attributes and dissolution profile of the optimized batch F7 was similar to the Reference product, the Mebeverine Hydrochloride Modified Release pellets were filled in size 2 hard gelatin capsules and it is subjected to further studies The F7 formulation was taken for stability studies as per the ICH Guidelines, F-7 batch were packed in PVC Blisters charged at 40ºC ± 2 / 75 ± 5 %RH. . . . for the period of three months. The results were found satisfactory and complies the specifications. The Similarity and Dis-similarity factor (F1& F2 correlation) were calculated for the optimized formulation (F7) and the optimized formulation found that the similarity and dis similarity factors were correlated with the Reference product. So the formulated product was said to be equivalent with “Colofac MR” product. While coming to the discussion of dosage form of Modified Release coated pellets in capsule showed better drug release. Modified Release pellets have minimum volume in size, greater surface area, more surface activity and also no need of disintegration time for pellets in capsules. As pellets are small in size they enter into the systemic circulation very fast. Moreover there was no accumulation of drug in the body. Drug release rate was more when compared with the Reference (Colofac MR) sample. Finally it concludes that Modified Release pellets in capsule formulation (F7) have relevant drug release rate, stability and bioavailability as that the Reference.. ACKNOWLEDGMENT The authors are thankful to Mr. Mahendran, Asst. Manager, Manufacturing, Mr. Ragunath, Scientist, Shasun Chemicals Pvt ltd, Pondicherry, for providing necessary facilities to carry out this work.. REFERENCES [1] Robinson, Lachman .L, Lieberman .H, Kanig .J, Theory and Practice of Industrial Pharmacy. Sustained Action dosage forms: 2nd edition. Philadelphia Lea and Febiger; 1970. [2] Rubinstein, M. H, Aulton, M.E, Ed; Tablets. In Pharmaceutics: The Science of dosage form design. New York: Churchill Livingstone; 2000. p.305. [3] www.geocities.com. [4] Park, K., Controlled Drug delivery; Challenges and strategies, American Chemical Society: Washington DC; 200. [5] Talley, N. J., Gabriel, S. E., Harmsen, W. S., Zinsmeister, A. R.and Evans, R. W., Gastroenterology; 1995. p.1736–1751. [6] Pimparker, B. D., J. Indian Med. Assoc., 1970.p. 95–98. [7] Smart, H. L., Nicholson, D. A. and Atkinson, M., Gut, 1986.p.1227–1231. [8] Drossman, D. A., Mckee, D. C., Sandler, R. S., Mitchell, C. M.Cramer, E. M., Lawan, B. C. and Bruger, A. L., Gastroenterology;1988.p. 701–708. [9] Tripathi, B. M., Mishra, N. P. and Gupta, A. K., J. Assoc. Phys.India; 1983.p. 201– 203. [10] Lucey, M. R., Clark, M. L., Lowrides, J. and Dawson, A. M.Gut, 1987.p. 221–225. www.ijpar.com. ~ 361~.
(15) S.Petchimuthu, et al / Int. J. of Pharmacy and Analytical Research Vol-3(4) 2014 [348-362]. [11] S. P. Vyas and Roop K. Khar, Controlled Drug Delivery. Concepts and Advances: 1 st Edition. 2002 .p.157 – 162. [12] Howard C.Ansel “Pharmaceutical Dosage From and Drug Delivery Systems”, 7 th edition, by B.I.Waverly.p.249. [13] Howard C.Ansel “Pharmaceutical Dosage From and Drug Delivery Systems”, 7 th Edition, by B.I.Waverly. p. 251. [14] Chien W. Y, 1992. Novel Drug Delivery Systems. Marcel Dekker, Inc., New York:vol.50, p.156-165. [15] Ghebre-Sellassie.I, Pharmaceutical Pelletization Technology. Marcel Dekker, Ist (ed) Inc., New York:USA; Vol.37, p.1-13. [16] Davies, S. S., Wilson, C. G. and Washington, N., Gastrointestinal transit of a controlled-release pellet formulation of tiaprofenic acid and the effect of food. Int. J.Pharm. 1987; vol.35: 253-258. [17] Hicks, D. C. and Freese, H. L., Extrusion and spheronizing equipment. In GhebreSellassie, I. (ed), Pharmaceutical Pelletization Technology, Marcel Dekker, Inc., NewYork: 1989. p.71-100. [18] Howard C.Ansel “Pharmaceutical Dosage From and Drug Delivery Systems”, 7 th edition, p.250. [19] Indian pharmacopeia Volume I monographs of medicinal and pharmaceutical substances controller of publications 1996, p. 457-458. [20] British pharmacopeia Volume I monographs of medicinal and pharmaceutical substances by United Kingdom :1993, p. 405. [21] ICH Q1A (R2), Stability Testing Guidelines, Stability testing of a new drug product and new drug substance.. www.ijpar.com. ~ 362~.
(16)
Figure
+6


Related documents
Yet readers of Paugh’s book, in which Malthus is highlighted as a major contributor to Caribbean demography, making a great effort to ‘reconcile the politics of reproduction in
Thus, we compare assembly of quality trimmed reads (performed as described above), reads corrected using Quake, and trimmed reads corrected with SOAPdenovo ’ s own error
Coming from it, we can calculate the basic properties of an ensemble of atoms with ordered zero-point oscilla- tions, and compare them with measurement properties of superfluid
Assessment of drug use pattern using World Health Organization core drug use indicators at secondary care referral Hospital of South India. Pathak A, Gupta VK, Maurya A, Kumar A,
Values of energy flow estimated by means of P/B ratio are higher in Pelvetia canaliculata and Fucus spiralis communities, than in the Himanthalia elongata
9) Step 9: With the help of PN- sequence generator key i.e Key1, obtain a random pn-sequence.. 10) Step 10: Apply the watermark embedding process on mid frequency band as shown in
Comparison of steer diets in 1988-1989 (% relative weight averaged across 3 sampling days) using 3 techniques: bite count, microhistological examination of
Many months after the present paper has been published, Eric Filiol has updated his Web page [12] recently at http://www-rocq.inria.fr/codes/Eric.Filiol/PDRC.html , and provided a
