RESEARCH
Quantifying multi-dimensional
attributes of human activities at various
geographic scales based on smartphone
tracking
Xiaolu Zhou
1,2*and Dongying Li
3Abstract
Background: Advancement in location-aware technologies, and information and communication technology in the past decades has furthered our knowledge of the interaction between human activities and the built environment. An increasing number of studies have collected data regarding individual activities to better understand how the environment shapes human behavior. Despite this growing interest, some challenges exist in collecting and process-ing individual’s activity data, e.g., capturprocess-ing people’s precise environmental contexts and analyzprocess-ing data at multiple spatial scales.
Methods: In this study, we propose and implement an innovative system that integrates smartphone-based step tracking with an app and the sequential tile scan techniques to collect and process activity data. We apply the Open-StreetMap tile system to aggregate positioning points at various scales. We also propose duration, step and probabil-ity surfaces to quantify the multi-dimensional attributes of activities.
Results: Results show that, by running the app in the background, smartphones can measure multi-dimensional attributes of human activities, including space, duration, step, and location uncertainty at various spatial scales. By coordinating Global Positioning System (GPS) sensor with accelerometer sensor, this app can save battery which otherwise would be drained by GPS sensor quickly. Based on a test dataset, we were able to detect the recreational center and sports center as the space where the user was most active, among other places visited.
Conclusion: The methods provide techniques to address key issues in analyzing human activity data. The system can support future studies on behavioral and health consequences related to individual’s environmental exposure.
Keywords: Individual activity tracking, Location-based step, Smartphone, Tile systems, Geographic information systems
© The Author(s) 2018. This article is distributed under the terms of the Creative Commons Attribution 4.0 International License (http://creat iveco mmons .org/licen ses/by/4.0/), which permits unrestricted use, distribution, and reproduction in any medium, provided you give appropriate credit to the original author(s) and the source, provide a link to the Creative Commons license, and indicate if changes were made. The Creative Commons Public Domain Dedication waiver (http://creat iveco mmons .org/ publi cdoma in/zero/1.0/) applies to the data made available in this article, unless otherwise stated.
Background
The interaction between human activities and the envi-ronment has been an important topic in many disci-plines, such as transportation research, urban planning, and public health [4, 15, 29–31]. An increasing number of studies over the past decades have aimed to achieve better understandings of the environmental and health
consequences related to travel behavior. Among these studies, tasks such as collecting and processing data related to human activities are mostly laborious and time-consuming. Several challenges exist in collecting and processing human dynamic data.
Regarding data collection, technology advancements have spurred new ways of recording activity data. Many studies have used wearable devices such as global posi-tioning system (GPS) receivers and accelerometers to measure people’s activity space and physical activi-ties [22, 26, 27]. Although activity-tracking devices are
Open Access
*Correspondence: [email protected]
1 Department of Geology and Geography, Georgia Southern University, 68 Georgia Ave, Herty Bldg 0201, Statesboro, GA 30460, USA
becoming more affordable, logistical challenges still exist in carrying out experiments, especially when large sam-ple sizes are needed. Wearing additional devices such as an accelerometer or GPS is cumbersome for participants. In recent years, with rapid growth in smartphone own-ership [21], studies have explored using smartphones as sensors to measure travel behavior [19, 31]. However, most studies have focused on total steps averaged across a day based on the daily step counting apps. There is much less discussion on location-based steps, i.e., regis-tering steps to different locations. Issues such as battery consumption and positioning accuracy in covered areas are considered challenging when using smartphone as a tool to track movements [1, 11].
Even for the studies that have considered location-activity interaction, point locations and point density are usually the only information captured as the character-istics of the activities or the individuals’ activity space. Data that are critical to understanding the activity, such as the intensity and duration of the activity that occurred in different locations are usually missing. Another miss-ing piece of information in the empirical studies usmiss-ing smartphone-tracked activity is how accurate the point locations are at various locations. This piece of informa-tion is vital because posiinforma-tioning can be less precise in covered areas or urban canyons, resulting in finding that may be less reliable.
Second, in studies analyzing activities, data regard-ing environmental features are often examined as cor-relates. Conventional approaches rely on official and commercial datasets, which demonstrate issues of data availability, hierarchy and subjectivity. Nowadays, crowd-sourcing geographic data, such as OpenStreetMap (OSM) are increasingly detailed and accessible. As approaches to collectively produce knowledge, OSM offers new ways in unfolding the fine-scale phenomena that are usually neglected by official datasets. If smartphone-based track-ing can be integrated and analyzed with OSM data easily, researchers could gain greater access to rich data regard-ing a broad range of place of interests (POIs). In addition, OSM uses hierarchical tile systems (i.e. a grid system that controls the level of detail a map should display) to store and display geographic information. The strength in the tile system is that data are extracted and prepared at dif-ferent scales, boosting the computerational efficiency. In order for the human activity research community to take advantage of the rich OSM dataset, new approaches that can process activity data and link them with OSM data become critical.
To fill these gaps, we proposed and implemented an innovative system that integrated smartphone-based step tracking and the sequential tile scan techniques to collect and process activity data at various spatial scales.
For data collection, the system involved using smart-phones as mobile sensors to collect location-based steps. We used a smart sensor coordination approach to track users’ locations and steps. Such an approach can improve the previously reported limitations in using smartphone as an activity tracker. For data processing, we proposed the sequential tile scan technique to calculate the activ-ity routes and the associated attributes (i.e. probabilactiv-ity, step, and duration surfaces). We applied OSM tile sys-tem to aggregate the positioning points at variable scales. The duration surface represents the duration of activity in every tile. The step surface measured the spatial distri-bution of steps and displayed the tiles that were associ-ated with more steps. The probability surface estimassoci-ated how accurate the location logs were in every tile. With this approach, researchers can readily link a multifold of activity data, e.g., steps during physical activity, dura-tion of stay in a certain area, with OSM informadura-tion at various scales. In the following sections, we introduce related studies, explain the system in detail, and present an example application of the approach.
Related studies
Monitoring individual’s environmental exposure in behavioral research
Prolonged inactivity poses a critical, life-long health risk. A growing body of evidence indicates that built environ-ment characteristics influence lifestyles. For example, people who live in neighborhoods that are close to stores, recreational places, green spaces, playgrounds, walkways, and bike paths participate in more active travel and have a lower body weight [6, 12, 29].
The limitation exists in studies analyzing people’s die-tary environment. Many studies have computed diedie-tary environment based on pre-defined areal units or buffer areas around individuals’ home addresses [7]. However, the measured environment may be very different from where individuals choose to eat. For example, when one drives along the highway, the neighborhoods close by are not easy to access despite the proximity. The uncertainty of contextual influences that individuals experience calls for a detailed activity data and multi-facet business infor-mation to ensure the rigor of the measured environment [10].
Smartphone‑based tracking
Issues related to GPS devices and accelerometers in activity tracking involve the cumbersomeness in wearing two sets of devices, technical difficulties, and time com-mitment [30, 31]. In comparison, smartphone tracking demonstrated fewer participant dropouts and greater capabilities in incorporating acceleration values [16]. As a result, smartphones have been used as “urban sens-ing” devices and are used in studies examining travel and activity patterns [24].
Despite its advantages, smartphone tracking is not without limitations [9]. Recording accuracy, especially with signal losses in indoor areas and areas with dense foliage or buildings, has been a challenge for all types of GPS tracking [3]. In addition, step counting has become common in different smartphone operating systems. Most modern smartphones are equipped with motion sensors. For Android, since API level 19 (KITKAT), most Android phones provide step counter that tracks the number of steps taken by users. For iOS, since iPhone 5 s, similar sensors have been used to record daily steps. Experiments have reported that smartphone-based step detectors perform as accurately as most wearable devices [8]. However, beyond the summary number of total step count, applications to record steps along with the loca-tion informaloca-tion on a continuous base have been lacking.
Shifting scales and the OSM tiles systems
In the past two decades, the environmental health research community has more attention on disaggregated and individual scales. Regarding GIS-based analysis, the traditional uneven access to data and tools between experts and local citizens poses important hurdles. Public
participation geographic information systems (PPGIS) initiatives were proposed to combat such unevenness [14, 25]. As an innovative type of PPGIS, the OpenStreetMap takes inputs and edits from certified users, who usually are locals with knowledge about their environments. The data collected for OSM are at the most disaggregated, individual scale and can support inquiries at a variety of levels. To assist flexible data output, the tile system is used so that data can be presented based on the zoom level specified by the user.
This approach has huge potentials in analyzing and visualizing individual travel behavior. These strengths call for a platform that could integrate activity location collection, storage, visualization, and analysis using the OSM tile systems. Based on the tile system, data and analysis can be dynamic and flexible.
Methods
Location‑based steps
In this study, we used the Android platform to implement the location-based steps. Both motion sensors and posi-tion sensors were applied in our program. For posiposi-tion sensors, devices used GPS or network (cellular tower or WiFi access points) to determine the locations. Table 1 shows the strengths and limitations of of the three types of the positioning sensors [28], based on which we devel-oped our system using a hybrid-positioning scheme to detect location-based steps.
We used several techniques to reduce the battery cost, such as sensor rotation and activity controlled switch [32]. Generally, sensor rotation aims to rotate network-based and GPS-network-based positioning. The activity con-trolled switch turns on location sensor when people start moving while turns off the location sensor when people become still. In this study, we developed two modules to control the sensors, i.e., control module and sensor ule. Location and step information from the sensor mod-ule is sent to the control modmod-ule every 30 s. The control module determines the sensor statuses and sends com-mands back to the sensor module. We set the frequency of location updates to be 10 s and 10 m in minimum dis-placement between location updates if positioning sensor is switched on. Outputs of the program included move-ment trajectories and steps in continuous space and time dimensions.
Table 1 The strengths and limitations for each of these sensors [28]
Techniques Spatial accuracy (m) Battery Consumption Limitations
GPS (A-GPS) 8 High Indoors or high rise areas
WiFi 74 Low Areas without access points
OSM tile system
Once the steps and movement data were collected, the next step was to construct the activity space and associ-ate activities with the environment. Currently, OSM and some other mapping service providers, such as Google Maps, offer rich geographic information. It would be ideal to link location-based steps with their tile systems directly. One approach would be directly converting
The OSM tiles that are associated with different zoom levels are predefined for the entire earth. Therefore, we set up the positioning points with the tiles at different zoom level directly. There are three advantages to set up the activity data display and analysis system in such a way. First, instead of creating a grid of tiles within the rectangular extent defined by all the positioning points, we only needed to identify the tiles that intersected with the positioning points. This process largely addressed the storage redundancy problem. Second, because the tile systems were associated with multiple zoom levels, it was fast and easy to switch research granularity at different spatial scales. For instance, for the same dataset, higher zoom levels (e.g., zoom 22) could be selected when the research question was at the scale of urban streets, while lower zoom level (e.g. zoom 18) could be used when there was a need to aggregate the data to a larger area. Third, tiles from the OSM offered rich geographic infor-mation (e.g., stores, parks, and road networks). Such geo-graphic information can be directly tied to the activity data to analyze the association between human behavior and the environmental context.
The OSM use a Spherical Mercator Projection coordi-nate system. The tile system includes tiles in a hierarchi-cal structure based on zoom levels. For instance, at zoom level 0, the world is represented by 1 tile while at zoom level 2, the world is divided into 16 tiles. Tile number is determined by N=2n×2n , where n is the zoom level [20].
To convert positioning points to tile IDs, the following equations were applied to the latitude and longitude pairs [20].
where lat, lon are the coordinates, toRadians converts angle degrees to radians.
Mapping positioning points to the tile system
Once we converted points into the tile system, we need to determine the path that connected adjacent position-ing points to form activity routes. In computer graphics, the Bresenham’s line algorithm [5] provides an efficient way to form a close approximation of straight-line grids L=2n
IDx=Math.floor
�
L∗
�(
lon+180)
360
��
IDy=Math.floor
L∗
1−
Math. log�Math. tan(Math.toRadians(lat))+ 1
Math. cos(Math.toRadians(lat)) �
Math.PI
2
Fig. 1 Raster space for trajectory. Points represent trajectory of a person moves from origin A to destination B. Yellow grid shows the grids overlapped with positioning points
positioning points into grids. Tools such as Points to Grid are available in most GIS programs to achieve such a conversion. However, it would be redundant to store every grid when no activity falls in the grid (grey grids in Fig. 1). The storage redundancy is especially significant if the raster covers a wide area with high resolution but the actual activities happen sparsely. The following sections introduce our proposed method.
between two given points. In this project, we extended Bresenham’s line to construct the activity routes.
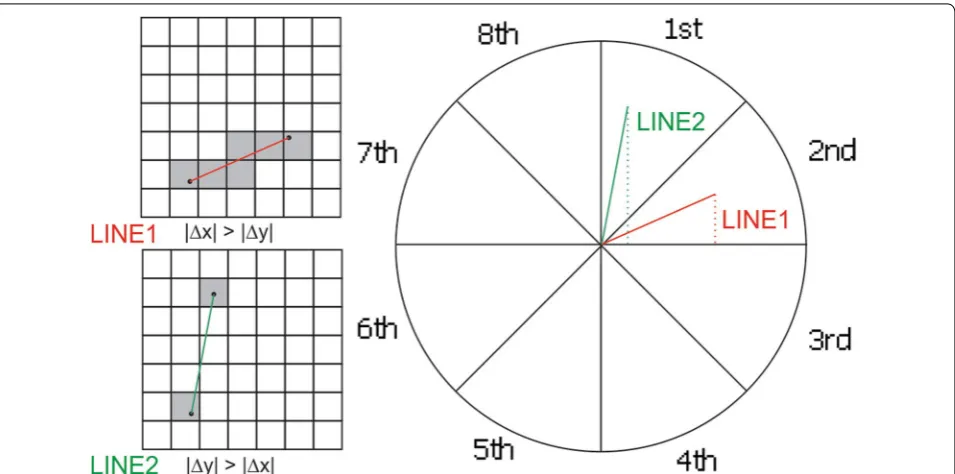
Suppose we used LINE1 to link two adjacent posi-tioning points and we aimed to find the tiles intersect with such line. If we scanned tiles horizontally, when |∆x| ≥ |∆y| (LINE1), the y-axis increment associated with one unit x-axis increase would be less than one. This process would produce continuous tiles. However, when |∆y| ≥ |∆x| (LINE2), the above-mentioned equa-tion would generate disconnected tiles (Fig. 2). Hence, we considered conditions in different octants. In addition, when calculating the slope, using floating-point data type and considering infinitely large slope would decrease the efficiency. Therefore, we used the Bresenham’s line algorithm to simplify the line tile intersection problem by only using integer variables and removing the costly division operation for slope calculation (Algorithm 1). This process was efficient in generating straight-line grids between two given points.
Step and duration surfaces
After mapping points to the tile system and connecting tiles with straight-line grids, we computed the number of steps and activity duration within each tile. We assumed uniform motion between two adjacent points, which was reasonable with a short sampling interval. Hence, we divided the steps and duration by the tile numbers between the adjacent positioning points. The results were assigned to each tile. Because the sum of the probabilities of all the tiles along each perpendicular scan equaled to one, the total numbers of steps (or duration) was calcu-lated as Stotal=rangei
seq
j pi×sj , where range is the
width of the possible tiles on the perpendicular direction, seq is the total number of tiles between the two points, and p and s are the probability score and step number allocated to each tile.
Probability surface
We also estimated the activity probability surface. The accuracy of the positioning points could vary from meters to thousand meters. Therefore, quantifying the probabil-ity of a point locating in a certain tile was important. The app reported both the locations and the estimated accu-racy range. The red points on Fig. 3 were the measured positioning points, and the dashed circles were the accu-racy ranges. When the accuaccu-racy range was smaller than the tile resolution, the person was very likely located inside the tile. When we increased the zoom level, the certainty of person in a particular tile decreased. In addi-tion, the tiles along the route that connected two adjacent points became more uncertain. In this study, we assumed that people were more likely to move in a straight line between two adjacent points. The assumption was espe-cially safe with short intervals (e.g. 30 s). It was also rea-sonable to assume that the probabilities decreased when the distance increases away from the central straight line. For instance, at Zoom Level III in Fig. 3, tiles intersected with the straight line between two points had the highest present probability. The probabilities gradually fell as the tiles moved away from the central straight line.
Extracting place of interest from OSM
After detecting when and where people were active at multiple geographic scales, we needed to extract environ-mental associates of human activities from OSM. OSM provides rich and free geographic data available across the world. The tags along with geographic data also bring additional information, such as names, addresses, and land use type to complement activity information. We first extracted POIs from all OSM tags. The POI set was based on OSM Map Feature List (https ://wiki. opens treet map.org/wiki/Map_Featu res). We applied
OsmPoisPbf (https ://githu b.com/MorbZ /OsmPo isPbf ) to filter geographic features and stored them in Post-GIS database. The tags in key-value pairs were stored as hstore data type. Second, we conducted spatial queries in PostGIS to select geographic features that overlap with activity tiles and appended the tag information from OSM to the end of corresponding activity tiles.
Application of the system in public health
There is a growing interest in developing new ways to measure personal activity and determine the environ-mental features that are relevant to the behavioral pat-terns and health consequences. Dietary environment is one of the topics.To demonstrate the effectiveness of our system within the context of human’s dietary envi-ronment, we tested the application for 5 days, aiming to capture information about physical activity and dietary space. In the result section, we present the performance of the application in capturing and integrating informa-tion such as steps, activity durainforma-tion, locainforma-tions, and pat-terns generated by examining the smartphone and OSM datasets.
Results
App interface
Figure 5 shows the main functionalities of the applica-tion. The interface is easy-to-follow and self-explanatory. We focused on the main functions and techniques that coordinated location and motion sensors rather than interface design in this project. Screen (a) shows the login
page. Screen (b) shows the main menu. It allows users to start or stop monitoring, upload data, and look up pre-vious location-based steps. Screen (c) is the monitoring page; the instantaneous steps and locations are updated on the map and the information section at the bottom of the page. Screen (d) shows a list of recorded steps and
activity durations for each day. Once a record is selected, Screen (e) will display the step surface.
Multi‑dimensional attributes of travel behaviors
To demonstrate the effectiveness of the application in capturing multi-dimensional attributes of travel
Fig. 3 Probability surfaces at different zoom level for the same positioning points and accuracy
Fig. 4 The process to compute the probability surface connecting the adjacent two positioning points
behaviors, one researcher used the app for 5 days and analyzed the trajectories and relevant information. The resulting test data include a sum of 43.11 h of informa-tion. We collected 2245 point locations, translating to 1053 tiles at level 19. The positioning accuracy ranged from 3 meters to 2900 m, with a median accuracy of 12 meters. In our project, the system generated three layers to represent the activity space: activity step surface, dura-tion surface, and probability surface.
Step surface
The step surface demonstrated the locations where the user actually walked. People’s activity space may cover a broad area, but the places where people actually walked can be very limited. For the step surface, the value asso-ciated with each tile is the actual steps accumulated in the corresponding tile. Figure 6 shows the distribution of moving trajectories at zoom level 19. The colors in the map represent the number of steps: the green end of the color ramp representing fewer steps and the red end of the color ramp representing more steps. Numbers at the bottom present the daily step counts. From this surface, we could identify the locations where steps concentrated.
Duration surface
In addition to the step surface, we also produced the duration surface to map where and how long people stay in each area in their daily life. By doing so, we could find anchor points (e.g. home or workspace) for users’ daily activities. To better illustrate the duration surface, we plotted the travel behavior on Day 5 at a higher zoom level (Zoom Level 22). Figure 7 shows the duration sur-face. The longest duration of activity within a tile is 47 min. Among all activity tiles, we can spot two places (Spots A and B) with higher duration value. These two places were the home and workplace for the user. Spot
C also emerged as an important destination. In addition, the tile system at level 22 displays very detailed ground information about the locations visited. For example, Fig. 7d, e show the buildings where the individual spent most of his/her time.
Probability surface
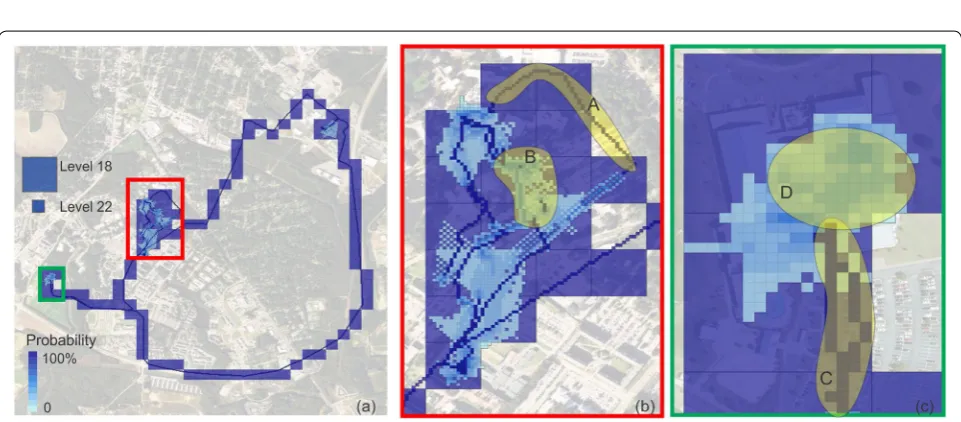
Probability surface was generated to show the accuracy of the locations. Figure 8 shows the probability surface of the individual’s daily activities. We used two zoom levels (i.e. Level 18 and 22) to reflect the probability surface on Day 5. At Level 18, the resolution for each tile was about 128 meters in this area. Most tiles at this zoom level had a probability of 100%, which suggested that we were very positive that the individual had their footprints on these tiles. At level 22, the resolution for each tile was about 8 meters in the study area. This level provided detailed movement information. In addition, when the position-ing accuracy was high, we could acquire very certain esti-mation about the actual movement path (such as route A). On the other hand, when the positioning accuracy was relatively low (lower than the resolution level), we still could map out the possible path and the associated probability scores (such as area B). Figure 8c shows the contrast between outdoor and indoor activities. GPS provided high positioning accuracy outdoors, so the cer-tainty of tiles was very high (Area C). When using net-work positioning inside the building, although the overall accuracy was lower, we could still map out the most pos-sible activity space (Spot D) in the building by using the probability surface.
POI detections
With these in-depth examinations of individual’s route, steps, and duration of stay, we could investigate the envi-ronmental associates of the travel behaviors. Using the
OSM tile system, travel behavior were directly linked with points of interests (POIs) provided by OSM data. This feature supported visual assessment and further spatial statistical analyses in examining the correlation
between characteristics of destinations and physical activity. To show the corresponding POIs where high number of steps concentrated, we queried the OSM database to detect POIs. Figure 9 shows the most active
Fig. 7 The duration surface of a user’s activities. Tiles with darker color represent longer stay time. Two places with significantly longer stay duration are at Spot A and B. b shows the enlarged map for the red box on a and c shows the enlarged map for the green box on a. d, e show the detailed locations for spot A and B receptively
places and their POI information. We identified that the user was most active in the recreational activities center, tennis courts, and the Herty Building. The corresponding steps at these places were also displayed.
Activities happen in restaurants or grocery stores are important indicators in analyzing people’s dietary behav-iors. We integrated the trajectory data with OSM data to detect dining or grocery shopping activities. POIs in tiles related to food and grocery were selected if trajec-tories intersected with those tiles for more than 5 min. Figure 10 shows the POIs related to dining and grocery places the user visited in the 5-day case study. From the POIs, we found that the user visited at least two fast food venues (Chick-fil-A and Wendy’s) and two grocery stores.
Change between spatial scales
Flexible and agile methods to process activity data across multiple scales help facilitate activity data analysis. In order to evaluate the performance of our methods to process activity data across multiple scales, we collected a larger scale dataset with GPS positions to test the algo-rithm. Figure 11 shows the user continuously drove for 164.3 miles on the highway while using the app. Each black dot on the figure represents one positioning point.
We collected 1003 points along this route. Using this dataset, we compared the computation time, resolution, and tile numbers generated for multiple zoom levels. Fig-ure 11b shows an enlarged road segment, which shows the tiles at zoom levels from 17 to 23. The higher the zoom level, the better the tiles fit the actual route. When the zoom level is greater than 21, the generated tiles can mostly represent the actual route.
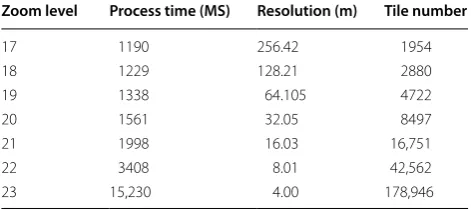
Table 2 shows the process time in milliseconds, tile res-olutions in meters, and the generated tile numbers asso-ciated with each zoom level. At zoom level 22, the system generated 42,562 tiles in 3.4 s on a computer with 16 GB memory and Intel i7-4770 at 3.4 GHz processor. A reso-lution of 8 meters was high enough for most applications and it was very fast to generate these tiles.
To summarize the results, the sequential tile scan tech-nique can estimate the step, duration and probability surfaces efficiently, which is very useful in quantifying multi-dimensional attributes of the activity spaces. We applied OSM tile system to aggregate the positioning points at various scales. Activity spaces were compatible with OSM tile systems, which facilitated geographic data collection and examination along with the human activity data.
Fig. 9 POIs, corresponding tags, and steps numbers at the most active places in the 5-day moving trajectory. Information in the dashed boxes is derived from OSM tags
Discussion
Conceptually, this study offers a new way of examining and aggregating individual GPS trajectories. First, this platform supports research that examines individual’s travel trajectories. By focusing on daily activity places instead of the arbitrary residential neighborhood, this approach represents improvements in capturing the environmental exposure associated with behavioral and health outcomes. Moreover, based on the collected posi-tioning points, we computed a continuous probability surface to quantify the likelihood of individuals being at certain locations.
Another methodological contribution of this study is to tie multi-dimensional attributes, e.g. the step and dura-tion surfaces with travel patterns. In human–environ-ment research, methods have been proposed to delineate the contextual areas to which individuals expose based on GPS points, but limited attention has been paid to iden-tifying walking behavior and recording the duration of
activities in specific environmental context. As a result, the entire activity space is usually given equal consid-eration when analyzing the environmental associates of behavior. However, as we know from previous research, the health and behavioral outcomes vary based on type of activity, intensity, and duration [2]. Our approach pro-vides data regarding steps and duration of activity in the different tiles that could be examined in relation to differ-ent environmdiffer-ental characteristics.
Also, the aggregation process helps safeguard the privacy issue associated with personal location data. Researchers and individual users can select to release data at the level where private information cannot be traced, which is particularly useful in generating visuali-zations to show the spatial patterns of travel behavior.
Finally, this proposed platform combines a number of GPS data collection, visualization and analysis function-alities for research and everyday use. The technical issues regarding transforming and converting data across plat-forms present challenge for researchers and limits the use of GPS tracking in a variety of research. Our platform, however, supports processes that involves the collection of individual data, aggregation based on specific research goals and analytical needs.
There are several limitations in this study. First, because the possible tiles that connect origin and destination were interpolated based on the consecutive location points, locations where the signal is weak or the partici-pant is sedentary were not recorded. Therefore, the data has to be cleaned and incorrect trajectory records needed to be removed. In future studies, we will incorporate the road network data and map matching methods to address such situations. Second, the comprehensiveness of OSM data varies in different cities. When analyzing the
Fig. 11 a GPS point distribution along a high way. b An enlarged map to show tile size at different zoom levels from 17 to 23
Table 2 Process time, resolution, and tile numbers that corresponding to different zoom level
Zoom level Process time (MS) Resolution (m) Tile number
17 1190 256.42 1954
18 1229 128.21 2880
19 1338 64.105 4722
20 1561 32.05 8497
21 1998 16.03 16,751
22 3408 8.01 42,562
activities along with OSM data, the richness of the find-ings rely heavily on detailed information regarding POIs. In the future, we can combine geographic data from mul-tiple sources to increase the coverage of POIs in cities. Third, because our focus of this project was to develop the functionality to capture multi-dimensional attributes of activities, we did not deploy our application to a larger group of participants. Instead, we only obtained a test dataset by running the app for 5 days. The application was able to capture useful information at multiple scales. We also demonstrated the captured information could be used in projects in measuring physical activities and environmental exposure. In the future, we plan to con-duct a comprehensive assessment. We will recruit par-ticipants and invite them to use the app for an extended period. Along with the app, we will also use pedometers and accelerometers and self-reported activity diaries to validate the app-based step and duration measures. We also plan to apply the proposed system in empirical stud-ies investigating issues regarding the human–environ-ment interaction, such as crime risk modeling and food exposure analysis.
Conclusion
To conclude, in this study, we proposed and implemented a system that integrates smartphone-based step track-ing and the sequential tile scan techniques to collect and process activity data at various scales. Such a system can be applied to a number of human dynamics studies to achieve better understandings of the behavioral and health consequences related to individual’s environmen-tal exposure.
Authors’ contributions
XZ developed the concept of the multiple attributes of human travel. XZ implemented the concept, XZ and DL jointly collected and analyzed the data, as well as prepared the manuscript. Both authors read and approved the final manuscript.
Author details
1 Department of Geology and Geography, Georgia Southern University, 68 Georgia Ave, Herty Bldg 0201, Statesboro, GA 30460, USA. 2 Yunnan University of Finance and Economics, Longquan Road 237, Kunming 650221, Yunnan, China. 3 Department of Landscape Architecture and Urban Planning, Texas A&M University, College Station, TX 77843, USA.
Acknowledgements
The authors are very grateful to the editor and reviewers’ comments and sug-gestions to the manuscript.
Competing interests
The authors declare that they have no competing interests.
Availability of data and materials
The authors are happy to share the smartphone tool upon email requests.
Consent for publication Not applicable.
Ethics approval and consent to participate Not applicable.
Funding Not applicable.
Publisher’s Note
Springer Nature remains neutral with regard to jurisdictional claims in pub-lished maps and institutional affiliations.
Received: 2 November 2017 Accepted: 20 April 2018
References
1. Abdulazim T, Abdelgawad H, Habib K, Abdulhai B. Using smartphones and sensor technologies to automate collection of travel data. Transp Res Rec: J Transp Res Board. 2013;2383:44–52.
2. Barton J, Pretty J. What is the best dose of nature and green exercise for improving mental health? A multi-study analysis. Environ Sci Technol. 2010;44(10):3947–55.
3. Bellad V, Petovello MG, Lachapelle G. Intermittent tracking in weak signal environments. Paper presented at the Indoor Positioning and Indoor Navigation (IPIN), 2015 International Conference on (2015). 4. Boarnet M, Crane R. The influence of land use on travel behavior:
specification and estimation strategies. Transp Res Part A: Policy Pract. 2001;35(9):823–45.
5. Bresenham J. A linear algorithm for incremental digital display of circular arcs. Commun ACM. 1977;20(2):100–6.
6. Carroll-Scott A, Gilstad-Hayden K, Rosenthal L, Peters SM, McCaslin C, Joyce R, Ickovics JR. Disentangling neighborhood contextual associations with child body mass index, diet, and physical activity: the role of built, socioeconomic, and social environments. Soc Sci Med. 2013;95:106–14. 7. Caspi CE, Sorensen G, Subramanian SV, Kawachi I. The local food
environ-ment and diet: a systematic review. Health Place. 2012;18(5):1172–87. 8. Case MA, Burwick HA, Volpp KG, Patel MS. Accuracy of smartphone
appli-cations and wearable devices for tracking physical activity data. JAMA. 2015;313(6):625–6.
9. Chen R. Introduction to smart phone positioning. Ubiquitous position-ing and mobile location-based services in smart phones. Hershey, PA: IGI Global, 1–31; 2012.
10. Chen X, Kwan MP. Contextual uncertainties, human mobility, and per-ceived food environment: the uncertain geographic context problem in food access research. Am J Pub Health. 2015;105(9):1734–7.
11. Cottrill C, Pereira F, Zhao F, Dias I, Lim H, Ben-Akiva M, Zegras P. Future mobility survey: experience in developing a smartphone-based travel survey in Singapore. Transp Res Rec: J Transp Res Board. 2013;2354:59–67. 12. Duncan MJ, Winkler E, Sugiyama T, Cerin E, Leslie E, Owen N. Relationships
of land use mix with walking for transport: do land uses and geographi-cal sgeographi-cale matter? J Urban Health. 2010;87(5):782–95.
13. Feng J, Glass TA, Curriero FC, Stewart WF, Schwartz BS. The built environ-ment and obesity: a systematic review of the epidemiologic evidence. Health Place. 2010;16(2):175–90.
14. Haklay M. Citizen science and volunteered geographic information: overview and typology of participation. In: Crowdsourcing geographic knowledge. Dordrecht: Springer; 2013. p. 105–22.
15. Handy S. Methodologies for exploring the link between urban form and travel behavior. Transp Res Part D: Transp Environ. 1996;1(2):151–65. 16. Kerr J, Duncan S, Schipperjin J. Using global positioning systems in health
research: a practical approach to data collection and processing. Am J Prev Med. 2011;41(5):532–40.
17. Koohsari MJ, Badland H, Giles-Corti B. (Re)Designing the built environ-ment to support physical activity: bringing public health back into urban design and planning. Cities. 2013;35:294–8.
•fast, convenient online submission •
thorough peer review by experienced researchers in your field • rapid publication on acceptance
• support for research data, including large and complex data types •
gold Open Access which fosters wider collaboration and increased citations maximum visibility for your research: over 100M website views per year •
At BMC, research is always in progress.
Learn more biomedcentral.com/submissions
Ready to submit your research? Choose BMC and benefit from:
19. Nitsche P, Widhalm P, Breuss S, Brändle N, Maurer P. Supporting large-scale travel surveys with smartphones: a practical approach. Transp Res Part C: Emerg Technol. 2014;43:212–21.
20. OSM. (n.d.). Slippy Map Tilenames. from http://wiki.opens treet map.org/ wiki/Slipp y_map_tilen ames.
21. PRC. (2015). Mobile Fact Sheet. from http://www.pewin terne t.org/fact-sheet /mobil e/.
22. Quigg R, Gray A, Reeder AI, Holt A, Waters DL. Using accelerometers and GPS units to identify the proportion of daily physical activity located in parks with playgrounds in New Zealand children. Prev Med. 2010;50(5):235–40. 23. Riva M, Gauvin L, Barnett TA. Toward the next generation of research
into small area effects on health: a synthesis of multilevel investiga-tions published since July 1998. J Epidemiol Community Health. 2007;61(10):853–61.
24. Shin D, Aliaga D, Tunçer B, Arisona SM, Kim S, Zünd D, Schmitt G. Urban sensing: using smartphones for transportation mode classification. Com-put Environ Urban Syst. 2015;53:76–86.
25. Sieber R. Public participation geographic information systems: a literature review and framework. Ann Assoc Am Geogr. 2006;96(3):491–507. 26. Stewart OT, Moudon AV, Fesinmeyer MD, Zhou C, Saelens BE. The
association between park visitation and physical activity measured with accelerometer, GPS, and travel diary. Health Place. 2016;38:82–8.
27. Troped PJ, Wilson JS, Matthews CE, Cromley EK, Melly SJ. The built environment and location-based physical activity. Am J Prev Med. 2010;38(4):429–38.
28. Zandbergen PA. Accuracy of iPhone locations: a comparison of assisted GPS, WiFi and cellular positioning. Trans GIS. 2009;13(s1):5–25. 29. Zenk SN, Schulz AJ, Matthews SA, Odoms-Young A, Wilbur J, Wegrzyn L,
Stokes C. Activity space environment and dietary and physical activity behaviors: a pilot study. Health Place. 2011;17(5):1150–61.
30. Zhou X, Li D, Larsen L. Using web-based participatory mapping to inves-tigate children’s perceptions and the spatial distribution of outdoor play places. Environ Behav. 2016;48(7):859–84.
31. Zhou X, Yu W, Sullivan WC. Making pervasive sensing possible: effective travel mode sensing based on smartphones. Comput Environ Urban Syst. 2016;58:52–9.
![Table 1 The strengths and limitations for each of these sensors [28]](https://thumb-us.123doks.com/thumbv2/123dok_us/764787.2072540/3.595.56.544.667.724/table-strengths-limitations-sensors.webp)