Available Online At www.ijpret.com
INTERNATIONAL JOURNAL OF PURE AND
APPLIED RESEARCH IN ENGINEERING AND
TECHNOLOGY
A PATH FOR HORIZING YOUR INNOVATIVE WORK
IMAGE SEGMENTATION USING FUZZY CLUSTERING ALGORITHM
SHAILESH KHANDARE, RAHUL NARSING
Babasaheb Naik College of Engg, Computer Science & Engineering Department, Pusad, India.
Accepted Date:
27/02/2013
Publish Date: 01/04/2013
Keywords
Unsupervised Clustering
Methods,
Fuzzy C-means,
Kernel weighted Fuzzy
C-means
Corresponding Author
Mr. Maulik Patel
Abstract
In this paper, image segmentation is performed with the help
of fuzzy clustering algorithms. Here fuzzy c-means algorithm
and kernel weighted fuzzy c-means algorithm is used for
clustering. After the segmentation of the image, comparison of
the results will be done on the basis of execution time, number
Available Online At www.ijpret.com
I.INTRODUCTION
Pattern analysis is considered as a very
important science in the real world. Cluster
analysis is found to be one of the useful tools
for data analysis. It is a method for finding
clusters of a data set with most similarity in
the same cluster and most dissimilarity
between different clusters. Image
segmentation can be done with the help of
fuzzy clustering Since Zadeh proposed fuzzy
sets that introduced the idea of partial
memberships described by membership
functions; it has been successfully applied in
various areas. Especially, fuzzy sets could
allow membership functions to all clusters in
a data set so that it is very suitable for cluster
analysis. Ruspini first proposed fuzzy
c-partitions as a fuzzy approach to clustering.
Later, the fuzzy c-means (FCM) algorithms
with a weighting exponent m = 2 proposed
by Dunn, and then generalized by Bezdek
with m > 1 became popular.
Image segmentation algorithm is a crucial
step in image processing and analysis. It plays
a vital role in many fields such as computer
vision, pattern recognition and medical
image processing numerical taxonomy,
image processing, pattern recognition,
medicine, economics, ecology, marketing,
artificial intelligence, data mining,
engineering systems, and gene expression.
The goal of segmentation is to separate an
image into some regions of feature and to
pick up the interesting objects. Image
segmentation is nothing but the grouping of
pixels into individual clusters in such a way
that the pixels from the same cluster are
more similar to each other than pixels from
different clusters. In non-fuzzy or hard
clustering, data is divided into crisp clusters,
where each data point belongs to exactly one
cluster. Fuzzy clustering algorithm compares
the intensity in a relative way and groups
them into clusters. The grouped clusters are
not with crisp boundaries.
Although a lot of works have been done,
there is still not a general segmentation
algorithm and a impersonality criterion to
estimate the segmentation. According to
concrete instances, many segmentation
algorithms have been put forward. Among
them, image segmentation algorithm based
on fuzzy c-means is an important algorithm
in the image segmentation field. It could
retain much more information from the
original image than hard segmentation
methods.
In fuzzy clustering, the fuzzy c-means (FCM)
Available Online At www.ijpret.com
the FCM algorithm is the best known, it has
several drawbacks. For example, the points
in the data set are supposed to be equally
important, the number of points in the
clusters is almost equal, nearly all points do
not have a membership value of one, and the
outliers always affect the clustering results.
To overcome these drawbacks, many
generalized FCM algorithms have been
proposed. Gaussian kernel-based FCM
(GKFCM) algorithm is one of them with a
spatial bias correction.
I. II. FUZZY C-MEANS CLUSTERING
Fuzzy C-means Clustering (FCM) is also
known as Fuzzy ISODATA. The FCM employs
fuzzy partitioning such that a data point can
belong to all groups with different
membership grades between 0 and 1. FCM is
an iterative algorithm. The aim of FCM is to
find cluster centers (centroids) that minimize
a dissimilarity function. Input and output
detail are given as
Input:
(1) X = {x1, . . .,xn}, xi∈R s
, the data set
(2) c, 2 ≤ c ≤ n, the number of clusters
(3) > 0, the stopping criterion of algorithm
(4) a(0)=(a1 (0)
,……ac (0)
), the initials of cluster
centers
Output:
a = {a1, a2. . .ac}, the final cluster centers
FCM determines the cluster centers ci and
the membership matrix U using the following
steps:
Step1: Initialize the membership matrix U
with random values between 0 and 1 such
that the constraints in following equation are
satisfied.
∀ ∑ . = 1
(2.1)
Step2: Calculate fuzzy cluster centers ci , i
=1……….c using the following equation.
= ∑ k ∑ k
(2.2)
Step3: Compute the cost function according
to following equation.
! = ∑ ∑%" $# "# &∅( #) − ∅ +" &,
(2.3)
Where &∅( #) − ∅ +" &, is the Euclidean
distance between i th cluster center and jth
Available Online At www.ijpret.com
exponent. Stop if either it is below a certain
tolerance value or its improvement over
previous iteration is below a certain
threshold.
Step4: Compute a new U using following
equation and go to step2
-"# = 1/ ∑ (/"#// #),/ 0
(2.4)
Here /"# = ||∅ #− +"||
By iteratively updating the cluster centers
and the membership grades for each data
point, FCM iteratively moves the cluster
centers to the "right" location within a data
set.
FCM does not ensure that it converges to an
optimal solution. Because of cluster centers
(centroids) are initialize using U that
randomly initialized.(Equation 2.2).
Performance depends on initial centroids.
For a robust approach there are two ways
which is described below.
1-) Using an algorithm to determine all of the
centroids. (for example: arithmetic means of
all data points)
2-) Run FCM several times each starting with
different initial centroids.
III. KERNEL WEIGHTED FUZZY C-MEANS
CLUSTERING
An alternative kernel weighted fuzzy c-means
(KFCM) algorithm is proposed to cluster
incomplete data. Unlike the usual way
utilizing kernel method in FCM, the proposed
KFCM clustering algorithm is performed still
in original data space, i.e., prototypes lie in
data space. Furthermore, KFCM adopts a
more robust kernel-induced metric different
from the Euclidean norm in original FCM.
KFCM has better outlier and noise immunity
than FCM, it is especially suitable to dealing
with incomplete data.
Define a nonlinear map as ∅: → ∅ ∈ 4,
where x ∈ X X denotes the data space, and F
the transformed feature space with higher or
even infinite dimension. KFCM minimizes the
following objective function.
Jm(U,V)=∑ ∑" -" ||∅ − ∅ +" ||,
(3.1)
The algorithm’s input output parameters are
given as follows:
Input:
(1) X = {x1, . . ., xn}, xi∈R s
, the data set
Available Online At www.ijpret.com
(3) > 0, the stopping criterion of algorithm
(4) The values of parameter
(5) a(0)=(a1 (0)
,……ac (0)
), the initials of cluster
centers
Output:
a = {a1,a2, . . .,ac}, the final cluster centers
Algorithm:
The image segmentation algorithm using
fuzzy clustering based on kernel-induced
distance
measure (KWFCM) can be summarized as
follows:
Step1: Initialize the membership matrix U
with random values between 0 and 1 such
that the constraints in following equation are
satisfied.
∀ ∑ . k = 1
(3.2)
Step2: Calculate fuzzy cluster centers ci , i
=1……….c using the following equation.
= ∑ k ∑ k
(3.3)
Step3: Compute the cost function according
to following equation.
! = ∑ ∑$ "#
# %
" &∅( #) − ∅ +" &,
(3.4) &∅( #) − ∅ +" &, = 5 #, # +
5 +", +" − 25( #, +") (3.5)
While using GRBF,
5( ", #) = exp −& <0 =&
>
,?> therefore
k (x ,x ) = 1,then:
&∅( #) − ∅ +" &, =2 @1 − 5( #, +")A
(3.6)
! = 2 ∑ ∑$ "#
# %
" @1 − 5( #, +")A
(3.7)
Stop if either it is below a certain tolerance
value or its improvement over previous
iteration is below a certain threshold.
Step4: Compute a new U using following
equation and go to step2
-# = 1/ ∑ (B# /B ),/ 0 (3.8)
where B# = &∅ − ∅ +# &, = 2 −
Available Online At www.ijpret.com
IV. EXPERIMENTAL RESULTS
This section explains the result obtained after
performing FCM and KWFCM on the satellite
images. For comparing the performance of
the algorithm, we used an experimental
database which consists of 30 satellite
images and 20 SAR images in jpg format. The
experiments are conducted on one of the
satellite (or SAR) image using matlab
platform, coded with FCM and KWFCM then
comparison between the segmented results
is performed based on number of cluster,
execution time, mean absolute error and
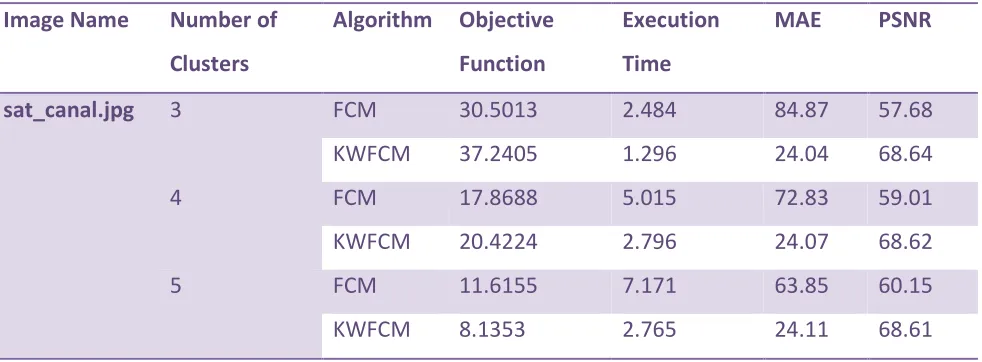
peak signal to noise ratio. Table 1 gives the
comparison of FCM and KWFCM.
In the table, sat_canal.jpg image is taken as
input for segmentation. The FCM and
KWFCM output is compared for the clusters
3, 4 and 5. In this experiment, it can be
observed that when the number of cluster
increases then the execution time for image
segmentation also increases, further it comes
under observation that FCM algorithm faces
local minima problem hence it takes more
time for execution as compare to KFCM.
Mean absolute error (MAE) values decreases,
when there is increase in number of cluster.
FCM algorithm gives noisy results hence FCM
has more MAE as compare to KFCM results.
Peak Signal to Noise Ratio (PSNR) values
increases with increase in number of cluster.
MAE is inversely proportional to PSNR hence
FCM results are having lesser PSNR value as
compare to KFCM results.
V.CONCLUSION
From the experimental results, it is seen that
FCM algorithm is noise sensitive because of
not taking into account the spatial
information in the image. The KWCM
algorithm overcomes the above problem. It
includes a class of robust non-Euclidean
distance measures for the original data space
to derive new objective functions and thus
clustering the non-Euclidean structures in
data. The experiments on the Satellite
images and SAR images show that KWFCM
can segment images more effectively and
provide more robust segmentation results
than FCM. It is robust to noise and outliers
and also tolerates unequal sized clusters.
Comparison of KWFCM and FCM using PSNR,
MAE, Number of clusters and Execution time
as performance metric shows that KWFCM
achieves better segmentation results than
Available Online At www.ijpret.com
REFERENCES
1. Xin-Bo Zhang And Li Jiang, “ An Image
Segmentation Algorithm Based On Fuzzy
C-Means Clustering” Proceeding Of Ieee
International Conference On Digital
Image Processing, Vol. 29, Issue.24,
Pp.:22-26,2009.
2. Yanling Li And Yi Shen, “Robust Image
Segmentation Algorithm Using Fuzzy
Clustering Based On Kernel-Induced
Distance Measure” Proceeding Of The
2008 Ieee International Conference On
Computer Science And Software
Engineering, Vol. 26, Issue.54.
Pp.:1065-1068, 2008
3. D.R. Chittajallu, G. Brunner, U. Kurkure
R.P. Yalamanchili And I.A. Kakadiaris,
“Fuzzy-Cuts: A Knowledge-Driven
Graph-Based Method For Medical Image
Segmentation”, Proceeding Of The Ieee,
Vol. 68, Issue.13, Pp.:715-722, 2009
4. B Sowmya And B Sheelarani, “Image
Segmentation Using Reformed Fuzzy
Clustering Technique” Proceeding Of
Csi , Vol. 33, Issue 3, Pp.:14-18, 2009
5. Maryam Hasanzadeh, Shoreh Kasaei and
Hadis Mohseni, “A New Fuzzy
Connectedness Relation for Image
Segmentation” proceeding of the IEEE,
vol. 42, issue 4, pp.:453-458, 2004
6. J. K. Udupa, and P. K. Saha, “Fuzzy
connectedness and image
segmentation”, Proceedings of the IEEE,
vol. 91, issue.10, pp.:1649 –1669, 2003
7. Li Chunmao', Wang Lingzhi and Wu
Shunjun “Ant Colony Fuzzy Clustering
Algorithm Applied to SAR Image
Segmentation” Proceedings of the IEEE,
vol. 52, issue.34,pp.:69 –72, 2006
8. Martin Tabakov “A Fuzzy Clustering
Technique for Medical Image
Segmentation” 2006 International
Symposium on Evolving Fuzzy Systems,
vol.-74, issue.61, pp.:118-122,
Available Online At www.ijpret.com
Image Name Number of
Clusters
Algorithm Objective
Function
Execution
Time
MAE PSNR
sat_canal.jpg 3 FCM 30.5013 2.484 84.87 57.68
KWFCM 37.2405 1.296 24.04 68.64
4 FCM 17.8688 5.015 72.83 59.01
KWFCM 20.4224 2.796 24.07 68.62
5 FCM 11.6155 7.171 63.85 60.15
KWFCM 8.1353 2.765 24.11 68.61
Table 1. Comparison of FCM and KFCM algorithm
Available Online At www.ijpret.com
(sat_canal.jpg)
FCM: Number of clusters=3
( partition matrix)
(Objective function plot)
FCM: No of clusters=4
(partition Matrix)
Available Online At www.ijpret.com
FCM: No of cluster= 5
( partition Matrix)
(Objective function plot)
KFCM: No of clusters=3
(Objective function plot)
Available Online At www.ijpret.com
KFCM: no of clusters=4
( Objective function plot)
(partition Matrix)
KFCM: no of clusters=5
(Objective function plot)
Available Online At www.ijpret.com
Comparison of results
Objective function based:
Number of clusters=3
Objective function
comparison for c=3
Number of clusters=4
Objective function comparison for c=4
Number of Clusters=5
Objective function comparison for c=5
Peak Signal to Noise Ratio based
Comparison of Algorithms based on PSNR
Mean Absolute Error based
Comparison of Algorithms based on MAE
Available Online At www.ijpret.com
Comparison of Algorithms based on