COMPUTER SCIENCE & TECHNOLOGY
www.computerscijournal.org
March 2013, Vol. 6, No. (1): Pgs. 31-40 An International Open Free Access, Peer Reviewed Research Journal
Published By: Oriental Scientific Publishing Co., India.
INTRODUCTION
The Mobile Ad-hoc Network (MANET) is a collection of nodes, which have the possibility to connect on a wireless medium and form an arbitrary dynamic network with wireless links and without any supporting infrastructure. The network can dynamically change with time, new nodes can join, and other nodes can leave the network [C.P. Agrawal et al.,2008]. A large majority of MANET studies are based on simulation techniques using the Random Waypoint mobility model, which is one of the default cases in the Network Simulator
Best Selection of Mobility Model for MANET Using NS-2
SAAD ALJEBORI
1and ALAA TAIMA
21Head of Computer Sciences Department, India.
2 MSc. Student, University of Babylon-College of Sciences-IRAQ 2013, India.
(Received: February 05, 2013; Accepted: February 24, 2013)
ABSTRACT
A mobile ad hoc network (MANET) is an autonomous, self-configuring network of mobile nodes that can be formed without the need of any pre-established infrastructure or centralized administration. MANETs are extremely flexible and each node is free to move independently, in any random direction. Each node in MANET maintains continuously the information required to properly route traffic. This paper presents the mathematical model to select the best mobility model for any MANET using Network Simulator version 2 (NS-2) with respect to four performance metrics (Throughput, Packet Delivery Fraction (PDF), Average End-to-end Delay(AED), and Normalize Routing Load (NRL)) for different scenarios such as different number of nodes, different speeds, different pause times, different environment area and different traffic rates. The weights of these performance metrics are assigned according to user need. We use Ad-hoc On-demand Distance Vector (AODV) as routing protocol and four mobility models (Random Waypoint(RWP), Reference Point Group Model (RPGM), Gauss Markov Model (GMM), Manhattan Grid Model (MGM)). The results indicate that this model is efficient and flexible to select the best mobility model because the weights of performance metrics are determined according to user’s need.
Key words: MANET, AODV, RWP, RPGM, GMM, MGM, Mathematical Model.
is not enough; a given routing protocol may not deliver optimum performance under other mobility models [Fahim Maan et al.,2011]. Certain mobility models can be developed based on network traces. Mobility models can also been developed for simulating specific scenarios to evaluate the network performance.
Related work
R. Manoharan and et al., at 2010 studied three widely used mobility models such as Random Way Point, Reference Point Group and Manhattan mobility that in addition to the strengths and weaknesses of the individual multicast routing protocols, the mobility patterns does also have influence on the performance of the routing
protocols. Multicast Ad hoc On-demand Distance Vector Routing protocol and Adaptive Demand driven Multicast Routing protocol have been chosen and implemented in NS2. They observed that the mobility patterns do also have influence on the performance of the routing protocols [R. Manoharan and et al., 2010].
Sunil Kumar Kaushik et al., at 2012 analyzed the behavior of Five MANETs routing protocols i.e. AODV, DSDV, DSR, OLSR, TORA under the three mobility models (RPGM,CMM,RWP) And then compared the performance of protocols using NS-2 simulator in the area of 700 x 700 m2 which clearly indicate the significant impact on node mobility pattern has
Table 1: HW and OS configuration
Processor Pentium core2due , CPU 2.4 GHz
RAM 2 GB
Hard Disk 320 GB
OS Linux, Ubuntu 10.10
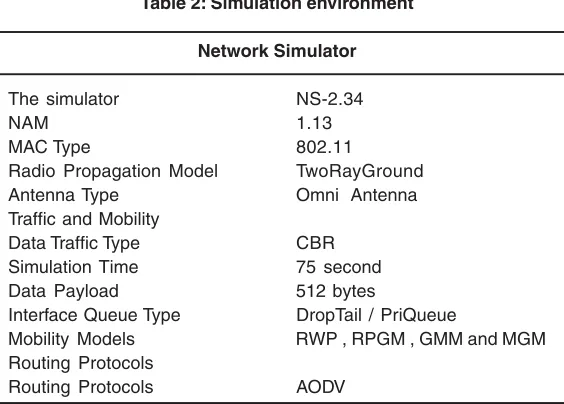
Table 2: Simulation environment
Network Simulator
The simulator NS-2.34
NAM 1.13
MAC Type 802.11
Radio Propagation Model TwoRayGround
Antenna Type Omni Antenna
Traffic and Mobility
Data Traffic Type CBR
Simulation Time 75 second
Data Payload 512 bytes
Interface Queue Type DropTail / PriQueue
Mobility Models RWP , RPGM , GMM and MGM
Routing Protocols
Routing Protocols AODV
Table 3: General Parameters for All Scenarios
Scenario Scenario No. of Node Pause Area Size Traffic
Name Number nodes Speed Time Rate
Varying No. of 1 25 , 50 20 15 1000*1000 4
Nodes 75,100
Varying Node 2 25 10 , 20 10 1000*1000 4
Speeds 40 , 60
Varying Pause 3 50 40 0 , 6 1000*1000 4
Times 10 ,14
Varying Area 4 60 20 12 500*500 , 700*700 4
Sizes 1000*1000 , 1200*1200
Varying 5 75 15 10 1000*1000 4 , 8
Traffic Rates 12 , 16
Table 4: Weights of case 1
Performance Metrics Weight
Throughput 1
PDF 0
NRL 0
AED 0
Table 5: Weights of case 2
Performance Metrics Weight
Throughput 0.25
PDF 0.25
NRL 0.25
on routing performance, these routing protocols were compared in the manner of (PDR), (delay), (NRL) and Throughput when subjected to change in numbers of nodes. Their simulation results show that Reactive protocols is much better than proactive in the manners of packet delivery (PDR), A End-to-End delay(Delay), Normalized routing load(NRD) and throughput [Sunil Kumar Kaushik and et al., 2012].
Prajakta M. Dhamanskar and et al., at 2012 presented the performance of on-demand routing protocols such as AODV, DSR and TORA for mobile nodes following four mobility models such as Random Waypoint (RWP), Random Walk (RW), Manhattan Grid and Reference Point Group mobility model (RPGM).They stated that from the simulation results the conclusion is that performance of RPGM mobility model is the best and performance of Manhattan Grid is the worst as compared to other mobility models for all the three protocols. PDR of AODV and TORA is greater than that of DSR but PDR of TORA is the best. NRL is the least in DSR and Delay is average in TORA [Prajakta M. Dhamanskar and et al., 2012].
Routing protocols
Numbers of routing protocols for Ad Hoc networks were developed and used. Protocols were classified as proactive and reactive protocols [Ejiro .E. Igbesoko et al.,2010]. This work focuses on applying and using the AODV as a reactive protocol. AODV Protocol stands for Ad-hoc On-Demand Distance Vector Routing which maintains a routing table at each node. It is proactive type & contains three essential entries in the routing table for a destination, a next hop node, a sequence number and a hop count. All packets directed to the destination are sent to the next hop node. The sequence number measures the freshness of a route. The hop count represents the current
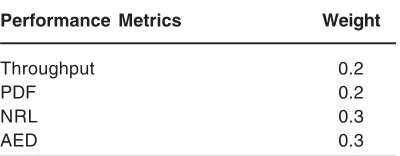
Table 6: Weights of case 3
Performance Metrics Weight
Throughput 0.2
PDF 0.2
NRL 0.3
AED 0.3
distance to the destination node [C.P.Agrawal et al.,2008].
Mobility Models
A mobility model should be attempted to emulate the movements of real mobile nodes. Mobility models are based on setting out different parameters related to the possible node movement. Basic parameters are the starting location of mobile nodes, their movement direction, velocity range, and speed changes over time. Mobility models can be classified into entity and group models. Entity models cover scenarios when mobile nodes move completely independently from each other, while in group models nodes are dependent on each other or on some predefined leader node [T. Camp et al.,2002]. Mobility models are classified into the following categories:
Random Waypoint Mobility Model (RWP)
In RWP mobility model, each node of the network selects a random destination and moves towards it with certain chosen random velocity. Once a node reaches the destination, the node stops for a duration defined by the pause time parameter. After pause time duration, node again selects a random destination and repeats the whole process again until the simulation ends [K. Amjad et al., 2010].
Reference Point Group Mobility Model (RPGM)
In reference point group mobility model, nodes are divided into groups. Every group has a group leader that determines the movements of all nodes in the group. At each instant, speed and direction of group member is calculated based on speed and direction of leader node at that instant. This model represents the movement of soldiers in a battalion, or tourists following a tourist guides[Sri Chusri Haryanti et al., 2011].
Gauss-Markov Mobility Model
stops; quick turns and is close to be realistic[VALENTINA TIMCENKO et al.,2010].
Manhattan Mobility Model
In Manhattan model, movement pattern of mobile nodes were defined by map which composed of a number of horizontal and vertical streets. Node allows moving along the grid of horizontal and vertical streets on the map. Because of temporal dependency, velocity of a mobile node at a particular time is dependent on the velocity of its previous time [Krunal Ptel et al., 2012] .
Network Simulator NS-2
This simulation study has been done using the NS-2 as a network simulator. The network simulator NS-2 is discrete event simulation software for network simulations. It simulates events such as receiving, sending, dropping and forwarding packets. The ns-allinone-2.34 supports simulation for routing protocols in ad hoc wireless networks. NS-2 is written in C++ programming language with Object Tool Common Language. NS-2.34 can be built on different platforms [Neha Rani et al.,2012].
In this paper, a Linux platform (Ubuntu) was chosen. Linux offers a number of programming development tools that can be used with the required simulation process. To run a simulation with NS-2.34, the user must write the OTCL simulation script. The performance parameters can be graphically visualized in GRAPH. Moreover, NS-2 also offers a visual representation of the simulated network by tracing nodes events, movements and writing them in a file called a Network animator (NAM file).
Performance metrics Throughput
Throughput is the average number of messages successfully delivered per unit time number of bits delivered per second [Neha Rani et al.,2012].
Packet delivery fraction (PDF)
PDF is the ratio of data packets delivered to the destination to those generated by the sources [P.Periyasamy et al.,2011].
(PDF = (received packets number/ sent packets number) * 100)
Average end-to-end delay (AED)
Delay caused by latency, buffering, queuing, retransmission and route discovery all are included in this performance analysis. This delay is measured in milliseconds [K. Amjad et al., 2010 a]. The average end-to-end delay is calculated by summing the time taken by all received packets divided by its number.
Normalize Routing Load (NRL)
NRL is the number of control packets transmitted per data packet received at the destination [R. Manoharan et al.,2010].
(NRL = Total routing control packets/ Total received packets).
Methodology for Best Mobility Model Selection
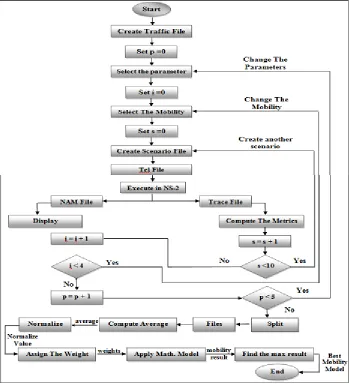
The following flow chart shown in figure (1) clarifies the implementation stages that can be used to select the system for the best mobility model.
The following steps are suggested in this paper to select the best and appropriate mobility model from several mobility models based on their performance metrics:
Step1Start.
Step2Create the traffic generation file “CBR file” that generated by cbrgen.tcl (this script found in ns-allinone-2.34/ns-2.34/ind_util/ cmu_scen_gen/).
Step3Set p = 0 (this variable to determine the number of evaluation cases (parameters)).
Steps4 select the parameters (evaluation cases). This paper simulation includes varying nodes numbers, varying speeds, varying areas and varying pause time.
Step5set i=0 (this variable id to determine the no. of mobility models).
Step7: set s=0 (no. of scenario files (movement files)).
Step8: select the scenario file which used to determine the no. of nodes, speed, pause time, simulation area, traffic rates and topography dimensions.
Step9: create tcl file that represents the simulation environment of MANET with mobility model for certain routing protocol.
Step10:add tcl file as input into NS-2 in order to perform the simulation, the output are NAM and Trace file.
Step11: use NAM file to display all event trough the simulation as visualization review , while the trace file will be used to compute the performance metrics such as (throughput, AED , NRL and PDF) using AWK programming language.
Step12: Increment s by 1.
Step13: if (s<10) then go to step 8 (s is the no. of the scenario files). Otherwise go to step 14.
Step14: Increment i by 1.
Step15: If (i < 4) then go to step 6 (i is the no. of the mobility models evaluated in this paper) . Otherwise, go to step 16.
Step16: Increment p by 1.
Step17: If (p < 5) then go to step4. (p is the no. of the evaluation parameters). Otherwise go to step 18
Step18: split the result files into no. of files (the number of files depends on number mobility models that will evaluated in this paper).
Step19: calculate the final average of performance metrics for all mobility models that will be evaluated to represent its impact on MANET’s performance.
Step20: Normalize the average before applying the mathematical model.
Step21: Assign weight for each performance metric according to user’s need.
Step22: Apply the following mathematical model on the resulted values from normalization method of mobility models.
Where:
M
The value of mobility model performance.
PThro , WThro
The performance metric (Throughput)
and its weight.
PPDF, WPDF
The performance metric (PDF) and its weight.
PNRL , WNRL
The performance metric (NRL) and its weight.
PAED, WAED
The performance metric (AED) and its weight.
Step23:select the best mobility model based on the maximum value of M.
Step24:End.
Simulation Environment
Table (1) represents the required Hardware (HW) and the Operating System (OS) configurations. Table (2) presents the suggested Mamet’s simulation environment implemented in this paper.
Simulation Results
In this s e c t i o n , t h r e e c a s e s w e r e suggested and implemented to apply this mathematical model on below scenarios in table (3), these cases determine the weights of performance metrics which used as metrics to select the best and bad mobility model. The values in this figure shows the values of each mobility model after applied the mathematical model.
Case 1 (The weight of one performance metric is 1): In this case, the weight of one performance metrics is 1 and other metrics are 0. For example, the weights are shown in table (4) :
2 Case 2 (The weights of performance metrics are equal) : In this case, the user assigns the equal weights for all performance metrics to select the best mobility model for all scenarios that shown in table (5.9).
Table (5) shows the weight assigned for each performance metric for this case
a)The best mobility model for scenario1 b)The best mobility model for scenario 2
c)The best mobility model for scenario 3 d) The best mobility model for scenario 4
Fig. 2 (a-e): Histogram of the best mobility model under case 1
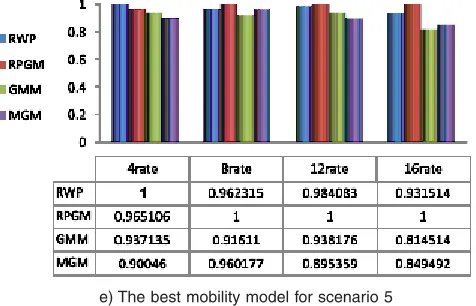
e) The best mobility model for scenario 5
mobility model for five scenarios (scenario1, scenario2, scenario3, scenario4 and scenario5) with respect to case 2.
Case 3: (The weights of performance metrics are different) :
In this case, the user assigns different weights for all performance metrics. For example, the weights are shown in table (6) :
a)The best mobility model for scenario1 b)The best mobility model for scenario 2
c)The best mobility model for scenario 3 d) The best mobility model for scenario 4
e) The best mobility model for scenario 5
Fig. 3: [a-e] : Histogram of the best mobility model under case 2
c)The best mobility model for scenario 3 d) The best mobility model for scenario 4
e) The best mobility model for scenario 5
Fig. 4: [a-e] : Histogram of the best mobility model under case 3
CONCLUSION
In this paper, the mathematical model was built using NS-2 to select the best mobility model in terms of four performance metrics for varying
parameters. After applying this model, we found the RPGM was best mobility model suited for AODV routing protocol when compared to other mobility model.
REFERENCES
1. [C. Gomez et al., 2004]. C. Gomez, X. Marchador, V. Gonzalez and J. Paradells, “Multilayer analysis of the influence of mobility models on TCP flows in AODV ad-hoc networks”, FEDER and the Spanish Gover nment through project TIC2003-01748, Spain (2005).
2. [C.P.Agrawal et al., 2008]. C.P.Agrawal, M.K Tiwari, and O.P.Vyas, “Evaluation of AODV Protocol for Varying Mobility Models of MANET for Ubiquitous Computing”, IEEE, Third 2008 International Conference on Convergence and Hybrid Information Technology, India., (2008).
3. [Ejiro .E. Igbesoko et al., 2010] Ejiro .E. Igbesoko, Thaddeus Onyinye Eze and Mona Ghassemian, “ Performance Analysis of MANET Routing Protocols over Different Mobility Models “, London (2009).
4. [Fahim Maan et al., 2011]. Fahim Maan and Nauman Mazhar, “MANET Routing Protocols vs Mobility Models: A Performance Evaluation”, IEEE (2011). 5. [K. Amjad et al., 2010 a] K. Amjad and A.J.
Conference, 8-9 November 2010, Loughborough, UK.
6. [K. Amjad et al., 2010] K. Amjad and A.J. Stocker, “Impact of node density and mobility on the performance of AODV and DSR in MANETS” , IEEE (2010).
7. [Krunal Ptel et al., 2012] Krunal Ptel and Krunal Ptel, “Performance Evaluation of Stable AODV Routing Protocol under Different Mobility Models”, International Journal of Computer Applications (0975 – 8887) 43(8): (2012).
8. M. Gerharz and C. de Waal. Bonnmotion: A mobility scenario generation and analysis tool. http://web.cs.unibonn.de/IV/ BonnMotion.
9. [Neha Rani et al., 2012] Neha Rani, Preeti Sharma and Pankaj Sharma, “Performance comparison of various routing protocols indifferent mobility models” , International Journal of Ad hoc, Sensor & Ubiquitous Computing (IJASUC) 3(4): (2012). 10. [Preetha Prabhakaran et al., 2005] Preetha
Prabhakaran, “Performance evaluation of mobile ad hoc networks in realistic mobility and fading environments “, MSc. Thesis , University of South Florida Scholar Commons (2005).
11. [P.Periyasamy et al., 2011] P.Periyasamy and Dr.E.Kar thikeyan, “Perfor mance evaluation of aomdv protocol based on various scenario and traffic patterns”, International Journal of Computer Science, Engineering and Applications (IJCSEA)
1(6): (2011).
12. [Prajakta M. Dhamanskar and et al., 2012] Prajakta M. Dhamanskar and Dr. Nupur Giri,
“Performance evaluation of On Demand MANET protocols for different mobility models”, International Journal of Emerging Technology and Advanced Engineering, ISSN 2250-2459, 2(9): (2012).
13. [R. Manoharan et al.,2010] R. Manoharan and E. Ilavarasan, “impact of mobility on the performance of multicast routing protocols in manet”, International Journal of Wireless & Mobile Networks(IJWMN), 2(2): (2010). 14. [Sri Chusri Haryanti et al., 2011] Sri Chusri
Haryanti and Riri Fitri Sari, “Effect of RPGM and Gauss Markov Node Mobility for Resource Allocation Performance in Mobile Ad Hoc Computational Grid”, IJCSNS International Journal of Computer Science and Network Security, 11(6): (2011). 15. [Sunil Kumar Kaushik et al., 2012] Sunil
Kumar Kaushik and Sukhbir Singh ,” Performance Evaluation of Mobile Ad Hoc Networks with Reactive and Proactive Routing Protocols and Mobility Models “ , International Journal of Computer Applications (0975 – 8887), 54(17): (2012). 16. [T. Camp et al., 2002]. Tracy Camp, Jeff Boleng and Vanessa Davies “A Survey of Mobility Models for Ad Hoc Network Research”, Wireless Communication & Mobile Computing (WCMC): 2(5): 483-502 (2002).
![Fig. 3: [a-e] : Histogram of the best mobility model under case 2](https://thumb-us.123doks.com/thumbv2/123dok_us/9813714.1967216/8.576.299.496.109.226/fig-e-histogram-best-mobility-model-case.webp)
![Fig. 4: [a-e] : Histogram of the best mobility model under case 3](https://thumb-us.123doks.com/thumbv2/123dok_us/9813714.1967216/9.576.181.388.259.389/fig-e-histogram-best-mobility-model-case.webp)
