Effects of School-Wide Positive Behavioral Interventions
and Supports on Child Behavior Problems
WHAT’S KNOWN ON THIS SUBJECT: School-Wide Positive Behavioral Interventions and Supports (SWPBIS) is a widely used universal prevention strategy currently implemented in.16 000 schools across the United States. Previous research has shown positive effects on school climate and school-level discipline problems.
WHAT THIS STUDY ADDS: This study reports multilevel results on data from a 4-year randomized controlled effectiveness trial of SWPBIS in 37 elementary schools. Results indicate significant impacts on children’s aggressive behavior problems, concentration problems, office discipline referrals, emotion regulation, and prosocial behavior.
abstract
OBJECTIVE:School-Wide Positive Behavioral Interventions and Supports (SWPBIS) is a universal prevention strategy currently implemented in
.16 000 schools across the United States. SWPBIS intends to reduce students’behavior problems by altering staff behaviors and developing systems and supports to meet children’s behavioral needs. The current study reports intervention effects on child behaviors and adjustment from an effectiveness trial of SWPBIS.
METHODS: The sample of 12 344 elementary school children was 52.9% male, 45.1% African American, and 46.1% Caucasian. Approximately 49% received free or reduced-priced meals, and 12.9% received special educa-tion services at baseline. The trial used a group randomized controlled effectiveness design implemented in 37 elementary schools. Multilevel anal-yses were conducted on teachers’ratings of children’s behavior problems, concentration problems, social-emotional functioning, prosocial behavior, office discipline referrals, and suspensions at 5 time points over the course of 4 school years.
RESULTS:The multilevel results indicated significant effects of SWPBIS on children’s behavior problems, concentration problems, social-emotional functioning, and prosocial behavior. Children in SWPBIS schools also were 33% less likely to receive an office discipline referral than those in the comparison schools. The effects tended to be strongest among children who werefirst exposed to SWPBIS in kindergarten.
CONCLUSIONS:Thesefindings provide support for the hypothesized re-duction in behavior problems and improvements in prosocial behavior and effective emotion regulation after training in SWPBIS. The SWPBIS framework appears to be a promising approach for reducing problems and promoting adjustment among elementary school children.Pediatrics 2012;130:e1136–e1145
AUTHORS:Catherine P. Bradshaw, PhD, MEd, Tracy E. Waasdorp, PhD, MEd, and Philip J. Leaf, PhD
Johns Hopkins Bloomberg School of Public Health, and Johns Hopkins Center for the Prevention of Youth Violence, Baltimore, Maryland
KEY WORDS
School-wide Positive Behavioral Interventions and Supports (PBIS), aggressive and disruptive behavior, social-emotional adjustment, randomized controlled trial, schools, prevention
ABBREVIATIONS
AOR—adjusted odds ratio ES—effect size
HLM—hierarchal linear modeling ODR—office disciplinary referral RCT—randomized controlled trials
SWPBIS—School-Wide Positive Behavioral Interventions and Sup-ports
TOCA-C—Teacher Observation of Classroom Adaptation, Checklist
Dr Bradshaw obtained funding, made substantial contributions to study design, and made substantial contributions to drafting the manuscript, interpretation of results, and critical review and critique of each version of the manuscript. Dr Waasdorp provided assistance with manuscript preparation including substantial contributions to data analyses, interpretation of results, and critical review and critique of each version of the manuscript. Dr Leaf obtained funding, made substantial contributions to study design, and critically revised the manuscript.
The opinions expressed are those of the authors, not of the funding agencies, and such endorsements should not be inferred. Dr Bradshaw had full access to all data in the study and takes responsibility for the integrity of the data and the accuracy of the data analysis.
This trial has been registered at www.clincialtrials.gov (identifier NCT01583127).
www.pediatrics.org/cgi/doi/10.1542/peds.2012-0243
doi:10.1542/peds.2012-0243
Accepted for publication Jun 28, 2012
Address correspondence to Catherine Bradshaw, PhD, MEd, 624 N Broadway, Baltimore, MD 21205. E-mail: [email protected]
PEDIATRICS (ISSN Numbers: Print, 0031-4005; Online, 1098-4275).
Copyright © 2012 by the American Academy of Pediatrics
FINANCIAL DISCLOSURE:The authors have indicated they have nofinancial relationships relevant to this article to disclose.
Conduct and disruptive behavior pro-blems pose a significant concern for children’s development. An onset of disruptive and aggressive behavior problems in elementary school is as-sociated with an increased risk for academic problems, placement in special education programs, school dropout, substance abuse problems, and antisocial behavior.1,2 There is
growing interest in school-wide pre-vention models, such as School-Wide Positive Behavioral Interventions and Supports (SWPBIS),3,4 as an approach
for preventing an early-onset of behavior
problems and promoting positive adjustment.
SWPBIS is a noncurricular universal prevention strategy that aims to alter the school’s organizational context to implement enhanced procedures and systems to guide data-based decisions related to student behavior problems and academics. It applies behavioral, social learning, and organizational principles to an entire student body consistently across all school con-texts.5Schools establish a set of
posi-tively stated, school-wide expectations for student behavior, which are taught
to all students and staff. It aims to prevent disruptive behavior and en-hance organizational climate by im-plementing a 3-tiered prevention framework6in which 2 levels of
selec-tive and indicated programs are imple-mented to complement the universal school-wide components (for a review, see Sugai and Horner, Taylor-Greene and Kartub, and Horner et al3,4,7,8).
However, most of the.16 000 schools currently implementing SWPBIS have focused on the universal components (see pbis.org).
Two randomized controlled trials (RCTs) were recently conducted of SWPBIS in elementary schools and indicated positive outcomes for students and staff. Specifically, a 1-year waitlist RCT indicated significant improvements in school climate and achievement.9
Pre-vious studies reporting data from the current sample of 37 elementa-ry schools enrolled in a 4-year RCT FIGURE 1
Mean School-wide Evaluation Tool (SET)fidelity scores at SWPBIS and comparison schools at baseline and years 1 through 4. Analysis of the SET data suggested a significant effect (ie, intervention condition3 time interaction) for the overall SET score; Wilks’L= .38,F(4,32) = 13.36,P= .001,h2 = .63,d= 3.22.
FIGURE 2
CONSORT diagram for the SWPBIS RCT.
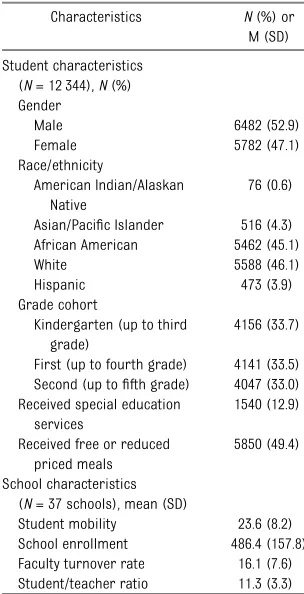
TABLE 1 Student and School Demographic Characteristics
Characteristics N(%) or M (SD)
Student characteristics (N= 12 344),N(%) Gender
Male 6482 (52.9)
Female 5782 (47.1)
Race/ethnicity
American Indian/Alaskan Native
76 (0.6)
Asian/Pacific Islander 516 (4.3) African American 5462 (45.1)
White 5588 (46.1)
Hispanic 473 (3.9)
Grade cohort
Kindergarten (up to third grade)
4156 (33.7)
First (up to fourth grade) 4141 (33.5) Second (up tofifth grade) 4047 (33.0) Received special education
services
1540 (12.9)
Received free or reduced priced meals
5850 (49.4)
School characteristics (N= 37 schools), mean (SD)
indicated significant improvements in the schools’ organizational health, school-level discipline data, and the implementation of classroom-based supports.10–12To date, there has been
no research using longitudinal RCT designs that has examined the effect on teacher ratings of behavior prob-lems and social-emotional adjustment.
We used data from the 4-year RCT to examine the hypothesis that children in schools implementing SWPBIS would have better teacher-rated emotion regulation and prosocial behaviors and fewer concentration problems and disruptive behaviors. We also hypoth-esized that children in SWPBIS schools would be less likely to be referred to the principal’s office or suspended. Given the group RCT design (ie, students nested within schools), we used a mul-tilevel modeling approach13 and
ad-justed for select covariates at the school (eg, enrollment) and child levels (eg, gender).14These findings will
en-hance our understanding of the effects achieved through the commonly used SWPBIS approach by determining its impact on a range of outcomes.
METHOD
Design
Data came from a group randomized controlled effectiveness trial13,15of the
universal SWPBIS model that aimed to determine the impact of SWPBIS on discipline problems and the school environment. Only public elementary schools were eligible for inclusion, and all schools approached about partici-pation agreed to enroll. An open-cohort design was used, such that new stu-dents could enroll at each data collec-tion; however, resources were not available to follow students who left the participating schools. Schools were matched on select baseline demographics (eg, school enrollment), of which 21 schools were randomized to the intervention condition and 16 to the
comparison condition. The comparison schools refrained from implementing SWPBIS for 4 years.
Training
The 21 schools assigned to receive SWPBIS training each formed SWPBIS teams, comprising 5 to 6 members (eg, teachers, administrators), who atten-ded an initial 2-day summer training co-led by one of the developers of SWPBIS. To maintain consistently high levels of
fidelity, the SWPBIS teams attended annual 2-day booster training events. Consistent with the effectiveness trial design,15all initial training and booster
training events were coordinated and led by the PBIS Maryland State Lead-ership Team and were also attended by other SWPBIS teams from across the state.16All SWPBIS schools received at
least monthly on-site support and technical assistance from a trained behavior support coach (eg, school
FIGURE 3
Impact of SWPBIS on disruptive behaviors.
FIGURE 4
psychologist) for the duration of the trial; these staff were trained by the state and supervised by the district. Professional development and techni-cal assistance were provided to the behavior support coaches through state-coordinated training events con-ducted 4 times each year (see Barrett et al17for additional information).
Fidelity
Annual assessments of SWPBIS im-plementation were conducted in all 37 schools by trained assessors who were unaware of the schools’ imple-mentation status using the validated School-wide Evaluation Tool (SET)18
and staff self-reports11,12; both
in-dicated that all SWPBIS schools reached and maintained high-fidelity implementation (eg, 80% on the School-wide Evaluation Tool)18by the
end of the trial, and no schools in the comparison condition consis-tently reached highfidelity; 66% of the SWPBIS schools met the 80% high-fidelity threshold18 within the first
year of the trial (see means in Fig 1 and Bradshaw et al11,12,19 for
addi-tional information on the methods and fidelity in the intervention and control conditions).
Sample
The sample included 37 elementary schools, the size of which was de-termined through a power analysis. Five data points (fall and spring year 1, spring years 2-4) were collected over the 4 school years (2002–2007) on 12 334 children who were in kindergarten, first, and second grade when the study started. See the CONSORT diagram in Fig 2 and school demographics in Table 1.
Measures
The Teacher Observation of Classroom Adaptation—Checklist (TOCA-C)20 was
completed for each child by their
pri-mary classroom teacher. The TOCA-C is a checklist version of the TOCA (TOCA-R),21
which has been used in several previous RCTs of school-based prevention pro-grams.22–24 The TOCA-C measures each
child’s level of“aggressive and disruptive behaviors” (fights; 9 items, a = .92),
“concentration problems” (pays atten-tion; 7 items,a= .96),“prosocial behav-iors”(shows empathy; 5 items,a= .92), and “emotion regulation” (stops and calms down when angry or upset;
4-items,a= .89). Teachers responded to each question using a 6-point Likert scale (1 = never to 6 = almost always), which were averaged to create the 4 subscales, such that higher scores on disruptive behaviors and concentration problems indicated greater problems, whereas higher scores on the prosocial behaviors and emotion regulation scales refl ect-ed better adjustment. These scales ex-hibit strong internal consistency, have a consistent factor structure over time,20
FIGURE 5
Impact of SWPBIS on emotion regulation.
FIGURE 6
relate to external criteria,25 and are
sensitive to relatively modest in-tervention effects.26 The TOCA-C also
in-cluded questions regarding each child’s receipt of an office disciplinary referral (ODR) and an out-of-school suspension during that school year using a yes/no dichotomous format. Teacher reports of these events have been shown to be a valid indicator of the child’s discipline problems.27These items were collapsed
over the 5 time points to create an ag-gregated dichotomous indicator for ODRs and suspensions (1 = ever, 0 = never received) over the course of the trial.
Procedure
Survey packets were mailed to the school and distributed to the teachers by an administrator or secretary. The packets contained a checklist in refer-ence to each child in their classroom, and each survey had a unique identifier for each child, thereby allowing child-specific data to be tracked over the 4 years. Teachers completed a survey for each child in the class 5 times over the course of 4 years (ie, fall baseline, spring of 4 years). The project was approved by the researchers’ in-stitutional review board; passive pa-rental consent was used for child participants.
Analyses
Longitudinal 3-level hierarchical linear models were estimated by using hier-archal linear modeling (HLM6)28 to
examine the effect of SWPBIS on child-ren’s changes in behaviors (disruptive behaviors, prosocial behaviors, con-centration problems, emotion regula-tion) over the course of the intervention (Figs 3, 4, 5, and 6). At level 1, the within-individual time scores were entered into the model. At level 2, child characteristics (ie, special edu-cation status, race [black vs nonblack children], cohort, free or reduced
meals status, gender) were included. Given the group RCT design, in-tervention status (SWPBIS vs control) was modeled as a school-level char-acteristic (level 3). Additionally, multi-level logistic regression analyses were conducted in HLM to examine the effect of SWPBIS (modeled as a school-level variable) on receiving an ODR and a suspension.
On the basis of previous research with this data,11,12the following school-level
variables were included as covariates: student mobility, enrollment, student/
teacher ratio, and faculty turnover rate. We grand-mean centered all pre-dictor variables at levels 2 and 3, ex-cept intervention status.29 Model fit
indices (Akaike information criterion [AIC] and Bayesian information crite-rion [BIC]) are reported in the tables and are interpreted such that smaller values indicate betterfit.28
Although the participation rate was consistently high, we examined the missing data patterns but did not find evidence that missingness was problematic.30,31For example, baseline
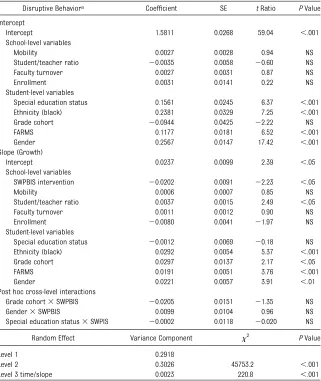
TABLE 2 HLM Results for 3-Level Model Examining the Effect of SWPBIS on Disruptive Behaviors
Disruptive Behaviora Coefficient SE tRatio PValue
Intercept
Intercept 1.5811 0.0268 59.04 ,.001
School-level variables
Mobility 0.0027 0.0028 0.94 NS
Student/teacher ratio 20.0035 0.0058 20.60 NS
Faculty turnover 0.0027 0.0031 0.87 NS
Enrollment 0.0031 0.0141 0.22 NS
Student-level variables
Special education status 0.1561 0.0245 6.37 ,.001
Ethnicity (black) 0.2381 0.0329 7.25 ,.001
Grade cohort 20.0944 0.0425 22.22 NS
FARMS 0.1177 0.0181 6.52 ,.001
Gender 0.2567 0.0147 17.42 ,.001
Slope (Growth)
Intercept 0.0237 0.0099 2.39 ,.05
School-level variables
SWPBIS intervention 20.0202 0.0091 22.23 ,.05
Mobility 0.0006 0.0007 0.85 NS
Student/teacher ratio 0.0037 0.0015 2.49 ,.05
Faculty turnover 0.0011 0.0012 0.90 NS
Enrollment 20.0080 0.0041 21.97 NS
Student-level variables
Special education status 20.0012 0.0069 20.18 NS
Ethnicity (black) 0.0292 0.0054 5.37 ,.001
Grade cohort 0.0297 0.0137 2.17 ,.05
FARMS 0.0191 0.0051 3.76 ,.001
Gender 0.0221 0.0057 3.91 ,.01
Post hoc cross-level interactions
Grade cohort3SWPBIS 20.0205 0.0151 21.35 NS
Gender3SWPBIS 0.0099 0.0104 0.96 NS
Special education status3SWPIS 20.0002 0.0118 20.020 NS
Random Effect Variance Component x2 PValue
Level 1 0.2918
Level 2 0.3026 45753.2 ,.001
Level 3 time/slope 0.0023 220.8 ,.001
Akaike information criterion = 97001.1; Bayesian information criterion = 96916.7.N= 12 344; SWPBIS was coded 1 (in-tervention) or 0 (comparison). FARMS indicates free or reduced-price meals status (1 = received FARMS, 0 = did not receive). Gender was coded 1 (male), 0 (female). Ethnicity was coded 1(black), 0 (all others). Grade cohort indicates the grade the youth was in when the trial began, coded 1 (kindergarten), 0 (grades 1 or 2). Special education indicates child receives special education services (coded 1 for yes, 0 for no).
aResults presented are from the model that did not include the post hoc interactions. The intraclass correlation for
scores on concentration problems were unrelated to subsequent missingness on this measure (adjusted odds ratio [AOR] = 1.00, 95% confidence interval = 0.96–1.04). Baseline scores on disrup-tive behavior were significantly associ-ated with an increased odds of subsequent missingness (AOR = 1.05, 95% confidence interval = 1.03–1.07), yet this difference was small and likely has limited clinical significance. Neither gender nor intervention status had a significant effect on subsequent missingness on teacher ratings of be-havior problems. Therefore, our analy-ses assumed data were missing at random, which assumes that the reason for missingness is not related to the missing value itself or is deemed ran-dom after controlling for the variables that are observed.32,33HLM adjusts
pa-rameter estimates for attrition using full-information maximum-likelihood es-timation, a widely recognized and ap-propriate means of handling missing data34 under the assumption that data
are missing at random.35 Specifically,
individuals can have missing data across any of the time points and still be included in the analyses; therefore, HLM is robust to missing data within repeated measures.35,36
RESULTS
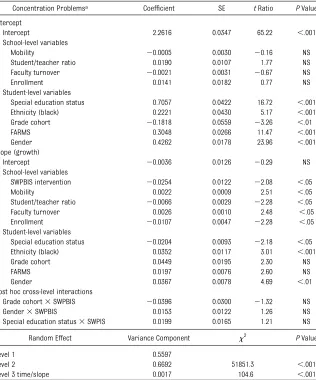
The sample of 12 344 children was 52.9% male, 45.1% African American, and 46.1% Caucasian (see Table 1). Approx-imately 49% received free or reduced-price meals, and 12.9% received special education services. The multilevel anal-yses indicated a significant positive intervention effect on disruptive behav-iors (g=–0.02,t =–2.23,P,.05, effect size (ES) = 0.12), such that children in SWPBIS schools had lower levels of ag-gressive and disruptive behaviors compared with those in the control schools (see Table 2). A similar ef-fect was observed on concentration problems (g= –0.03, t =–2.08, P,
.05, ES = 0.08; see Table 3). We ex-plored for possible cross-level in-teraction effects between SWPBIS and grade cohort, gender, and special education status; however, none were significant.
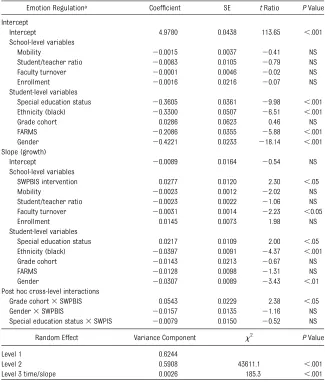
The multilevel analyses also indicated a significant intervention effect on prosocial behavior (g= 0.03,t =2.11, P,.05, ES =–0.17), such that children in the intervention had higher levels of positive behaviors compared with those in the control. A similar effect was observed on emotion regulation
(g= 0.03,t =2.30,P,.05, ES =–0.11), such that children in the intervention schools had better emotion regulation than those in the control. Again we examined for possible interaction effects of intervention status and grade cohort, gender, and special education. The results indicated that children who were in kindergarten when the trial began fared better in SWPBIS schools than in comparison schools on both prosocial behavior (g= 0.08,t =2.77, P , .01) and emotion regulation (g= 0.05,t =2.38, P,.05). No other
TABLE 3 HLM Results for 3-Level Model Examining the Effect of SWPBIS on Concentration Problems
Concentration Problemsa Coefficient SE tRatio PValue
Intercept
Intercept 2.2616 0.0347 65.22 ,.001
School-level variables
Mobility 20.0005 0.0030 20.16 NS
Student/teacher ratio 0.0190 0.0107 1.77 NS
Faculty turnover 20.0021 0.0031 20.67 NS
Enrollment 0.0141 0.0182 0.77 NS
Student-level variables
Special education status 0.7057 0.0422 16.72 ,.001
Ethnicity (black) 0.2221 0.0430 5.17 ,.001
Grade cohort 20.1818 0.0559 23.26 ,.01
FARMS 0.3048 0.0266 11.47 ,.001
Gender 0.4262 0.0178 23.96 ,.001
Slope (growth)
Intercept 20.0036 0.0126 20.29 NS
School-level variables
SWPBIS intervention 20.0254 0.0122 22.08 ,.05
Mobility 0.0022 0.0009 2.51 ,.05
Student/teacher ratio 20.0066 0.0029 22.28 ,.05
Faculty turnover 0.0026 0.0010 2.48 ,.05
Enrollment 20.0107 0.0047 22.28 ,.05
Student-level variables
Special education status 20.0204 0.0093 22.18 ,.05
Ethnicity (black) 0.0352 0.0117 3.01 ,.001
Grade cohort 0.0449 0.0195 2.30 NS
FARMS 0.0197 0.0076 2.60 NS
Gender 0.0367 0.0078 4.69 ,.01
Post hoc cross-level interactions
Grade cohort3SWPBIS 20.0396 0.0300 21.32 NS
Gender3SWPBIS 0.0153 0.0122 1.26 NS
Special education status3SWPIS 0.0199 0.0165 1.21 NS
Random Effect Variance Component x2 PValue
Level 1 0.5597
Level 2 0.6692 51851.3 ,.001
Level 3 time/slope 0.0017 104.6 ,.001
Akaike information criterion = 100306.4; Bayesian information criterion = 100208.0. SWPBIS was coded 1 (intervention), 0 (comparison). FARMS indicates free or reduced-price meals status. Gender was coded 1 (male), 0 (female). Ethnicity was coded 1 (black), 0 (all others). Grade cohort indicates the grade the youth was in when the trial began, coded 1 (kinder-garten), 0 (grades 1 or 2).
aResults presented are from the model that did not include the post hoc interactions. The interclass correlation for
interactions were significant (see bot-tom of Tables 4 and 5 for interaction terms only). We explored the fit of quadratic and cubic growth in the HLM analyses for these continuous out-comes; however, neither resulted in a significant improvement in modelfit.
Thefinal set of multilevel analyses in-dicated that children in SWPBIS schools were 33% less likely to receive an ODR than those in the comparison schools (AOR = 0.67, [0.57–0.79],P,.001). We also found a significant interaction between gender and intervention
sta-tus (AOR = 1.27 [1.04–1.56],P,.05) in which girls in SWPBIS schools were less likely to receive an ODR than girls in comparison schools, but there was no difference for boys. With regard to suspensions, there were no significant differences between SWPBIS and com-parison schools and no significant interactions (see Table 6).
DISCUSSION
This study used data from a 4-year randomized controlled effectiveness trial to examine the hypothesis that
children in schools implementing SWPBIS would experience better adjustment and fewer problem behaviors relative to their peers in comparison schools. As hypothesized, the multilevel, longitudi-nal alongitudi-nalyses indicated that relative to the children in comparison schools, those in SWPBIS schools displayed lower levels of disruptive behavior problems and concentration problems, and better emotion regulation and more prosocial behavior. We also ob-served significant intervention effects on children’s odds of receiving an ODR. However, no significant effects were observed on suspensions. We explored for potential interactions with select demographic variables and generally found that the effects were strongest among those children who began the trial when they were in kindergarten. Interestingly, no other demographic characteristics explored were signifi -cant effect modifiers.
It was not surprising that one of the strongest effects was on ODRs, given a core component of the SWPBIS model is the establishment of a system to track, monitor, and use ODR data.4The
heightened attention to this particular source of data within SWPBIS likely contributed to the reduction in the odds of ODRs observed among children in the trained schools. Although not specifically examined within this study, it is theorized that the reduction in ODR use is mediated by reductions in children’s behavior problems. Future studies should explore the extent to which the reductions in teacher-rated behavior problems lead to the reduc-tions in ODRs. Although the current study focused on the overall impact on receipt of ODRs, it is possible that the pattern of findings may vary by the reason for the ODR (eg, bullying, dis-respect); however, data regarding these outcomes are not available for schools in both conditions. It is also possible that the more proximal
TABLE 4 HLM Results for 3-Level Model Examining the Effect of SWPBIS on Prosocial Behaviors
Positive Behaviorsa Coefficient SE tRatio PValue
Intercept
Intercept 5.1609 0.0376 137.32 ,.001
School-level variables
Mobility 20.0036 0.0033 21.10 NS
Student/teacher ratio 0.0021 0.0105 0.20 NS
Faculty turnover 20.0010 0.0037 20.27 NS
Enrollment 20.0303 0.0174 21.74 NS
Student-level variables
Special education status 20.3323 0.0343 29.70 ,.001 Ethnicity (black) 20.2090 0.0335 26.25 ,.001
Grade cohort 0.0807 0.0541 1.49 NS
FARMS 20.2069 0.0252 28.21 ,.001
Gender 20.2609 0.0179 214.57 ,.001
Slope (growth)
Intercept 20.0651 0.0166 23.93 ,.01
School-level variables
SWPBIS intervention 0.0335 0.0159 2.11 ,.05
Mobility 20.0006 0.0011 20.59 NS
Student/teacher ratio 20.0048 0.0030 21.59 NS
Faculty turnover 20.0029 0.0013 22.19 ,.05
Enrollment 0.0143 0.0055 2.59 ,.05
Student-level variables
Special education status 20.0079 0.0108 20.73 NS
Ethnicity (black) 20.0133 0.0082 21.63 NS
Grade cohort 20.0056 0.0210 20.27 NS
FARMS 20.0064 0.0081 20.79 NS
Gender 20.0200 0.0077 22.61 ,.05
Post hoc cross-level interactions
Grade cohort3SWPBIS 0.0846 0.0306 2.77 ,.01
Gender3SWPBIS 20.0109 0.0132 20.83 NS
Special education status3SWPIS 20.0004 0.0161 20.02 NS
Random Effect Variance Component x2 PValue
Level 1 0.5328
Level 2 0.3877 36099.8 ,.001
Level 3 time/slope 0.0029 401.3 ,.001
Akaike information criterion = 94385.8; Bayesian information criterion = 94323.4. SWPBIS was coded 1 (intervention), 0 (comparison). FARMS indicates free or reduced-price meals status. Gender was coded 1 (male), 0 (female). Ethnicity was coded 1(black), 0 (all others). Grade cohort indicates the grade the youth was in when the trial began, coded 1 (kindergarten), 0 (grades 1 or 2).
aResults presented are from the model that did not include the post hoc interactions. The interclass correlation for prosocial
impacts observed in the trial translate into longer-term effects on the need for school-based services, such as special education, and academic outcomes.
Previous studies have reported a school-level impact of SWPBIS on suspension rates9,12; therefore, we hypothesized
that there would be a significant effect on students’ receipt of a suspension; however, such an effect did not reach significance. It is possible that the in-tervention effects would increase with longer implementation of the model. More targeted strategies, such as those used in the full 3-tiered SWPBIS model,
may be necessary to reduce suspen-sions. Furthermore, we only explored main effects of the universal SWPBIS model and select interactions related to demographics, which indicated that the effects tended to be strongest for chil-dren who were in kindergarten when they werefirst exposed to SWPBIS. This suggests that the earlier the exposure to SWPBIS, the greater the potential impact of the model. From a de-velopmental perspective, it is possible that younger children’s behaviors are more malleable and responsive to adults’ expectations and positive reinforcement
for good behavior. Additional work is needed to better understand the im-pact of SWPBIS when implemented in middle and high schools. Future stud-ies also should examine whether the intervention effects are greatest for children with a particular baseline risk profile.37 Although not a focus of the
current study, race and special edu-cation status were significantly asso-ciated with each outcome across all models. Given the literature on dis-proportionality in discipline,38 future
research will examine the effects on disproportionality in special education service use and discipline problems.
The data were obtained through teacher reports over the course of the trial be-cause archival data (eg, ODRs) or pre-training teacher-report data are not available for analysis. Although we rec-ognize that a teacher report of need is not equivalent to an assessment made by a clinician or a diagnostic assessment, teachers are the most common source of children’s mental health and speci-al education referrspeci-als,39 thus their
assessments are important in the con-text of school-based interventions and have been shown to predict mental health problems.2,20 Furthermore, the
SWPBIS and control schools did not have common measurement systems for ODRs that would allow a functional comparison of these data elements; however, teacher reports of ODRs have been validated.27Future research
should examine other effects of SWPBIS, such as the impact on achievement and attendance.
The effect sizes were relatively modest; however, small effect sizes are common in longitudinal universal prevention studies15,40; we anticipate that the
effects will be stronger for higher-risk students.24Also bear in mind that the
RCT was an effectiveness trial in which all the training, implementation, and support activities were led by the state and local school districts, not by the
TABLE 5 HLM Results for 3-Level Model Examining the Effect of SWPBIS on Emotion Regulation
Emotion Regulationa Coefficient SE tRatio PValue
Intercept
Intercept 4.9780 0.0438 113.65 ,.001
School-level variables
Mobility 20.0015 0.0037 20.41 NS
Student/teacher ratio 20.0083 0.0105 20.79 NS
Faculty turnover 20.0001 0.0046 20.02 NS
Enrollment 20.0016 0.0216 20.07 NS
Student-level variables
Special education status 20.3605 0.0361 29.98 ,.001 Ethnicity (black) 20.3300 0.0507 26.51 ,.001
Grade cohort 0.0286 0.0623 0.46 NS
FARMS 20.2086 0.0355 25.88 ,.001
Gender 20.4221 0.0233 218.14 ,.001
Slope (growth)
Intercept 20.0089 0.0164 20.54 NS
School-level variables
SWPBIS intervention 0.0277 0.0120 2.30 ,.05
Mobility 20.0023 0.0012 22.02 NS
Student/teacher ratio 20.0023 0.0022 21.06 NS Faculty turnover 20.0031 0.0014 22.23 ,0.05
Enrollment 0.0145 0.0073 1.98 NS
Student-level variables
Special education status 0.0217 0.0109 2.00 ,.05 Ethnicity (black) 20.0397 0.0091 24.37 ,.001
Grade cohort 20.0143 0.0213 20.67 NS
FARMS 20.0128 0.0098 21.31 NS
Gender 20.0307 0.0089 23.43 ,.01
Post hoc cross-level interactions
Grade cohort3SWPBIS 0.0543 0.0229 2.38 ,.05
Gender3SWPBIS 20.0157 0.0135 21.16 NS
Special education status3SWPIS 20.0079 0.0150 20.52 NS
Random Effect Variance Component x2 PValue
Level 1 0.6244
Level 2 0.5908 43611.1 ,.001
Level 3 time/slope 0.0026 185.3 ,.001
Akaike information criterion = 102279.3; Bayesian information criterion = 102206.9. SWPBIS was coded 1 (intervention), 0 (comparison). FARMS indicates free or reduced meals status. Gender was coded 1 (male), 0 (female). Black was coded 1 (Black), 0 (all others). Grade cohort indicates the grade the youth was in when the trial began, coded 1 (Kindergarten), 0 (grades 1 or 2).
aResults presented are from the model that did not include the post hoc interactions. The interclass correlation for emotion
researchers. These training events also included schools not participating in the RCT, and thus we anticipate that thefindings would generalize to other schools in the state who participated in these events (see Stuart et al41for
in-formation on generalizability).
CONCLUSIONS
This is the first RCT to demonstrate impacts of SWPBIS on trajectories of children’s behavior problems and
ad-justment over multiple school years. These findings suggest that there are proximal effects of SWPBIS on a range of behavior problems, such as ODRs, concentration difficulties, and aggres-sive or disruptive behavior, as well as improvements in prosocial behaviors and emotion regulation. The effects of SWPBIS on prosocial behavior and emotional regulation are relatively unique in the literature. The finding that these effect sizes were as strong as or stronger than disruptive
behav-ior is also noteworthy. Demonstrating the impact of SWPBIS on a range of early-onset behavior and social-emotional problems has important public health significance, especially in light of the wide dissemination of SWPBIS.29
Thesefindings provide support for the hypothesized reduction in behavior problems and improvements in adap-tive skills through SWPBIS. Although these effects are promising, there are some children who are not responding adequately to the universal model,4and
thus additional work is needed to identify these children so that their needs can be better met within the school. The tiered prevention model also provides an infrastructure for the delivery of more intensive services and programs for children with greater needs.4,42 Furthermore, SWPBIS holds
promise for improving the organiza-tional context to support higher-quality implementation of selective and in-dicated preventive interventions for nonresponders.11
ACKNOWLEDGMENTS
We thank the PBIS Maryland State Lead-ership Team for their support of this project and Dr. Mary Mitchell for assis-tance with an earlier draft of this man-uscript.
REFERENCES
1. Moffitt TE. Life-course-persistent versus adolescence-limited antisocial behavior. In: Cicchetti D, Cohen DJ, eds.Developmental Psychopathology.Hoboken, NJ: John Wiley & Sons; 2006:570–598
2. Schaeffer CM, Petras H, Ialongo N, Poduska J, Kellam S. Modeling growth in boys’ ag-gressive behavior across elementary school: links to later criminal involvement, conduct disorder, and antisocial personality disor-der.Dev Psychol. 2003;39(6):1020–1035 3. Sugai G, Horner RR. Introduction to the special
series on positive behavior support in schools.
J Emot Behav Disord. 2002;10(3):130–135 4. Sugai G, Horner RR. A promising approach
for expanding and sustaining School-Wide
Positive Behavior Support. School Psych Rev. 2006;35(2):245–259
5. Lewis T, Sugai G. Effective behavior sup-port: a systems approach to proactive schoolwide management. Focus Excep-tional Child. 1999;31(6):1–24
6. Mrazek PJ, Haggerty RJ.Reducing risks for mental disorders: Frontiers for preventive intervention research. Washington, DC: National Academy Press; 1994
7. Taylor-Greene SJ, Brown D, Nelson L, et al. School-Wide Behavioral Support: starting the year off right.J Behav Educ. 1997;7(1): 99–112
8. Taylor-Greene SJ, Kartub DT. Durable implementation of School-Wide Behavior
Support: The High Five Program. J Posit Behav Interv. 2000;2(4):233–235
9. Horner RH, Sugai G, Smolkowski K, et al. A randomized, wait-list controlled effective-ness trial assessing School-Wide Positive Behavior Support in elementary schools.
J Posit Behav Interv. 2009;11(3):133–144 10. Bradshaw CP, Koth CW, Bevans KB, Ialongo
N, Leaf PJ. The impact of School-Wide Pos-itive Behavioral Interventions and Supports (PBIS) on the organizational health of ele-mentary schools.Sch Psychol Q. 2008;23(4): 462–473
11. Bradshaw CP, Koth CW, Thornton LA, Leaf PJ. Altering school climate through school-wide Positive Behavioral Interventions and
TABLE 6 HLM Results Examining the Effect of SWPBIS on Office Discipline Referrals and Suspensions
Predictor Variables Received Office Discipline Referral Received Out-of-School Suspension
AOR CI AOR CI
Student-level variables
Grade cohort 0.67*** (0.57–0.79) 0.73** (0.59–0.91) Gender 3.58*** (3.21–4.00) 4.69*** (4.04–5.44) Ethnicity (black) 2.09*** (1.80–2.42) 2.56*** (2.18–3.01) Special ed 1.59*** (1.39–1.81) 2.09*** (1.82–2.41) FARMS 1.68*** (1.52–1.86) 1.61*** (1.38–1.88) School-level variables
SWPBIS intervention 0.66** (0.49–0.89) 0.97 (0.69–1.36) Student mobility 1.00 (0.98–1.02) 1.02 (0.99–1.04) Student/teacher ratio 0.99 (0.97–1.03) 1.02 (0.99–1.05) Enrollment 0.87*** (0.82–0.93) 1.04 (0.92–1.17) Faculty turnover 1.02 (0.99–1.04) 1.02 (0.99–1.05) Post hoc cross-level interactions
Grade cohort3SWPBIS .78 (0.57–1.08) 0.72 (0.47–1.10) Gender3SWPBIS 1.27* (1.04–1.56) 1.29 (0.97–1.73) Special ed status3SWPBIS 0.96 (0.75–1.24) 1.34 (0.99–1.79)
Supports: findings from a group-randomized effectiveness trial. Prev Sci. 2009;10(2):100–115
12. Bradshaw CP, Mitchell MM, Leaf PJ. Exam-ining the effects of Schoolwide Positive Behavioral Interventions and Supports on student outcomes. J Posit Behav Interv. 2010;12(3):133–148
13. Murray DM.Design and Analysis of Group-randomized Trials. New York, NY: Oxford Press; 1998
14. Birnbaum AS, Lytle LA, Hannan PJ, Murray DM, Perry CL, Forster JL. School functioning and violent behavior among young adoles-cents: a contextual analysis. Health Educ Res. 2003;18(3):389–403
15. Flay BR, Biglan A, Boruch RF, et al. Stand-ards of evidence: criteria for efficacy, ef-fectiveness and dissemination. Prev Sci. 2005;6(3):151–175
16. Bradshaw CP, Pas ET. A state-wide scale-up of Positive Behavioral Interventions and Supports (PBIS): a description of the de-velopment of systems of support and analysis of adoption and implementation.
School Psych Rev. 2011;40(4):530–548 17. Barrett SB, Bradshaw CP, Lewis-Palmer T.
Maryland statewide PBIS initiative.J Posit Behav Interv. 2008;10(2):105–114
18. Horner RH, Todd A, Lewis-Palmer T, Irvin L, Sugai G, Boland J. The school-wide evalua-tion tool (SET): a research instrument for-assessing School-Wide Positive Behavior Support. J Posit Behav Interv. 2004;6(1): 3–12
19. Bradshaw CP, Reinke WM, Brown LD, Bevans KB, Leaf PJ. Implementation of school-wide positive behavioral interventions and sup-ports (PBIS) in elementary schools: obser-vations from a randomized trial.Educ Treat Child. 2008;31(1):1–26
20. Koth CW, Bradshaw CP, Leaf PJ. Teacher ob-servation of classroom adaptation-checklist: development and factor structure. Meas Eval Couns Dev. 2009;42(1):15–30
21. Werthamer-Larsson L, Kellam S, Wheeler L. Effect offirst-grade classroom environment on shy behavior, aggressive behavior, and concentration problems.Am J Community Psychol. 1991;19(4):585–602
22. The Conduct Problems Prevention Re-search Group. Evaluation of the first 3
years of the Fast Track prevention trial with children at high risk for adolescent con-duct problems. J Abnorm Child Psychol. 2002;30(1):19–35
23. Ialongo NS, Werthamer L, Kellam SG, Brown CH, Wang S, Lin Y. Proximal impact of two
first-grade preventive interventions on the early risk behaviors for later substance abuse, depression, and antisocial behavior.
Am J Community Psychol. 1999;27(5):599–641 24. Kellam SG, Ling X, Merisca R, Brown CH, Ialongo N. The effect of the level of aggres-sion in the first grade classroom on the course and malleability of aggressive be-havior into middle school.Dev Psychopathol. 1998;10(2):165–185
25. Stormshak EA, Bierman KL, Bruschi C, Dodge KA, Coie JD; Conduct Problems Pre-vention Research Group. The relation be-tween behavior problems and peer preference in different classroom contexts.
Child Dev. 1999;70(1):169–182
26. Ialongo NS, Poduska J, Werthamer L, Kellam S. The distal impact of two first-grade preventive interventions on conduct prob-lems and disorder in early adolescence.J Emot Behav Disord. 2001;9(3):146–160 27. Pas ET, Bradshaw CP, Mitchell MM.
Exam-ining the validity of office discipline referrals as an indicator of student be-havior problems.Psychol Sch. 2011;48(6): 541–555
28. Raudenbush SW, Bryk AS, Cheong YF, Congdon RT Jr, du Toit M.Hierarchical Linear and Nonlinear Modeling (HLM7). Lincolnwood, IL: Scientific Software International, Inc.; 2011
29. Enders CK, Tofighi D. Centering predictor variables in cross-sectional multilevel models: a new look at an old issue.Psychol Methods. 2007;12(2):121–138
30. Schlomer GL, Bauman S, Card NA. Best practices for missing data management in counseling psychology. J Couns Psychol. 2010;57(1):1–10
31. Wothke W. Longitudinal and multigroup modeling with missing data. In: Little TD, Schnabel KU, Baumert J, eds. Modeling Longitudinal and Multilevel Data: Practical Issues, Applied Approaches, and Specific Examples. Mahwah, NJ: Lawrence Erlbaum Associates; 2000:219–240
32. Arbuckle JL. Full information estimation in the presence of incomplete data. In: Mar-coulides GA, Schumacker RE, eds. Advanced Structural Equation Modeling: Issues and techniques. Mahwah, NJ: Lawrence Erlbaum Associates; 1996
33. Little RJ. Modeling the dropout mechanism in repeated-measures studies. J Am Stat Assoc. 1995;90(431):1112–1121
34. Schafer JL, Graham JW. Missing data: our view of the state of the art.Psychol Meth-ods. 2002;7(2):147–177
35. Raudenbush SW, Bryk AS.Hierarchical Lin-ear Models: Applications and Data Analysis Methods. 2nd ed. Thousand Oaks, CA: Sage; 2002
36. Rumberger RW, Palardy GJ. Multilevel models for school effectiveness research. In: Kaplan D, ed.Handbook of Quantitative Methodology for the Social Sciences. Thou-sand Oaks, CA: Sage; 2004
37. van Lier PAC, Verhulst FC, Crijnen AAM. Screening for disruptive behavior syn-dromes in children: the application of la-tent class analyses and implications for prevention programs. J Consult Clin Psy-chol. 2003;71(2):353–363
38. Bradshaw CP, Mitchell MM, O’Brennan LM, Leaf PJ. Multilevel exploration of factors contributing to the overrepresentation of black students in office disciplinary refer-rals.J Educ Psychol. 2010;102(2):508–520 39. Zima BT, Hurlburt MS, Knapp P, et al. Quality
of publicly-funded outpatient specialty mental health care for common childhood psychiatric disorders in California. J Am Acad Child Adolesc Psychiatry. 2005;44(2): 130–144
40. Durlak JA, Weissberg RP, Dymnicki AB, Taylor RD, Schellinger KB. The impact of enhancing students’social and emotional learning: a meta-analysis of school-based universal interventions. Child Dev. 2011;82 (1):405–432
41. Stuart EA, Cole SR, Bradshaw CP, Leaf PJ. The use of propensity scores to assess the generalizability of results from randomized trials.J R Stat Soc A. 2011;174(2):369–386 42. Hawken LS, Vincent CG, Schumann J.
DOI: 10.1542/peds.2012-0243 originally published online October 15, 2012;
2012;130;e1136
Pediatrics
Catherine P. Bradshaw, Tracy E. Waasdorp and Philip J. Leaf
Behavior Problems
Effects of School-Wide Positive Behavioral Interventions and Supports on Child
Services
Updated Information &
http://pediatrics.aappublications.org/content/130/5/e1136 including high resolution figures, can be found at:
References
http://pediatrics.aappublications.org/content/130/5/e1136#BIBL This article cites 34 articles, 0 of which you can access for free at:
Subspecialty Collections
al_issues_sub
http://www.aappublications.org/cgi/collection/development:behavior Developmental/Behavioral Pediatrics
following collection(s):
This article, along with others on similar topics, appears in the
Permissions & Licensing
http://www.aappublications.org/site/misc/Permissions.xhtml in its entirety can be found online at:
Information about reproducing this article in parts (figures, tables) or
Reprints
DOI: 10.1542/peds.2012-0243 originally published online October 15, 2012;
2012;130;e1136
Pediatrics
Catherine P. Bradshaw, Tracy E. Waasdorp and Philip J. Leaf
http://pediatrics.aappublications.org/content/130/5/e1136
located on the World Wide Web at:
The online version of this article, along with updated information and services, is
by the American Academy of Pediatrics. All rights reserved. Print ISSN: 1073-0397.