The Relationship between Skin Conductance and
Self-Reported Stress
Does the relationship exist and, if so, does it differ across different types
of stressors?
Daniel Lutscher Psychology
June 2016
Faculty of Behavioral Sciences
Department Cognitive Psychology & Ergonomics (CPE)
University of Twente, 7500AE Enschede, The Netherlands
Supervisor:
Abstract
In current stress research it is well acknowledged that acute psychological stress
activates the endocrine-, physiological-, and psychological system (e.g. Campbell &
Ehlert, 2012). However, although this homeostatic process between these systems is
often assumed, literature regarding this relationship is inconsistent. We proposed that
these inconsistencies may be due to a lack of differentiation between different types of
stressors. Therefore, the present study examined whether a relationship between the
physiological-, and psychological system exists and, if so, whether this relationship
differs, depending on whether a social-, environmental-, or cognitive stressor is used.
55 students took part in a single session experiment where they were confronted with
the Sing-a-Song-Stress Test (SSST; social stressor), a Noise Test (environmental
stressor) and the Beauty Contest Game (BCG; cognitive stressor) while their skin
conductance response (SCR) and self-reported stress were measured. Results indicated
no overall correlation between relative increase in mean amplitude SCR and difference
scores of self-reported stress. The environmental stressor showed a significant
correlation between these systems but this correlation did not significantly differ from
the correlations of the SSST and the BCG. Therefore, it cannot be answered if the
relationship between the physiological-, and psychological system exists. However, the
study provides first evidence that this relationship does not seem to vary across different
types of stressors. This insight can give a direction for future research and, hereby, help
to further understand the complex mechanisms in the assumed homeostatic process
between systems in stress.
Samenvatting
Tegenwoordig is in stressonderzoek erkend dat acute psychologische stress leidt tot
activatie van het endocrien-, fysiologische- en psychologische systeem (bijv. Campbell
& Ehlert, 2012). Hoewel deze homeostatische proces tussen deze systemen vaak wordt
aangenomen zijn de bevindingen vanuit de literatuur hierover tegenstrijdig. We stelden
dat deze tegenstrijdige bevindingen kunnen worden veroorzaakt door een gebrek aan
differentiatie tussen verschillende soorten stressoren. Daarom heeft deze studie
onderzocht of een relatie bestaat tussen het fysiologische-, en psychologische systeem
en, zoals ja, of deze relatie verschilt, afhankelijk daarvan of er een sociale-, milieu-, of
cognitieve stressor wordt gebruikt. 55 studenten namen deel aan een experiment waar
ze werden geconfronteerd met de Sing-a-Song-Stress Test (SSST; sociale stressor), een
Noise Test (milieu stressor) en de Beauty Contest Game (BCG; cognitieve stressor),
terwijl hun huidgeleiding reactie (SCR) en zelf-gerapporteerde stress werden gemeten.
De resultaten toonden over het algemeen geen correlatie tussen de relatieve stijging van
de gemiddelde amplitude SCR en de verschil scores van zelf-gerapporteerde stress. De
milieustressor toonde een significante correlatie tussen de systemen maar deze
correlatie verschilde niet significant van de correlaties van de SSST en de BCG. Het
kan niet worden beantwoord of een relatie bestaat tussen het fysiologische- en
psychologische systeem. De studie geeft wel een eerste indicatie dat deze relatie niet
lijkt te variëren tussen verschillende soorten stressoren. Deze inzicht kan een richting
geven voor toekomstig onderzoek en helpt hierdoor om een beter beeld te krijgen van
de complexe mechanismen die een rol spelen in het veronderstelde homeostatische
Table of Contents
1. Introduction ... 5
1.1 Between-system correlations ... 6
1.2 Types of stressors ... 7
1.3 Electrodermal Activity ... 8
1.4 The current study ... 8
2. Method ... 9
2.1 Procedure ... 9
2.2 Apparatus ... 10
2.3 Materials ... 10
2.4 Design and Participants ... 11
2.5 Plan of Analyses ... 12
3. Results ... 14
4. Discussion ... 16
4.1 Limitations and Future Research ... 17
5. Conclusion ... 18
References ... 19
Appendix A: Informed Consent ... 22
Appendix B: Screen Instructions during SSST ... 23
Appendix C: Screen Instructions during BCG ... 24
1. Introduction
In current stress research it is well acknowledged that acute psychological stress
activates three systems in the body, namely the hypothalamic-pituitary-adrenal axis
(HPA; Hellhammer, Wüst & Kudielka, 2009), the sympathetic nervous system (SNS;
Selye, 1950) and the psychological system (Lazarus, 1966; Lazarus & Folkman, 1984).
Starting in 1936, Hans Selye first introduced the term “stress” and he found out that
chronic stress can make one ill. In 1984, Lazarus and Folkman proposed a
psychological component of stress, cognitive appraisal, and defined stress as the
evaluation of a specific event as threatening to the stability of the individual’s
endocrine, physiological and psychological homeostasis (Andrews, Ali, & Pruessner,
2013; Lazarus & Folkman, 1984). Nowadays, this definition is widely used and the
term homeostasis, the balance between all three systems, is a core assumption in stress
research (e.g. Andrews et al., 2013; Gaab, Rohleder, Nater, & Ehlert, 2005; Ursin &
Eriksen, 2004). This assumed interplay of different systems is currently being used to,
for example, measure stress through biological measures, such as cortisol, heart rate
and skin conductance (Hellhammer et al., 2009). However, although the effect can be
observed, there is a lack of understanding in how this interaction between the
physiological-, endocrine-, and psychological systems works and what the exact
relationship between these systems is. Studies regarding this topic showed mixed
results in the correlations between these systems, ranging from moderate to
non-existent (Campbell & Ehlert, 2012). This inconsistency makes it difficult to create a
comprehensive model that describes the relationship and interaction between all three
systems of stress (Andrews et al., 2013).
As discussed later, one possible explanation for this inconsistency may be the
lack of differentiation between different types of stressors. We propose that if different
stressors lead to variations in the relationship between the physiological system and the
psychological system, this may explain the inconsistencies found in the literature
regarding stress systems. Therefore, the current paper investigates whether a correlation
between the physiological-, and psychological system exists and whether this
1.1 Between-system correlations
When examining the relationships between the physiological-, endocrine-, and
psychological stress systems, most studies adapt Lazarus’ concept of ‘response
coherence’ (Lazarus & Folkman, 1984). This concept suggests that the initial stressor
is perceived and evaluated by the psychological system through first evaluating the
significance or meaning of the stressor and then assessing the available resources and
strategies to cope with it. After that, the psychological system imposes a coherent
response across all systems through interaction between each other (Lazarus &
Folkman, 1984). Therefore, according to Andrews et al., 2013, “one should expect that
being exposed to a stressful event leads to a perception of that event, and the activation
of both the SNS and the HPA” (p. 950). However, this is not what most studies found
(Campbell & Ehlert, 2012). In a meta-analysis, Campbell and Ehlert (2012) reviewed
359 studies that used the Trier Social Stress Test (TSST; Kirschbaum, Pirke, &
Hellhammer, 1993) and found that most of the studies did not find a relationship
between the systems. Furthermore, evidence for this relationship is also absent for other
systems that involve psychological systems such as emotional states, despite the
centrality of this concept in these systems (Evers et al., 2014; Mauss, Levenson,
McCarter, Wilhelm, & Gross, 2005.). This raises the question whether this correlation
between the physiological-, and psychological system exists, and if it does exist, how
can these inconsistencies between studies be explained.
According to Andrews et al. (2013), there are several possible reasons for these
variations. First, the original perception of an event may be masked due to subjective
appraisals of the own emotional reaction that may lead to cognitive and behavioral
responses such as emotion regulation or avoidance which, in turn, may influence the
perception. Secondly, specific characteristics of the individual’s personality, such as
denial, could distort self-reports by altering the awareness of his or her emotions.
Furthermore, as discussed in the next section, research findings may seem
inconsistent because of different activations of the systems, depending on the type of
stressor that is being used. Similar to the postulate of Evers et al. (2014), it is argued
that, instead of always reacting in the same manner, different types of stressors, such as
social-, environmental-, or cognitive stressors, could lead to different responses in the
1.2 Types of stressors
When sorting existing studies into different groups based on the stressor that
was used in the study, study results seem to show more consistent findings. Studies that
employed social stressors such as the Trier Social Stress Test (TSST) or the
Sing-a-Song Stress Test (SSST; Brouwer & Hogervorst, 2014) found non-existent to moderate
correlations between subjective experience and physiological response (Campbell &
Ehlert, 2012; Kudielka, Buske-Kirschbaum, Hellhammer, & Kirschbaum, 2004;
Lundberg & Frankenhaeuser, 1980). However, studies that employed cognitive
stressors did not find these correlations (Elsesser, Freyth, Lohrmann, & Sartory, 2009).
Rather, it is reported that physiological measures react more sensitively to cognitive
stress than self-reports (Knaepen et al., 2015; Luque-Casado, Perales, Cárdenas, &
Sanabria, 2016; Mehler, Reimer, Coughlin, & Dusek, 2009). This means that
physiological responses to the cognitive stressor could be measured although the
respondent did not report any perceived stress. However, this physiological response
did not increase gradually with an increase in cognitive stressors but plateaued
relatively quickly (Luque-Casado et al., 2016; Mehler et al., 2009), suggesting a rather
fixed physiological increase, independent from the level of cognitive stress. Also,
according to Mauss et al. (2005), emotions that involve a stronger cognitive component
were found to have weaker correlations between physiological-, and psychological
systems. Besides that, a third type of stressor, the environmental stressor, is rarely used
in contemporary research. One study that did include an environmental stressor
suggests that self-reports seem to be able to moderately predict physiological responses
(Cohen, 1985). Thus, it seems that self-reported environmental stress and physiological
response would moderately correlate with each other, yet it needs more evidence to
safely make this assumption.
It is important to note that a stressor that provokes a higher absolute
physiological response is more likely to be perceived as stressful by the participant
which, in turn, could lead to a higher correlation between the physiological-, and
psychological systems. Also, less noticeable increases in stress are more likely to be
interpreted in an ambiguous way, leading to a lower correlation between the
physiological-, and psychological system (Campbell & Ehlert, 2012).
Taken together, the differentiation of studies based on the stressor showed more
consistent findings which suggests that there may be differences in correlations between
environmental-, or cognitive stressor is used. Yet, there is no known study that
compares the relationship between these systems across the types of stressors which
leaves this proposition inconclusive. Therefore, the current study examines whether the
correlation between physiological measurements and self-reports in stress differs,
depending on the type of stressor that is used. In order to measure the individual’s
physiological response to stress, electrodermal activity (EDA) was used as an indicator
of stress.
1.3 Electrodermal Activity
Besides heart rate and blood pressure, EDA is one of the most widely used
measures to assess activity of the SNS in stress (Andrews et al., 2013; Boucsein, 2012).
EDA is a common term for all electrical phenomena in the skin and it is recorded in
skin conductance (SC) units. SC can be further divided into tonic (SCL = skin
conductance level) and phasic (SCR = skin conductance response) phenomena
(Boucsein, 2012). SCL indicates the response-free (e.g. baseline) level of skin
conductance whereas SCR typically measures a rapid augmentation of skin
conductance which is mostly the response to an external stimulus (Boucsein, 2012).
The difference between the individual’s response-free level (SCL) and his or her
measured response to a stimulus (SCR) is called amplitude. In the present study, the
relative increase of this amplitude in SCR will be used to measure participants’
physiological response to stress.
1.4 The current study
In the present study, it was investigated whether a correlation between the
physiological-, and psychological system exists and, if so, whether the correlation
between these systems differs, depending on whether a social-, environmental-, or
cognitive stressor is used. In order to answer these questions, participants completed
three different stress tasks while their relative increase in mean amplitude SCR was
measured and their self-reported stress was assessed. This results in the following
research questions:
1. Does a significant correlation between relative increase in mean amplitude SCR
2. Does the correlation between relative increase in mean amplitude SCR and
self-reported stress differ, depending on whether a social-, environmental-, or
cognitive stressor was used?
2. Method
In order to answer the research questions, 55 students took part in a single
session experiment where they were confronted with social-, environmental-, and
cognitive stressors while their relative increase in mean amplitude SCR was measured
and self-reported stress responses were obtained to investigate the relationship between
the physiological- and psychological system.
2.1 Procedure
On arrival at the laboratory, participants were told that they would participate
in a validation study for the Empatica E4 wearable (Empatica Inc.). After the informed
consent was signed (see Appendix A) and all demographic questions were answered,
the physiological sensors were attached and the participants indicated their baseline
stress level. Then, the experiment started and the participants were instructed not to
move and not to speak to the experiment leader since all information were shown on
the monitor and any movements would alter the physiological measures. Next, all three
(social-, environmental-, and cognitive-) stressors including baseline-, and recovery
period were presented in one sequence on the monitor. Between the tasks, participants
were asked to fill in the stress questionnaire on the computer using the trackpad of a
laptop (see Appendix D). The whole experiment took around 30 minutes on average.
During the experiment, the participants were not able to see their own
physiological response to the stressors. The experiment leader sat next to the
participants and wrote down all movements of the participants, if the participants sang
a song during the social stressor and which number the participants picked during the
cognitive stressor. After the experiment, all participants got debriefed and it was
explained that the experiment’s intention was to measure physiological responses- as
well as their subjective perception of stress to examine the relationship between these
Figure 1. Experiment design. BP = Baseline Period, RP = Recovery Period, 𝑁1 = Neutral sentences of the SSST,
𝑁2= Neutral sentences of the BCG, SQ = Stress Questionnaire
2.2 Apparatus
Skin conductance. Skin conductance responses measured using the
SC-Flex/Pro skin conductance sensor (Model: SA9309M, Thought Technology Ltd.).
Electrodes embedded in fastener bands were attached around the medial phalanges of
the index and ring finger. Physiological data was processed by a ProComp Infiniti
encoder. The sampling frequency for all signals was fixed at 256 samples/second.
Software. The experiment was programmed in Python 2.7 and ran with PsychoPy
v1.8 (Source code available on request). All instructions of the experiment were
presented on a 17-inch laptop display.
2.3 Materials
Social stressor. A modified version of the Sing-a-Song Stress Test was used as
a social stressor (Brouwer & Hogervorst, 2014). The participants were asked to sit
quietly and focus on their breathing for two minutes during the baseline period. Then,
they were presented with four cognitive tasks such as: “Think of different animals that
start with the letter P” (see Appendix B). Every task was presented for ten seconds and
then a countdown was shown, counting down from 30 seconds. The fifth task told the
participants to prepare a song that they could sing. After a 30 seconds countdown, the
text:” Now sing a song aloud over the next 30 seconds and try to keep your arms still. Keep singing!” appeared and it was written down whether the participants sang or not.
Then, the participants were again asked to sit quietly and focus on their breathing for
two minutes during the recovery period.
Environmental stressor. After a two-minute baseline period, where participants
were asked to sit quietly and focus on their breathing, participants were presented with
1000Hz beep sounds that lasted for 200ms each and appeared in a fixed random order.
The total duration of the environmental stressor was five minutes with a total of 26 beep
the five-minute period, the participants were asked to focus on their breathing for two
minutes during the recovery period.
Cognitive stressor. In the current study a modified version of the Beauty Contest
Game was used as a cognitive stressor (see Leder, Häusser, & Mojzisch, 2015). The
participants were asked to sit quietly and focus on their breathing for two minutes
during the baseline period. Then, two tasks were presented, namely: “Think of things
you can find in a living room.” and “Think of different animals that start with the letter C” with a 30 second countdown after each sentence (see Appendix C). Next, the Beauty
Contest Game was presented. It was explained that every participant would say a
number between one and one hundred and that the average of all answers would be
calculated. Then, this average would be multiplied by 2/3 and the participant whose
number was closest to the result would win €25 as a gift card. The task description was
presented for 40 seconds and the participant then had 30 seconds to choose a number.
The participants were asked to say the chosen number out loud and not move during
the task.
Stress Questionnaire. The stress questionnaire for reported stress consisted of
the following four items: “How stressed were you BEFORE x?”, “How stressed were you DURING x?”, “How stressed were you RIGHT AFTER x?” and “How stressed are you at this moment?” whereby x was substituted with the specific task name (see
Appendix D). All items were answered on a seven-point multi-item Likert scale (1 –
not at all stressed, 7 – extremely stressed).
2.4 Design and Participants
The research design of this study was correlational as it studied the relationship
between relative increase in mean amplitude SCR and self-reported stress across
different types of stressors (see Fig. 2). The variables in this study were the relative
difference between baseline and stressor in mean amplitude SCR, self-reported stress
and the type of stressor which was either a social-, environmental-, or cognitive stressor.
The study consisted of 55 participants (30,9 % female) with an age range between 19
years and 36 years (M = 24.16, SD = 4.4). All participants in this study were volunteers
and they had the chance to win a €25 gift card. Most participants were students who
were recruited from the Psychology Participants Pool by signing up online and by
Figure 2. Illustration of the potential relationship between the physiological system (skin conductance) and psychological system (reported stress). It was argued that this relationship may differ, depending on whether a social-, environmental-, or cognitive stressor is used.
2.5 Plan of Analyses
All raw data files were first analysed in MATLAB (The MathWorks, Inc.) using
Continuous Decomposition Analysis (CDA) in Ledalab. The amplitude of every skin
conductance peak within a specific marker was computed and per marker and
participant, a mean amplitude score was calculated.
For further analyses, SPSS 22 (The International Business Machines
Corporation, IBM) was used. Descriptive statistics such as frequencies, means and
standard error of means were computed. Next, the mean amplitude scores of all baseline
markers (baseline period and neutral sentences) of the SSST were computed into a
single mean baseline score and this process was repeated to calculate a single mean
baseline score for the BCG. Then, the mean amplitude scores of all markers of the noise
test (beep sounds) were computed into a single mean amplitude score. This way, every
stressor had a single mean baseline score and a single mean amplitude score.
Subsequently, t-tests were carried out to examine whether the mean amplitude scores
of the respective stressor significantly differed from the mean amplitude scores of the
baselines.
After that, for every stressor and participant mean difference scores were
calculated. These scores consisted of the difference between the mean baseline score
and the mean amplitude score of the respective stressor. Furthermore, in order to
account for individual differences in skin conductance response sensibility, a relative
difference score (d) was computed using the following formula:
𝒅 = (𝒚 − 𝒙)
Hereby, y equals the mean amplitude score of the respective stressor while x equals the
baseline score of the stressor. Next, the relative mean amplitude difference scores of all
stressors were checked for outliers. An outlier was defined as a score with a difference
of at least two standard deviations from the mean and participants whose scores were
identified as outliers were excluded from further analyses.
Then, the relative difference scores of every stressor was tested for normal
distribution in order to determine which test should be most appropriate to use. If the
data was normally distributed, then Pearson’s correlation coefficient would be used. If
the data was not normally distributed, then Pearson’s correlation coefficient could not
be used since it requires normal distribution. In this case, Spearman’s rank correlation
coefficient would be used to determine the correlation between participants’
physiological responses and self-reports to stress. In order to test for normal
distribution, the Shapiro-Wilks (S-W) test was used whereby p > .05 was used as an
indication for normal distribution and p ≤ .05 would indicate no normal distribution.
Next, the scores on the stress questionnaire were used to calculate difference scores for
every stressor and participant by subtracting participants’ scores on the question “How stressed were you BEFORE x” from their scores on the question “How stressed were you DURING x” where x was substituted by the respective stressor.
After that, the appropriate test (either Pearson’s correlation coefficient or
Spearman’s rank correlation coefficient) was used to calculate the correlation between
the relative mean amplitude difference score and questionnaire difference score of the
respective stressor. A correlation coefficient between |0.3| and |0.5| was considered
weak, a correlation coefficient between |0.5| and |0.7| was considered moderate and a
correlation coefficient greater than |0.7| was considered strong (Hinkle, Wiersma, &
Jurs, 2002).
In order to examine whether the correlations significantly differ from each other,
we used the following formula from Chen and Popovich (2002) to conduct a t-test for
dependent rs:
𝒕𝑫𝒊𝒇𝒇𝒆𝒓𝒆𝒏𝒄𝒆= (𝒓𝒙𝒚− 𝒓𝒛𝒚) √ (𝒏 − 𝟑)(𝟏 + 𝒓𝒙𝒛)
𝟐(𝟏 − 𝒓𝒙𝒚𝟐− 𝒓
𝒙𝒛𝟐− 𝒓𝒛𝒚𝟐+ 𝟐𝒓𝒙𝒚𝒓𝒙𝒛𝒓𝒛𝒚)
Hereby, x equals the respective relative mean amplitude difference score of a stressor,
y equals the questionnaire difference score and z equals the relative mean amplitude
3. Results
Means and standard error of means of the baselines, stressors, difference scores
and relative difference scores are shown in Table 1. T-tests showed significant
differences in mean amplitudes between respective baseline and stressor when
measuring social stress (SSST), t(54) = -3.56, p < .001, environmental stress (Noise test), t(54) = -3.88, p < .001, and cognitive stress, t(54) = -3.23, p < .003. The normality test showed that neither the SSST (Shapiro-Wilk = 0.96, p = .05), the Noise test
(Shapiro-Wilk = 0.95, p < .05), nor the BCG (Shapiro-Wilk = 0.89, p < 0.05) showed
normal distribution.
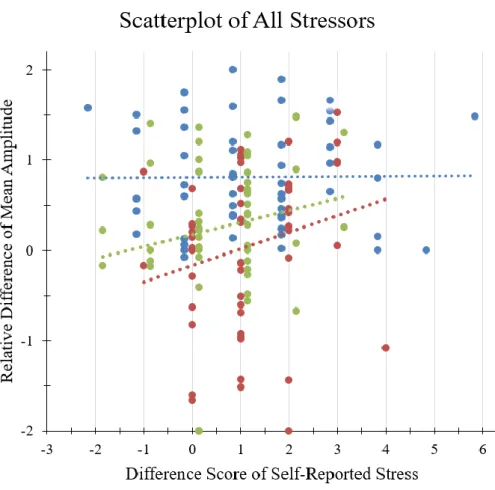
Figure 3. Participants’ self-reported difference between baseline stress and event-related stress and the
relative increase in mean amplitude SCR of all stressors.
Spearman’s rank correlation coefficient was used to compute the correlation
between the overall relative amplitude difference score and the overall difference score
Furthermore, Spearman’s r test was used to examine the correlation between the relative
mean amplitude difference score and the difference score of the self-reports on the
SSST (r(53) = 0.07, p = .65), Noise test (r(53) = .33, p < .05) and BCG (r(53) = .20, p = .16) and it only showed a significant relationship when using the Noise test.
In addition, t-tests were conducted to test whether the calculated correlations
differed significantly from each other. It was found that the correlations of the social
stressor and environmental stressor did not differ significantly, t(52) = -1.51, p > .05. Also, the correlations of the social-, and cognitive stressor as well as the correlations of
the environmental-, and cognitive stressor did not significantly differ from each other,
t(52) = -0.69, p > .05; t(52) = 0.68, p > .05.
Table 1
Means and standard error of mean of Baselines, Stressors, Difference Scores and Relative Difference Scores (N = 55)
Variable Baseline Stressor Difference
Score
Relative Difference score
Overall Amplitude 0.05 (0.01) 0.11 (0.25) 0.06 (0.02) 0.11 (0.02)
SSST Amplitude 0.04 (0.01) 0.14 (0.04) 0.09 (0.03) 0.85 (0.08)
Noise Amplitude 0.05 (0.01) 0.09 (0.02) 0.03 (0.01) 0.05 (0.12)
BCG Amplitude 0.05 (0.01) 0.10 (0.03) 0.06 (0.02) 0.26 (0.12)
Overall Self-Report 2.48 (0.12) 3.49 (0.13) 1.02 (0.10) -
SSST Self-Report 2.44 (0.15) 3.87 (0.21) 1.44 (0.22) -
Noise Self-Report 2.27 (0.13) 3.45 (0.19) 1.18 (0.15) -
4. Discussion
The present study attempted to examine whether a correlation between the
physiological-, and psychological system in stress exists and if this correlation differs,
depending on the type of stressor that is used. Although our findings cannot give a
conclusive answer to the existence of a correlation between the physiological-, and
psychological system, the study does demonstrate that this relationship does not seem
to vary across different types of stressors.
While a significant correlation between physiological-, and psychological
system was measured when using an environmental stressor, the other two stressors did
not show a significant correlation which also led to a non-significant overall correlation.
Thus, the research question whether a relationship between physiological-, and
psychological system exists cannot decisively be answered. Furthermore, although the
environmental stressor was the only one to show a significant correlation, the
differences between the correlations were not significant. This finding suggests that the
relationship between physiological-, and psychological system may not differ across
different types of stressors and, hence, the second research question has to be rejected.
This result is in line with the meta-analysis of Campbell and Ehlert (2012) which
found that most conducted studies on this topic failed to show significant relationships
between the systems. As discussed in Campbell and Ehlert (2012) as well as in Andrews
et al. (2013), a possible reason for these findings may be that most studies try to find a
linear correlation between the systems. Instead, it was argued that the relationship
between physiological-, endocrine-, and psychological systems may not be linear or
monotonic in nature but more complex, such as curvilinear (Campbell & Ehlert, 2012)
or complementary (Andrews et al., 2013). However, although it is beyond the scope of
this study to investigate the exact interaction between the systems, scatter plots of our
dataset did not support such an interpretation.
Furthermore, since the correlation between physiological-, and psychological
system was significant in the environmental stressor but not in other stressors, this raises
the question which variables may have led to this finding. One could argue that
differences in absolute SCRs between the stressors may be a contributing factor to this
inconsistent finding. However, all three stressors did elicit significantly higher SCRs
compared to their respective baselines and while the SSST showed the strongest
than the Noise Test and BCG. In contrary, the environmental stressor, which did show
a significant correlation between physiological-, and psychological system, elicited
significantly lower (absolute) mean amplitude SCR than the other two stressors.
Therefore, absolute differences in SCRs between stressors cannot explain this finding.
Another possible reason may be that cognitive engagement in a task may
influence the participant’s awareness of the own stress level. According to Mauss et al.
(2005), a stronger cognitive component in emotions were found to have weaker
correlations between physiological-, and psychological systems. Thus, while
participants were cognitively engaged during the SSST and BCG, they were not
cognitively engaged during the Noise Test which, in turn, may have led to higher
awareness of the participant’s perceived stress. Also, the environmental stressor is the
only type of stressor that elicits stress based on an external stimulus whereas the
stimulation of social-, and cognitive stress is largely based on the participant’s appraisal
of the stimulus (e.g. anticipating negative consequences) (Lazarus & Folkman, 1984).
This appraisal process may lead to more ambiguous interpretations of the stressful event
and, therefore, may lead to lower correlations between the physiological-, and
psychological system.
Taken together, although a relationship between the physiological-, and
psychological system and its’ differences across several types of stressors could not be
confirmed, the study demonstrates that the interaction between the different systems
involved in stress may be more complex than initially assumed.
4.1 Limitations and Future Research
The findings should be considered in light of a number of limitations. First,
measures of HPA-axis activity were not included in the study. Since homeostasis is a
process that involves the physiological-, psychological- as well as the endocrine system,
the implementation of HPA-axis measures (e.g. cortisol) could be beneficial for a more
complete understanding of the response system. However, since these measures peak
twenty to thirty minutes after exposure to the stressor, it is reasonable to assume that
the endocrine system may play a significant role in long-term stress (e.g. chronic stress)
while exposure to short and acute stressors would mainly affect the fast changing
nervous system and the psychological system (Andrews et al., 2013).
Besides that, self-reported stress measures to indicate participants’ stress level
participants’ stress level responses since rapidly changing emotional states may interact
with parts of the psychological system, such as cognitive appraisal processes that, in
turn, may lead to different results (Campbell & Ehlert, 2012).
Since the main objective of the present study was to investigate the relationship
between the physiological-, and psychological system in stress, it was chosen to take
mean scores of the physiological data and self-reports. However, through this method
individual differences between participants were neglected. Therefore, for future
research it would be interesting to combine the present experiment design (i.e. every
participant gets exposed to several different types of stressors) with an analysis of
individual correlations per participant. This way, patterns (e.g. clusters) may become
visible which could reveal new insights in how individuals differ in their overall as well
as stressor-specific perception of stress. Eventually, this approach may help to explain
the inconsistencies in the literature regarding the interaction between all three systems
in stress.
5. Conclusion
The present study could not give a conclusive answer to the existence of a
correlation between the physiological-, and psychological system. However, the study
does provide first evidence that this relationship does not seem to differ when
differentiated based on different types of stressors. Future research is needed to uncover
the underlying reasons for these inconsistencies found in literature regarding the
interaction between the involved systems in stress. These insights can help to further
understand the complex mechanisms in the assumed homeostatic process between
References
Andrews, J., Ali, N., & Pruessner, J. C. (2013). Reflections on the interaction of
psychogenic stress systems in humans: the stress coherence/compensation model.
Psychoneuroendocrinology, 38(7), 947–61. http://doi.org/10.1016/j.psyneuen.2013.02.010
Brouwer, A.-M., & Hogervorst, M. A. (2014). A new paradigm to induce mental
stress: the Sing-a-Song Stress Test (SSST). Frontiers in Neuroscience, 8, 224. http://doi.org/10.3389/fnins.2014.00224
Boucsein, W. (2012). Electrodermal activity. Springer Science & Business Media.
Campbell, J., & Ehlert, U. (2012). Acute psychosocial stress: does the emotional
stress response correspond with physiological responses?
Psychoneuroendocrinology, 37(8), 1111–34. http://doi.org/10.1016/j.psyneuen.2011.12.010
Chen, P. Y., & Popovich, P. M. (2002). Correlation: Parametric and nonparametric measures (No. 137-139). Sage.
Cohen, S. (1985). Cognitive Processes as Determinants of Environmental Stress.
Issues in Menthal Health Nursing, 7(4), 65-81
Elsesser, K., Freyth, C., Lohrmann, T., & Sartory, G. (2009). Dysfunctional cognitive
appraisal and psychophysiological reactivity in acute stress disorder. Journal of Anxiety Disorders, 23(7), 979–985. http://doi.org/10.1016/j.janxdis.2009.06.007
Evers, C., Hopp, H., Gross, J. J., Fischer, A. H., Manstead, A. S. R., & Mauss, I. B.
(2014). Emotion response coherence: a dual-process perspective. Biological Psychology, 98, 43–9. http://doi.org/10.1016/j.biopsycho.2013.11.003
Gaab, J., Rohleder, N., Nater, U. M., & Ehlert, U. (2005). Psychological determinants
of the cortisol stress response: the role of anticipatory cognitive appraisal.
Psychoneuroendocrinology, 30(6), 599–610. http://doi.org/10.1016/j.psyneuen.2005.02.001
Hellhammer, D. H., Wüst, S., & Kudielka, B. M. (2009). Salivary cortisol as a
Hinkle, D.E., Wiersma, W., & Jurs, J.G. (2002). Applied Statistics for the Behavioral Sciences (5th ed.). Boston, MA:Houghton Mifflin
Kirschbaum, C., Pirke, K. M., & Hellhammer, D. H. (1993). The “Trier Social Stress
Test”--a tool for investigating psychobiological stress responses in a laboratory
setting. Neuropsychobiology, 28(1-2), 76–81. http://doi.org/119004
Knaepen, K., Marusic, U., Crea, S., Rodríguez Guerrero, C. D., Vitiello, N., Pattyn,
N., … Meeusen, R. (2015). Psychophysiological response to cognitive workload
during symmetrical, asymmetrical and dual-task walking. Human Movement Science, 40, 248–263. http://doi.org/10.1016/j.humov.2015.01.001
Kudielka, B. M., Buske-Kirschbaum, A., Hellhammer, D. H., & Kirschbaum, C.
(2004). Differential heart rate reactivity and recovery after psychosocial stress
(TSST) in healthy children, younger adults, and elderly adults: the impact of age
and gender. International Journal of Behavioral Medicine, 11(2), 116–21. http://doi.org/10.1207/s15327558ijbm1102_8
Lazarus, R., & Folkman, S. (1984). Stress, appraisal, and coping. Retrieved from
https://books.google.de/books?hl=de&lr=&id=i-ySQQuUpr8C&oi=fnd&pg=PR5&dq=lazarus&ots=DeHTmohkSd&sig=5pDUG
J2PhXQxbTb6FuMzlCF0D7I
Lazarus, R. S. (1966). Psychological stress and the coping process. McGrawHill series in psychology.
Leder, J., Häusser, J. A., & Mojzisch, A. (2015). Exploring the underpinnings of
impaired strategic decision-making under stress. Journal of Economic Psychology, 49, 133–140. http://doi.org/10.1016/j.joep.2015.05.006
Lundberg, U., & Frankenhaeuser, M. (1980). Pituitary-adrenal and
sympathetic-adrenal correlates of distress and effort. Journal of Psychosomatic Research,
24(3-4), 125–130. http://doi.org/10.1016/0022-3999(80)90033-1
Luque-Casado, A., Perales, J. C., Cárdenas, D., & Sanabria, D. (2016). Heart rate
variability and cognitive processing: The autonomic response to task demands.
Biological Psychology, 113, 83–90.
Mauss, I. B., Levenson, R. W., McCarter, L., Wilhelm, F. H., & Gross, J. J. (n.d.).
The Tie That Binds? Coherence Among Emotion Experience, Behavior, and
Physiology.
Mehler, B., Reimer, B., Coughlin, J. F., & Dusek, J. a. (2009). Impact of Incremental
Increases in Cognitive Workload on Physiological Arousal and Performance in
Young Adult Drivers. Transportation Research Record: Journal of the
Transportation Research Board, (2138), 6–12. http://doi.org/10.3141/2138-02
Selye, H. (1950). The physiology and pathology of exposure to stress. Retrieved from
http://psycnet.apa.org/psycinfo/1951-02788-000
Ursin, H., & Eriksen, H. R. (2004). The cognitive activation theory of stress.
Appendices
Appendix A: Informed Consent
Informed consent
Titel: a validation study: how does your body respond?
Introduction
We are Tabea, Daniel and Daniela, all students of the University of Twente, and we are doing research on the validity of the E4 wristband. The Empatica E4 wristband is a new device to monitor physiological signals in real-time and it is being used in all kinds of research topics that involve physiological measures such as epilepsy and alcoholism. As part of this validity research we will ask you to do four different tasks, while being attached to some measurement devices: the E4 wristband, a skin
conductance sensor and a heart rate monitor. The tasks you will have to do are
presented on the computer screen and we ask you to move as little as possible in order to get flawless data.
We will give you an opportunity at the end to review your remarks, and you can ask to modify or remove portions of those, if you do not agree with our notes or if we did not understand you correctly.
If you have any questions, you can ask them now or later. If you wish to ask questions later, you may contact any of the following:
Tabea Bonus: [email protected]
Daniel Lutscher: [email protected]
Daniela Guddorp: [email protected]
Informed consent
I explain that I am informed about the nature, method, and goal of the research. I know that the data and the results are being used anonymously and confidential and will solely be used for scientific analysis and presentation. My questions about the research have been answered satisfactorily.
I have read the foregoing information, or it has been read to me. I have had the opportunity to ask questions about it and any questions I have been asked have been answered to my satisfaction. I consent voluntarily to be a participant in this study
Print Name of Participant__________________ Signature of Participant ___________________ Date ___________________________
Appendix B: Screen Instructions during SSST
Screen instruction Time
Sit quietly, try to relax and focus your attention on your breathing while you see the countdown.
2 Minutes
Think of different animals that start with the letter P. 30 Seconds
Think of things you can find in a kitchen. 30 Seconds
Think of several things that are important if you want to organize a wedding.
30 Seconds
Think of as many team sports practiced without a ball as you can.
30 Seconds
The next task will be to sing a song aloud - think of a song you can sing.
30 Seconds
Now sing a song aloud over the next 30 seconds and try to keep your arms still. Keep singing!
30 Seconds
Sit quietly, try to relax and focus your attention on your breathing while you see the countdown.
Appendix C: Screen Instructions during BCG
Screen instruction Time
Sit quietly, try to relax and focus your attention on your breathing while you see the countdown.
2 Minutes
Think of things you can find in a living room. 30 Seconds
Think of different animals that start with the letter C 30 Seconds
Please work on the following decision task: Each participant of this study will write down a number between zero (0) and one hundred (100). Zero and one hundred are also possible. We will calculate the
average, which is the mean of all numbers picked. Then we will multiply the mean with 2/3. The resulting number will be the target number. To win the game, you should pick a number that is as close
as possible to this target number.
40 Seconds
The participant whose picked number is closest to the target number, 2/3 of the mean, will win the game
and receives a 25 Euro voucher. Please say your chosen number out loud when the countdown has
expired. Please do not move.
60 Seconds
Please say your chosen number out loud. Do not move.
Appendix D: Questions of the Stress Questionnaire
Before starting the SSST:
1. How stressed are you at this moment?
After the recovery period of the SSST:
1. How stressed were you in the minute BEFORE singing the song?
2. How stressed were you WHILE singing the song?
3. How stressed were you RIGHT AFTER singing the song?
4. How stressed are you at this moment?
After the recovery period of the Noise Test:
1. How stressed were you BEFORE the Noise Test?
2. How stressed were you DURING the Noise Test?
3. How stressed were you RIGHT AFTER the Noise Test?
4. How stressed are you at this moment?
After the BCG:
1. How stressed were you BEFORE choosing a number?
2. How stressed were you WHILE choosing a number?